Stock Trends Insights: Bullish Momentum in Consumer Discretionary and Healthcare

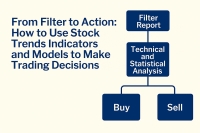
At Stock Trends, our mission is to help investors navigate market cycles by combining our proprietary indicator framework with disciplined interpretation of sector and stock-level signals. In the trading week ended August 8, 2025, our Stock Trends Inference Model (ST-IM) and trend distribution analysis pointed clearly toward two sectors with particularly attractive bullish setups: Consumer Discretionary in the Early Breakout stage, and Healthcare in Established Bullish Trends.
This week’s Stock Trends indicators spotlight a two‑track opportunity: early breakouts in Consumer Discretionary and established bullish trends in Healthcare. Using our trend regime, trend age, RSI outperformance, and volume context—augmented by ST‑IM and our epoch research—we highlight how the framework guided us to Fly‑E Group and MEDIROM on the breakout side, and to OptimizeRx, Adaptive Biotechnologies, ABVC BioPharma, and Eupraxia Pharmaceuticals among enduring leaders.


 I've followed your recommendations since reading your columns in the Globe & Mail, and finding they published Stock Trends arrows in their financial listings. I do find them a guide to the general market and what I should be avoiding for declining chart trends.


