Each week, the Stock Trends system analyzes thousands of stocks from the NYSE, Nasdaq, NYSE American, and TSX exchanges, assigning a trend classification to each security based on its relationship to the 13-week and 40-week moving averages. This moving average study—a foundational method in technical analysis—provides insight into the primary and intermediate-term trends that drive investor sentiment and market momentum. The aggregated results of these trend classifications form the Stock Trends Indicator Distributions, offering a valuable snapshot of market health and trend direction across sectors and regions.
The six core Stock Trends indicators—Bullish (![]() ), Weak Bullish (
), Weak Bullish (![]() ), Bullish Crossover (
), Bullish Crossover (![]() ), Bearish (
), Bearish (![]() ), Weak Bearish (
), Weak Bearish (![]() ), and Bearish Crossover (
), and Bearish Crossover (![]() )—are derived from a simple yet powerful interpretation of price behavior. As described in Chapter 4 of the Stock Trends Handbook, these indicators are not mere labels, but systematic reflections of trend strength, momentum, and potential reversal. The Bullish (
)—are derived from a simple yet powerful interpretation of price behavior. As described in Chapter 4 of the Stock Trends Handbook, these indicators are not mere labels, but systematic reflections of trend strength, momentum, and potential reversal. The Bullish (![]() ) indicator identifies stocks where the current price is above both the 13-week and 40-week moving averages, confirming a sustained uptrend. The Weak Bullish (
) indicator identifies stocks where the current price is above both the 13-week and 40-week moving averages, confirming a sustained uptrend. The Weak Bullish (![]() ) classification indicates that while the stock remains above its 40-week average, it has fallen below the 13-week average—often signaling waning momentum and a potential reversal. This condition frequently precedes a Bearish Crossover, where the price breaks below the 13-week average while still above the longer-term trend, denoted by the
) classification indicates that while the stock remains above its 40-week average, it has fallen below the 13-week average—often signaling waning momentum and a potential reversal. This condition frequently precedes a Bearish Crossover, where the price breaks below the 13-week average while still above the longer-term trend, denoted by the ![]() symbol.
symbol.
Conversely, the Bearish (![]() ) indicator flags stocks where the price has dropped below both moving averages, signifying a dominant downtrend. The Weak Bearish (
) indicator flags stocks where the price has dropped below both moving averages, signifying a dominant downtrend. The Weak Bearish (![]() ) label applies when the price recovers above the 13-week average but remains below the 40-week average—a countertrend move that sometimes leads to a Bullish Crossover, identified by the
) label applies when the price recovers above the 13-week average but remains below the 40-week average—a countertrend move that sometimes leads to a Bullish Crossover, identified by the ![]() indicator. These transitional states—Weak Bullish and Weak Bearish—represent critical pivot zones in market cycles. Their aggregate behavior over time, especially when measured across broad market indices, provides important clues to emerging bullish or bearish environments.
indicator. These transitional states—Weak Bullish and Weak Bearish—represent critical pivot zones in market cycles. Their aggregate behavior over time, especially when measured across broad market indices, provides important clues to emerging bullish or bearish environments.
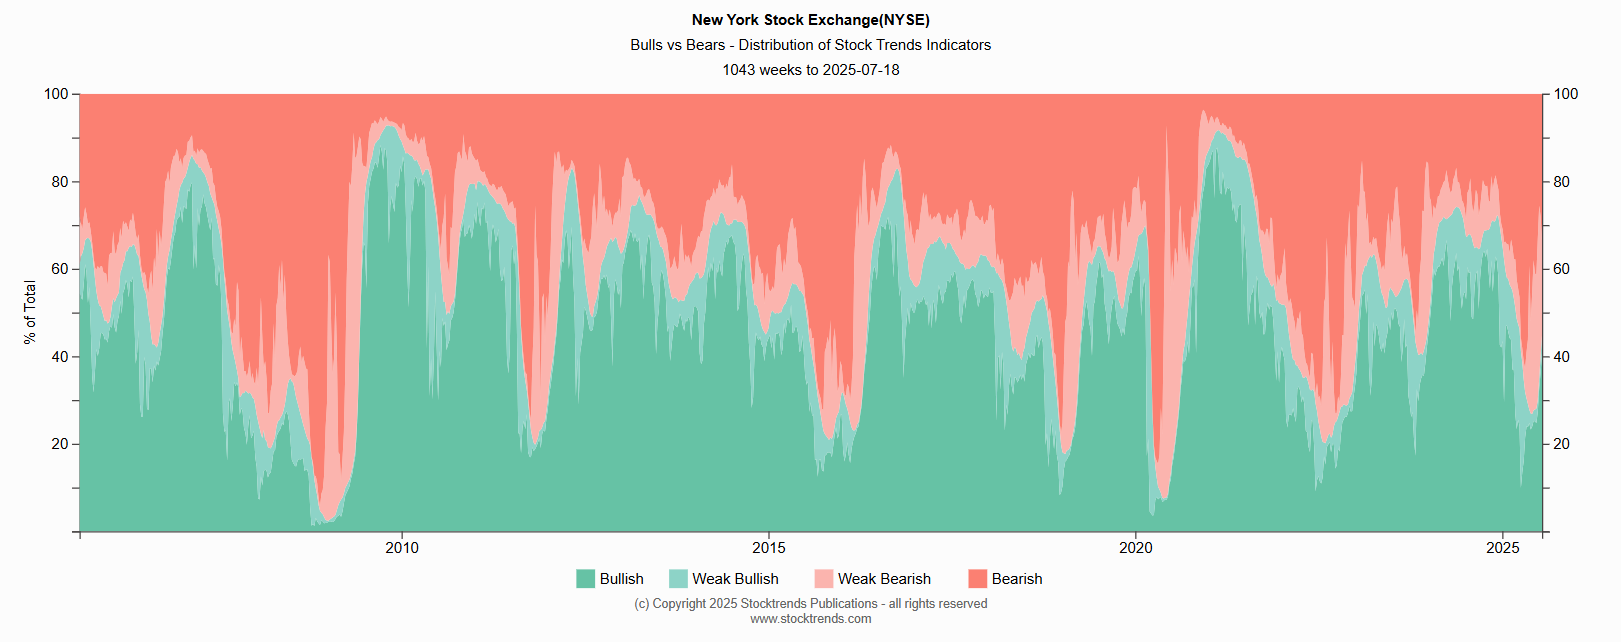
The historical record of these distributions, as compiled by Stock Trends over more than two decades, reveals consistent patterns that accompany major market phases. Periods of rising Bullish and Bullish Crossover indicators, coupled with declining Bearish readings, typically precede or coincide with bull market cycles. Conversely, expanding Bearish and Bearish Crossover distributions, especially when accompanied by a rising share of Weak Bullish indicators, tend to occur in the late stages of bullish trends or early stages of bear markets. The 2008 financial crisis, the 2020 pandemic market crash, and the more recent 2022 correction all illustrate these relationships vividly in the indicator distribution data.
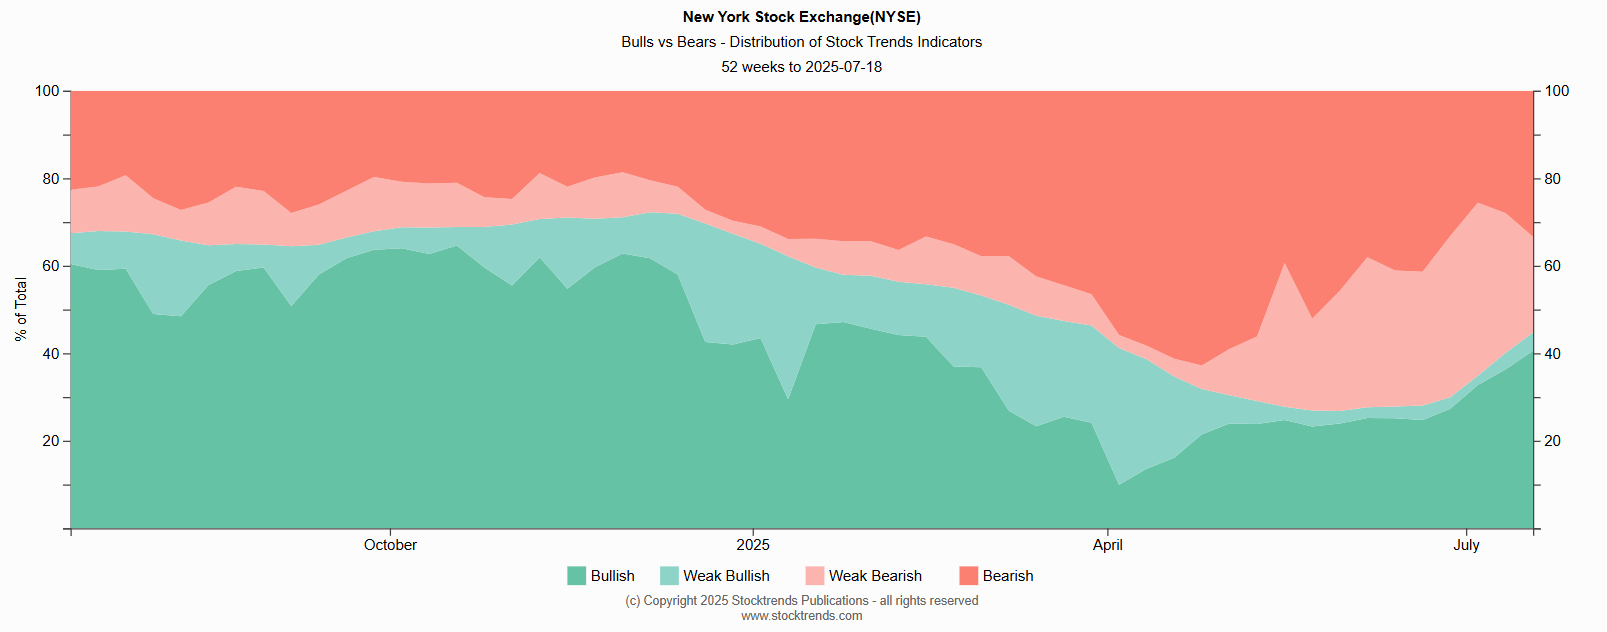
This week's update for the period ending July 18, 2025, offers a snapshot that reflects potential transition and divergence among the major exchanges. The New York Stock Exchange (NYSE) shows a bullish tone, with 35.3% of trending stocks classified as Bullish and an additional 5.2% flagged as Bullish Crossovers. This expansion in bullish leadership is accompanied by a sharp drop in Weak Bearish indicators, down 10.1% from the previous week to 21.9%. Such a steep decline in Weak Bearish stocks suggests that many issues have transitioned into stronger trend categories or exited a countertrend phase. Weak Bullish indicators rose slightly to 4.2%, potentially reflecting some stocks losing momentum, but not enough to alter the general bullish backdrop. The NYSE Bull/Bear ratio now stands at 0.81, supporting a cautiously optimistic view.
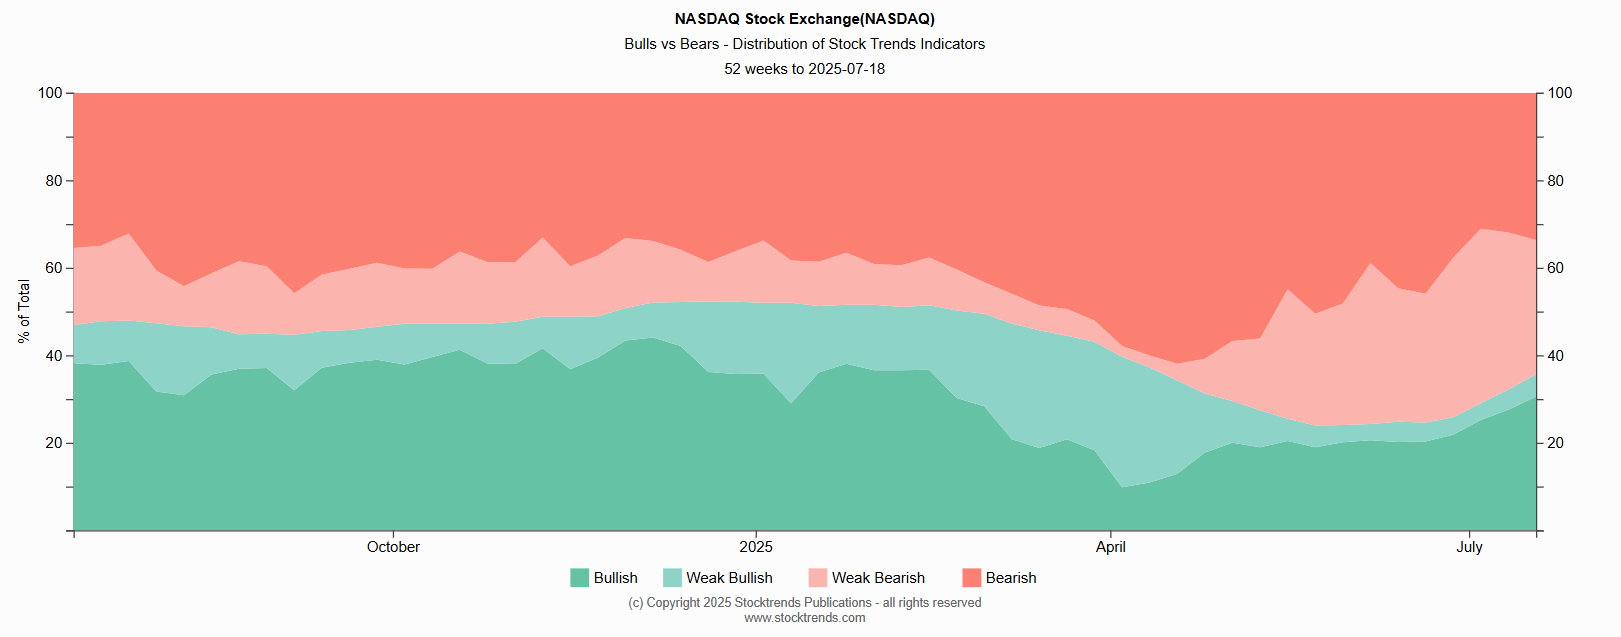
The Nasdaq presents a slightly more neutral profile. Bullish stocks account for 26.8% of the exchange’s trending stocks, up from the previous week, while Bullish Crossovers increased to 3.8%. Weak Bearish stocks, however, remain elevated at 30.7%, albeit with a notable weekly decline of 5.2%. This suggests a slow unwinding of negative momentum, but not yet a clear pivot to broad bullish participation. The Bearish category, at 33.4%, still outweighs the Bullish share, resulting in a Bull/Bear ratio of 0.55. This imbalance reflects the Nasdaq’s continued exposure to weak sectors, particularly technology stocks that led the market in prior years but now face more selective leadership.
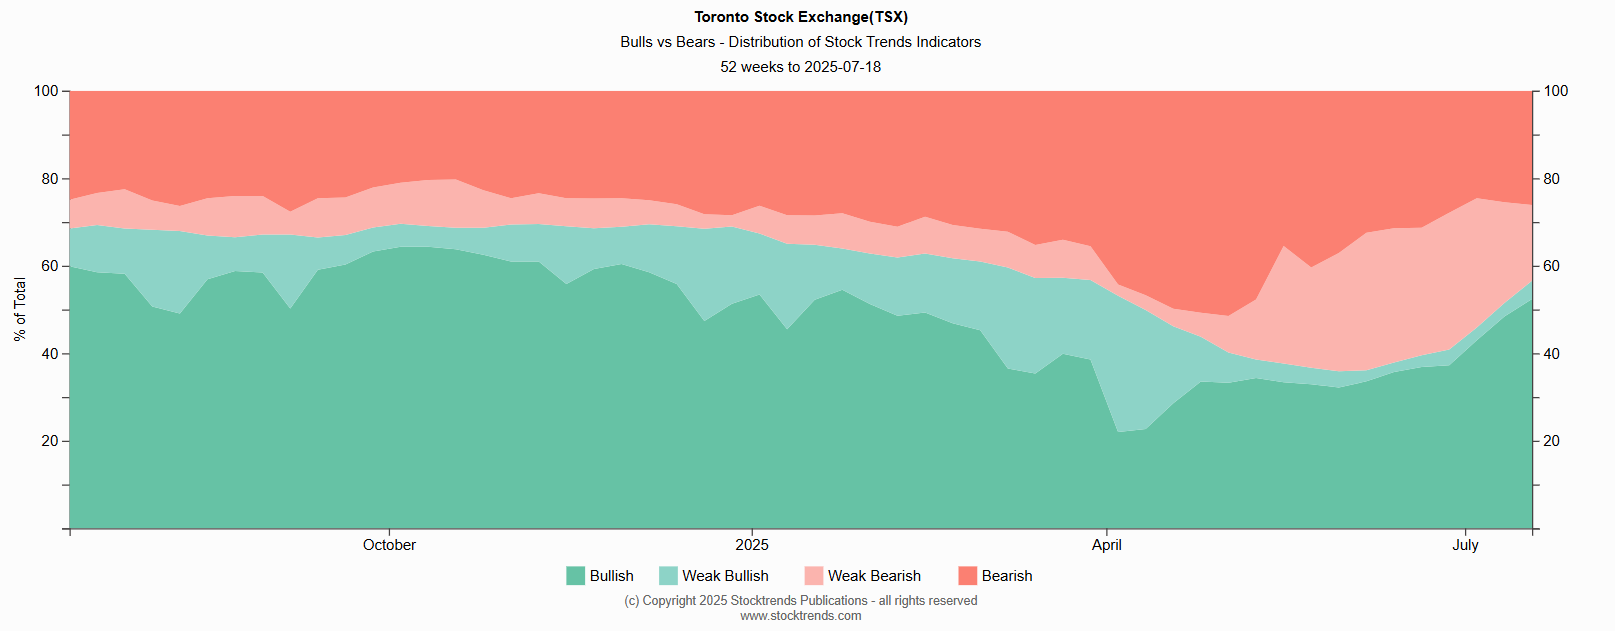
The TSX remains the most structurally bullish of the three exchanges. Nearly half (46.1%) of its trending stocks are in Bullish territory, and an additional 6.3% are Bullish Crossovers. This marks a steady four-week advance in bullish indicators, signaling robust participation across sectors like financials, energy, and materials. Weak Bearish stocks declined further to 17.3%, and the Bearish category fell to 24.9%, reinforcing the strength of the TSX trend profile. With a Bull/Bear ratio of 1.30, the Canadian market exhibits classic mid-cycle leadership, where trend confirmation is not only broad but sustained.
Taken together, these distributions highlight a market that is transitioning, with evidence of trend improvement in the NYSE and TSX, and a more tentative setup in the Nasdaq. As emphasized in Chapter 6 of the Stock Trends Handbook, the cumulative behavior of these indicators across time frames forms the basis for understanding market cycles and positioning portfolios. The recent decline in Weak Bearish readings across all exchanges, especially when coupled with increased Bullish Crossover activity, signals a shift that may precede more widespread trend participation. Historical data supports the view that such transitions, particularly when sustained over multiple weeks, often mark the early phases of market recoveries or uptrends.
The Stock Trends distributions are not merely weekly data points—they are the statistical scaffolding of market trend structure. For new users of the Stock Trends platform, these classifications offer a lens into how technical signals evolve across thousands of stocks. Combined with tools such as the Stock Trends Inference Model and RSI Pattern Models, these indicators become more than trend labels—they form the empirical foundation of informed market navigation.
In a world increasingly driven by narratives and noise, the quiet discipline of the Stock Trends moving average study continues to offer clarity. The current data, viewed within the context of over two decades of market history, reinforces the enduring value of systematic trend analysis.
Related items
- Understanding Our Assumptions — A Decade Later
- Navigating Market Turmoil in December 2025 – How Stock Trends Guides Investors
- TJX at New Highs — A Case Study in Long-Run Trend Persistence and Momentum Rotation
- Positioning for Opportunity: Trade Detente and Stock Trends Momentum
- Using the Stock Trends Reports in Market Corrections
 I find your website and research very helpful in my stock trading. I have subscribed to several related services in the past and none present their work with “just the facts” as you. Please keep up the great work so that I can continue to learn!


