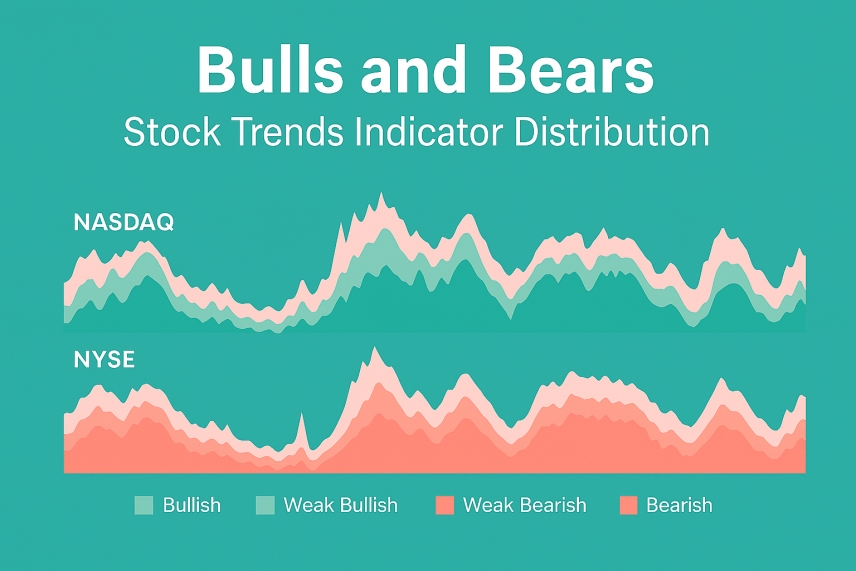
Each week, the Stock Trends system analyzes thousands of stocks from the NYSE, Nasdaq, NYSE American, and TSX exchanges, assigning a trend classification to each security based on its relationship to the 13-week and 40-week moving averages. This moving average study—a foundational method in technical analysis—provides insight into the primary and intermediate-term trends that drive investor sentiment and market momentum. The aggregated results of these trend classifications form the Stock Trends Indicator Distributions, offering a valuable snapshot of market health and trend direction across sectors and regions.
Stock Trends Indicator Distributions: A Historical Context and the Current Market Pulse
- Published in Stock Trends
 You have created and maintained an amazing, highly educational program and I am grateful for your part in getting our retirement funds to the good place they are.


