TSX Financials Bullish CrossoverCurrent Strategy SummaryBuys: 0 Sells: 0 Performance2026 ytd: +0.4% |
| Current Portfolio Report | Portfolio History Report |
| (subscribers only - Login ID and password required) |
|
The TSX Financials Bullish Crossover Portfolio trading strategy:
|
|---|
|
BUY a TSX-listed Financials stock when:
tagged with a “Bullish Crossover” indicator
|
|
SELL a stock when:
tagged with a “Bearish Crossover” indicator
|
Exposure to each position is limited to $10,000.
Transaction costs are factored into the cost of purchases and the net proceeds of sales at 1% in and 1% out, or 2% commission on a round trip.
ST TSX Financials Bullish Crossovers Portfolio Strategy Performance - 1995 to 2021:
| Year | Avg Invested Capital ($) | Net Gain/(Loss) ($) | ST Portfolio (%)* | S&P/TSX(%) | Difference (%) |
| 2021 | 210,189 | 60,916 | 29.0 | 21.7 | 7.3 |
| 2020 | 54,906 | 16,759 | 32.4 | 2.7 | 29.7 |
| 2019 | 15,283 | 873 | 5.8 | 20.7 | -14.9 |
| 2018 | 98,491 | -18,067 | -18.0 | -12.3 | -5.7 |
| 2017 | 135,660 | 989 | 0.7 | 6.0 | -5.3 |
| 2016 | 125,660 | 9,256 | 7.4 | 17.5 | -10.1 |
| 2015 | 70,566 | -16,264 | -23.1 | -8.9 | -14.2 |
| 2014 | 180,377 | 17,511 | 9.7 | 7.5 | 2.2 |
| 2013 | 171,132 | 48,118 | 28.2 | 10.3 | 17.9 |
| 2012 | 104,151 | -9,428 | -9.1 | 3.0 | -12.1 |
| 2011 | 107,547 | -10,754 | -9.8 | -11.1 | 1.3 |
| 2010 | 137,358 | -5,219 | -3.8 | 14.5 | -18.3 |
| 2009 | 110,189 | 31,497 | 28.9 | 41.4 | -12.5 |
| 2008 | 30,943 | -26,357 | -84.1 | -39.9 | -44.2 |
| 2007 | 162,264 | 16,457 | 10.1 | 7.1 | 3.0 |
| 2006 | 166,226 | 31,005 | 18.7 | 14.3 | 4.4 |
| 2005 | 182,075 | 47,016 | 25.8 | 21.9 | 3.9 |
| 2004 | 150,566 | 15,229 | 10.1 | 13.5 | -3.4 |
| 2003 | 134,717 | 31,261 | 23.4 | 23.1 | 0.3 |
| 2002 | 75,660 | -16,330 | -21.3 | -13.6 | -7.7 |
| 2001 | 96,226 | 8,244 | 8.5 | -13.8 | 22.3 |
| 2000 | 84,528 | 32,090 | 38.4 | 5.6 | 32.8 |
| 1999 | 33,019 | -13,445 | -40.4 | 29.6 | -70.0 |
| 1998 | 73,019 | -34,410 | -46.4 | -1.1 | -45.3 |
| 1997 | 109,623 | 89,681 | 81.7 | 11.5 | 70.2 |
| 1996 | 101,698 | 70,469 | 69.4 | 25.1 | 44.3 |
| 1995 | 87,358 | 13,809 | 15.8 | 11.6 | 4.2 |
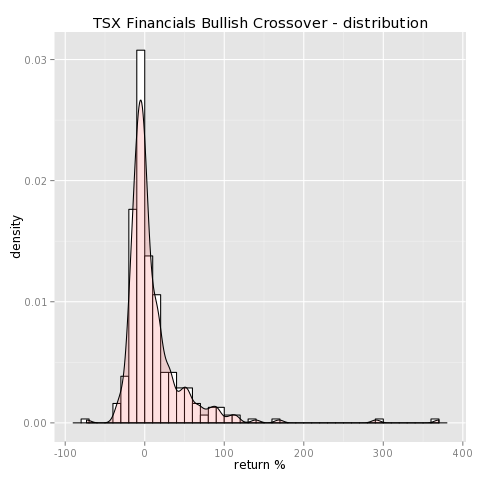
Trading Statistics
| Total # of positions taken: | 340 |
| # of winning positions (winning %): | 164 (48.2%) |
| Average gain(%) per winning position: | 35% |
| Average loss(%) per losing position: | 10% |
| Profit factor**: | 3.1 |
| Maximum gain(%) on a position: | 370% |
| Maximum loss(%): | -73% |
| Annualized return on average invested capital: | 12.9% |
| Average invested capital: | $110,786 |
| Average # of positions held: | 11 |
| Average # of weeks invested in each position: | 46 |
|
* trading stats compiled at December 31, 2021 **Profit Factor = (% of winning trades X average $ gains on winning trades) / ABSOLUTE VALUE[(% of losing trades X average $ losses on losing trades)] |
|


