
In the current Stock Trends data, almost 700 stocks are pressing to new 52-week highs despite late-year volatility in the broader equity benchmarks. Among these leaders, TJX Companies (TJX-N) continues to stand out not merely for its price strength today, but for its extraordinary multi-year trend persistence within the Stock Trends framework.
TJX has previously been highlighted in Stock Trends Editorials (Long and Strong - Bullish Trends in Specialized Retailers) as the longest-running bullish NYSE stock, maintaining extended periods of Bullish (![]() ) and Weak Bullish (
) and Weak Bullish (![]() ) classifications with only brief interruptions. Its price is again advancing to new highs in the current dataset, reaffirming the durability of its underlying trend. When viewed through the lens of the Stock Trends indicators—trend category, trend age, volume patterns, and RSI momentum triggers—TJX offers a textbook demonstration of how disciplined, rules-based trend analysis can help investors capitalize on long-run winners while avoiding noise and false signals.
) classifications with only brief interruptions. Its price is again advancing to new highs in the current dataset, reaffirming the durability of its underlying trend. When viewed through the lens of the Stock Trends indicators—trend category, trend age, volume patterns, and RSI momentum triggers—TJX offers a textbook demonstration of how disciplined, rules-based trend analysis can help investors capitalize on long-run winners while avoiding noise and false signals.
Trend Persistence and the Stock Trends Strength Indicator
The Stock Trends strength indicator, derived from the trend category and trend age (trend_cnt), quantifies the durability of an underlying directional move. In TJX, episodes of Bullish (![]() ) classification frequently extend into very long trend ages, indicating a sustained period in which buyers have remained in control and intermediate-term weakness has failed to break the trend structure.
) classification frequently extend into very long trend ages, indicating a sustained period in which buyers have remained in control and intermediate-term weakness has failed to break the trend structure.
Historically, TJX’s long-duration bullish phases have been accompanied by:
- Consistent higher highs and higher lows, even when the broad market experienced intermediate corrections.
- Stable or rising RSI readings above the S&P 500, signifying durable relative strength.
- Shallow pullbacks that showed up in the data as brief transitions into Weak Bullish (
 ), usually before regaining
  status.
These characteristics demonstrate why TJX is often used internally as an exemplar of “trend reliability” within the Stock Trends framework. The structure of its price action conforms exceptionally well to the statistical tendencies embedded in the Stock Trends model—particularly the high forward return probabilities observed in long-running Bullish stocks with rising trend counts.
RSI and Momentum Rotation: How Stock Trends Users Could Have Traded TJX
One of the most powerful aspects of the Stock Trends methodology is its pairing of trend direction with relative strength momentum, measured by RSI and RSI +/-. TJX’s long-run performance demonstrates how these metrics guide timing and trade management.
RSI Upturns During Bullish Trend Phases
Across TJX’s history, many of its most productive advances have been marked by:
- Rising RSI readings above 100 during persistent Bullish () phases.
- RSI +/- = + signals coinciding with new highs or re-accelerating momentum.
In these environments, the Stock Trends model indicates that the probability of benchmark outperformance increases, particularly when the broader sector—Consumer Discretionary and related retail groups—also shows improving trend distributions and relative strength. For the disciplined Stock Trends user, these are the weeks when the case for holding or adding to TJX is strongest.
Weak Bullish (), RSI Dips, and High-Probability Entry Zones
Some of the most attractive historical entry points in TJX have occurred when:
- The trend slipped temporarily from to , signalling a pause rather than a reversal.
- RSI pulled back toward or slightly below the 100 level, reflecting a cooling of momentum relative to the S&P 500.
- RSI +/- quickly flipped back to + as buyers resumed control.
Within the Stock Trends framework, this combination—a short-term momentum dip inside a long-term Bullish structure—often defines a statistically favorable accumulation zone. For investors following the Stock Trends Weekly Reporter and using the Stock Trends strength indicator, these were periods when TJX could be bought with confidence, with the expectation that the dominant Bullish trend would reassert itself.
Brief Bearish Phases and Risk Containment
Unlike many cyclical or financially fragile equities, TJX has rarely sustained long Bearish (![]() ) or Weak Bearish (
) or Weak Bearish (![]() ) trend phases in the Stock Trends record. When Bearish classifications have appeared, they have tended to be:
) trend phases in the Stock Trends record. When Bearish classifications have appeared, they have tended to be:
- Short in duration, often resolving within a modest number of weeks.
- Accompanied by limited deterioration in RSI, with relative strength stabilizing rather than collapsing.
- Followed by renewed Weak Bullish () or Bullish () readings at higher lows.
This pattern is emblematic of a structural winner within the Stock Trends universe: a stock where downside phases tend to be corrections within an enduring uptrend rather than the start of a secular decline. For Stock Trends users, this translates into a practical message: risk can be managed with the same indicators that guide opportunity. When TJX moves into sustained Bearish categories with falling RSI, it signals a legitimate deterioration in risk/reward. When Bearish phases are brief and momentum stabilizes, the risk often proves transitory.
Macro Backdrop: Why TJX Still Fits the Current Market Environment
The current Stock Trends universe data as of late 2025 shows several important macro and sector-level features:
- Consumer Discretionary strength is again outpacing the S&P 500 in relative strength terms.
- Rising Bullish counts across retail and select cyclical industries signal broadening trend participation.
- High-volume tags in key industry groups suggest institutional accumulation is underway.
- Macroeconomic expectations are tilting toward a soft-landing scenario, with moderating inflation and resilient consumer spending.
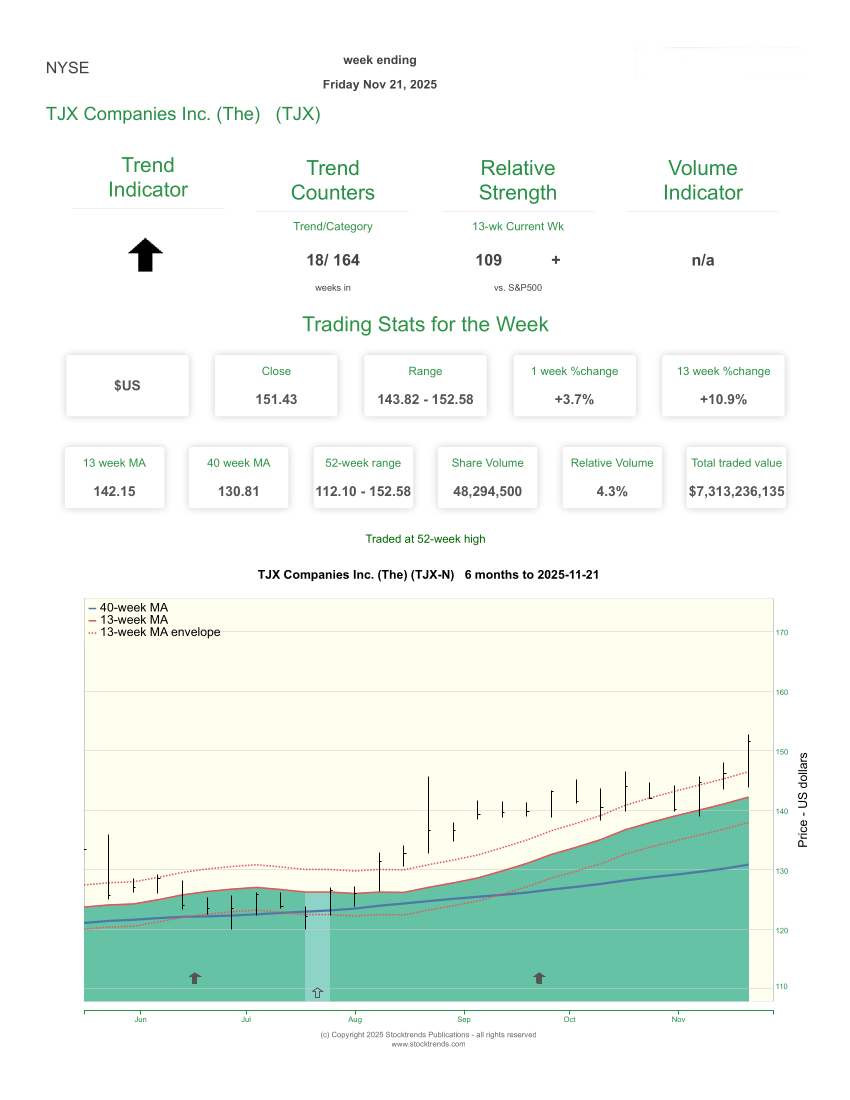
Within this backdrop, TJX’s business model—value-oriented, off-price retailing with a history of thriving across economic cycles—aligns closely with the Stock Trends indicators now visible across the universe. The data currently shows TJX:
- Trading at or near new 52-week highs.
- Maintaining a Bullish () trend classification.
- Displaying favorable trend age (trend_cnt), consistent with an established, durable uptrend.
- Exhibiting supportive RSI and RSI_updn patterns that confirm ongoing relative strength.
This alignment between macro conditions, sector leadership, and stock-specific trend structure creates the “triple confirmation” that Stock Trends methodology seeks: the broader market environment, sector trend distributions, and individual stock indicators all point in the same direction.
Applying the Stock Trends Framework to Trade TJX
For Stock Trends users, TJX serves as a living case study in how to use the indicators to trade a long-run winner with discipline:
- Define Your Structural Bias with Trend and Trend Age
When TJX is in a Bullish () category with a high trend_cnt, the default bias is to be long or accumulating, not predicting tops. The strength indicator confirms that the prevailing uptrend remains intact. - Use RSI Patterns to Fine-Tune Entries and Adds
RSI and RSI_updn provide the timing detail. A rising RSI above 100 with recurring + signals favors holding and pyramiding. Short-term dips in RSI within a persistent or trend highlight windows for adding to positions rather than selling. - Respect Clear Deterioration in Trend
While TJX has historically avoided prolonged Bearish phases, Stock Trends users should still treat a shift into with sustained weak RSI as a warning. The same objective rules that kept investors in the trend for years also define when the evidence no longer supports that stance.
 - Integrate ST-IM Forward-Return Estimates
Within the Stock Trends Inference Model (ST-IM), stocks exhibiting:- Persistent classification,
- High trend_cnt, and
- Strong, rising RSI and RSI +/-
- Persistent
From Data to Discipline: Lessons from TJX for Stock Trends Users
The current behavior of TJX—pressing to new highs while preserving its long-standing Bullish character—underscores a central lesson of the Stock Trends approach: the most powerful returns often come from staying with true trend leaders for as long as their indicators justify it.
Rather than trying to predict tops or trade every short-term fluctuation, Stock Trends users can rely on the integrated guidance of:
- Trend category to define the market’s directional verdict on the stock.
- Trend age (trend_cnt) to measure durability and trend strength.
- RSI and RSI +/- to monitor momentum shifts and relative performance versus the S&P 500.
- Volume tags (vol_tag) to confirm institutional participation and validate breakouts or trend accelerations.
- ST-IM forward-return probabilities to quantify the odds of outperformance over the coming weeks.
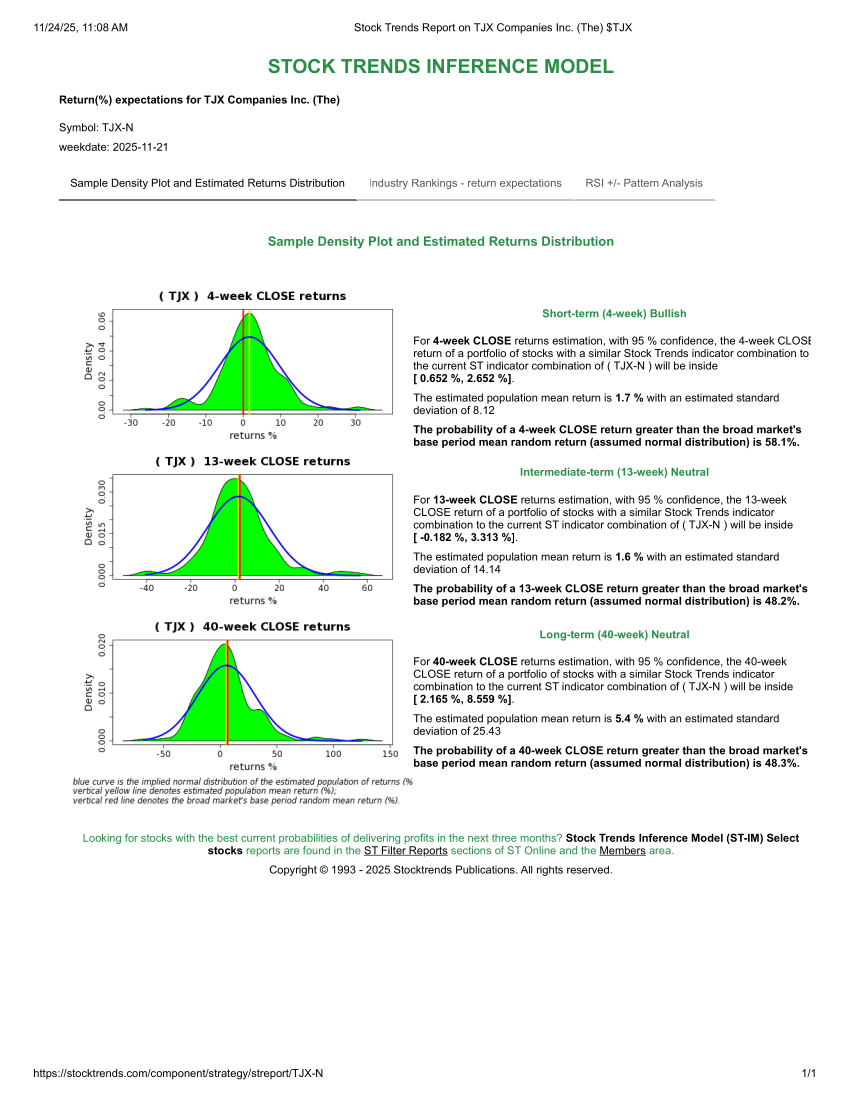
In TJX, these elements have lined up again and again over time, offering multiple cycles of high-probability entry, add, and hold decisions. The current data—showing TJX once more at new highs within a Bullish, high-age trend—suggests that the same pattern of trend persistence and momentum durability is still in force. The Stock Trends Inference Model (ST-IM) confirms that TJX still has room to trend higher before exhaustion hits again. The short-term expectation is Bullish, with a 4-week expected return of 1.7%, and a 58% probability of outperforming the benchmark return for the period (0%). The current Neutral estimations of the 13-week and 40-week periods tell us that, statistically, the intermediate and long-term projections do not significantly indicate toward Bullish or Bearish. If the primary trend length was near its upper limit, these projections would be Bearish. They are not.
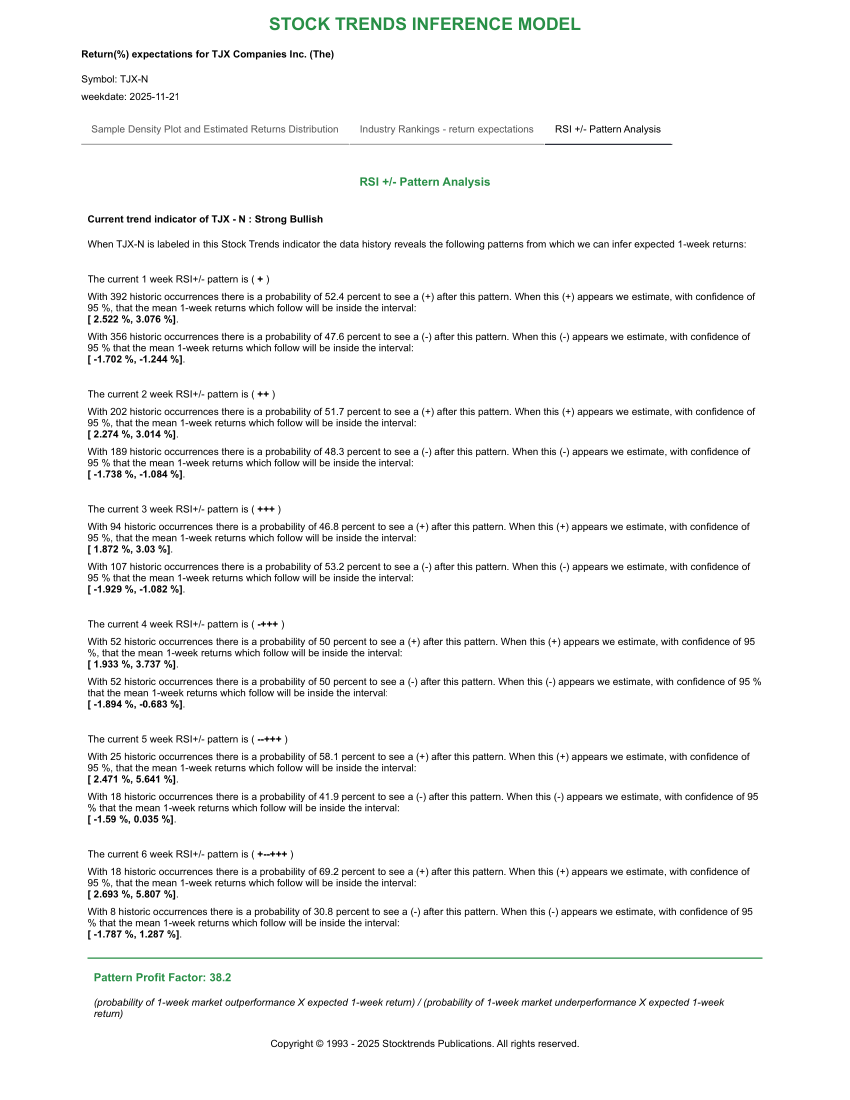
Additionally, the Stock Trends RSI +/- Pattern Model suggests that the current pattern indicates a high probability of profitable 1-week returns, which is an excellent sign that buying this week is supported by the statistical patterns of TJX in a Bullish ![]() trend.
trend.
Conclusion
TJX’s ongoing strength in the November 2025 Stock Trends universe is not an isolated event. It is the latest chapter in a long history of Bullish trend persistence, resilient relative strength, and favorable momentum patterns documented by the Stock Trends indicators. For Stock Trends users, TJX exemplifies how a disciplined, data-driven framework can identify and nurture genuine long-run winners.
By systematically applying the Stock Trends strength indicator, monitoring RSI and RSI +/- for momentum inflection points, and respecting the evidence embedded in the trend categories, investors can position themselves to participate in stocks like TJX—both when they first emerge as Bullish and as they press to new highs years later, still supported by the same underlying forces that defined their original uptrend.
Addendum: TJX Trading History and P&L Summary Under the Stock Trends Framework
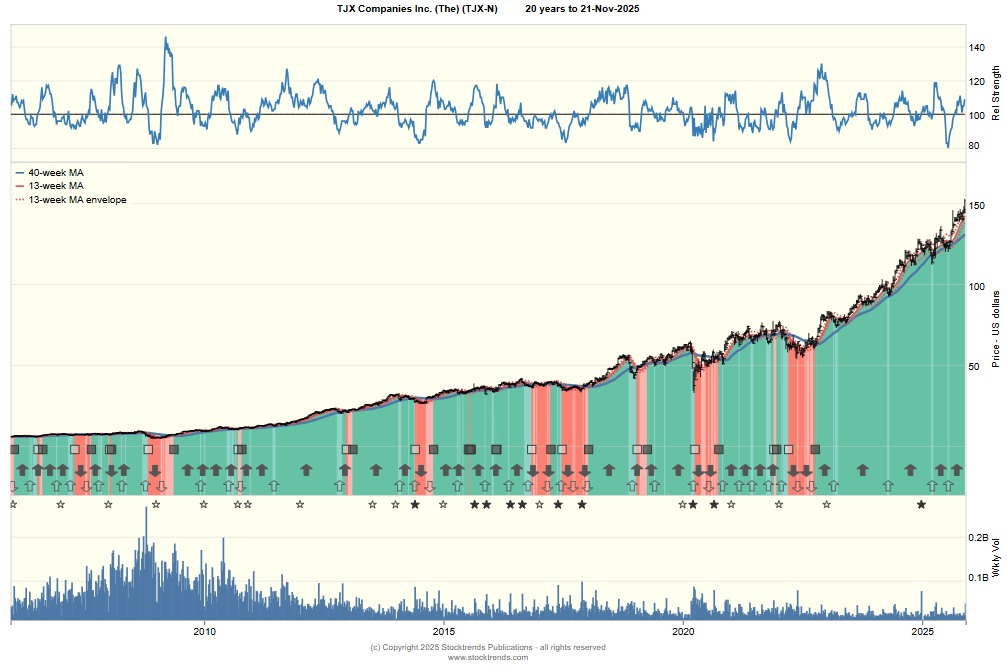
The Stock Trends trend-following test of TJX Companies Inc. (TJX-N) using a simple, rules-based application of the Stock Trends indicators confirms the remarkable power of its long-run Bullish trend. Using weekly Stock Trends data from the early 1980s through November 2025, we applied a mechanical strategy that:
- Buys TJX at the first week it enters a Bullish () trend from any non-Bullish category.
- Sells on the first week it leaves the category (i.e., when the trend is no longer Bullish).
- Uses the weekly
adj_close(split-adjusted) price as the execution price for both entries and exits.
This rule directly reflects the Stock Trends strength framework: investors participate only when TJX is in an established Bullish trend and step aside when the trend deteriorates. Over the full historical record, this simple discipline produced the following results:
| Metric | Result |
|---|---|
| Total number of completed trades | 108 |
| Win rate (trades with positive P&L) | 40.7 % |
| Average return per trade | +5.23 % |
| Total compounded return over the full test period | +5,991.7 % |
These outcomes are consistent with TJX’s current reputation within the Stock Trends universe as one of the longest-running Bullish NYSE stocks. Although fewer than half of the individual trades were winners, the Stock Trends strategy repeatedly captured the long, powerful Bullish (![]() ) phases documented by the trend and trend age (
) phases documented by the trend and trend age (trend_cnt) indicators. It is these extended uptrend sequences—confirmed by resilient RSI and RSI_updn momentum patterns—that drive the extraordinary compounded result.
For Stock Trends users, TJX remains a live, real-world example of the Handbook’s central insight: the most substantial portfolio gains accrue not by predicting every turn, but by systematically aligning with the strongest, longest-lasting trends and exiting only when the indicators confirm genuine deterioration. The full trade history table below offers a transparent record of every entry and exit generated by this Bullish-trend rule over more than four decades of data.
| Buy Date | Buy Price | Sell Date | Sell Price | P&L (%) |
|---|---|---|---|---|
| 1981-02-06 | 0.10 | 1981-02-13 | 0.09 | -10.00 |
| 1981-03-13 | 0.10 | 1981-06-26 | 0.12 | 20.00 |
| 1981-10-09 | 0.13 | 1981-10-23 | 0.13 | 0.00 |
| 1981-11-13 | 0.13 | 1981-11-20 | 0.13 | 0.00 |
| 1981-12-11 | 0.13 | 1981-12-18 | 0.12 | -7.69 |
| 1982-03-26 | 0.13 | 1982-04-02 | 0.13 | 0.00 |
| 1982-04-23 | 0.15 | 1982-05-07 | 0.16 | 6.67 |
| 1982-05-28 | 0.17 | 1983-01-21 | 0.32 | 88.24 |
| 1983-02-04 | 0.34 | 1983-08-05 | 0.44 | 29.41 |
| 1983-10-07 | 0.49 | 1983-10-21 | 0.45 | -8.16 |
| 1983-11-11 | 0.49 | 1983-11-25 | 0.50 | 2.04 |
| 1984-07-20 | 0.42 | 1984-07-27 | 0.44 | 4.76 |
| 1984-08-10 | 0.54 | 1984-11-16 | 0.52 | -3.70 |
| 1984-11-23 | 0.54 | 1985-01-04 | 0.52 | -3.70 |
| 1985-01-11 | 0.56 | 1985-07-26 | 0.78 | 39.29 |
| 1985-08-16 | 0.82 | 1985-08-23 | 0.81 | -1.22 |
| 1985-08-30 | 0.83 | 1985-09-13 | 0.78 | -6.02 |
| 1985-10-04 | 0.81 | 1986-07-18 | 1.15 | 41.98 |
| 1987-05-22 | 0.83 | 1987-06-19 | 0.92 | 10.84 |
| 1987-07-24 | 0.94 | 1987-09-04 | 0.89 | -5.32 |
| 1987-09-11 | 0.91 | 1987-10-16 | 0.77 | -15.38 |
| 1988-05-13 | 0.70 | 1988-05-20 | 0.65 | -7.14 |
| 1988-07-29 | 0.68 | 1988-12-09 | 0.78 | 14.71 |
| 1988-12-30 | 0.80 | 1989-01-13 | 0.77 | -3.75 |
| 1989-01-20 | 0.79 | 1989-01-27 | 0.77 | -2.53 |
| 1989-02-03 | 0.78 | 1989-02-24 | 0.76 | -2.56 |
| 1989-03-03 | 0.81 | 1989-03-24 | 0.77 | -4.94 |
| 1989-03-31 | 0.79 | 1989-06-16 | 0.55 | -30.38 |
| 1991-03-15 | 0.53 | 1991-09-06 | 0.56 | 5.66 |
| 1992-03-13 | 0.58 | 1992-04-10 | 0.54 | -6.90 |
| 1992-04-17 | 0.57 | 1992-04-24 | 0.50 | -12.28 |
| 1992-05-29 | 0.55 | 1992-06-05 | 0.53 | -3.64 |
| 1992-06-12 | 0.55 | 1993-07-02 | 0.95 | 72.73 |
| 1995-10-27 | 0.44 | 1995-11-03 | 0.43 | -2.27 |
| 1995-11-17 | 0.53 | 1996-07-12 | 0.96 | 81.13 |
| 1996-08-09 | 1.04 | 1997-01-24 | 1.29 | 24.04 |
| 1997-03-07 | 1.38 | 1997-12-26 | 1.89 | 36.96 |
| 1998-01-02 | 2.07 | 1998-07-31 | 2.94 | 42.03 |
| 1998-08-21 | 3.32 | 1998-08-28 | 3.04 | -8.43 |
| 1999-01-08 | 3.56 | 1999-05-14 | 3.69 | 3.65 |
| 1999-06-25 | 4.13 | 1999-08-13 | 3.81 | -7.75 |
| 2000-10-06 | 3.09 | 2000-12-15 | 3.03 | -1.94 |
| 2000-12-22 | 3.20 | 2001-04-13 | 3.57 | 11.56 |
| 2001-04-20 | 3.75 | 2001-07-06 | 3.85 | 2.67 |
| 2001-07-13 | 4.19 | 2001-09-07 | 4.06 | -3.10 |
| 2001-09-28 | 4.11 | 2002-02-08 | 4.59 | 11.68 |
| 2002-03-01 | 4.76 | 2002-06-14 | 5.00 | 5.04 |
| 2003-01-10 | 5.06 | 2003-01-24 | 4.77 | -5.73 |
| 2003-08-08 | 4.98 | 2003-09-26 | 4.74 | -4.82 |
| 2003-10-03 | 5.02 | 2004-05-07 | 5.88 | 17.13 |
| 2004-05-14 | 5.96 | 2004-07-02 | 6.01 | 0.84 |
| 2004-07-30 | 5.87 | 2004-08-06 | 5.31 | -9.54 |
| 2004-12-24 | 6.22 | 2005-04-15 | 5.82 | -6.43 |
| 2006-01-20 | 6.05 | 2006-05-12 | 5.86 | -3.14 |
| 2006-05-19 | 5.98 | 2006-05-26 | 5.89 | -1.51 |
| 2006-06-02 | 5.93 | 2006-06-09 | 5.75 | -3.04 |
| 2006-07-07 | 5.92 | 2006-07-14 | 5.85 | -1.18 |
| 2006-08-25 | 6.55 | 2006-12-01 | 6.74 | 2.90 |
| 2006-12-08 | 7.00 | 2007-03-02 | 6.83 | -2.43 |
| 2007-04-06 | 6.97 | 2007-04-20 | 7.26 | 4.16 |
| 2007-08-31 | 7.62 | 2007-10-19 | 7.09 | -6.96 |
| 2007-10-26 | 7.18 | 2007-11-02 | 6.94 | -3.34 |
| 2007-11-16 | 7.34 | 2008-01-04 | 6.82 | -7.08 |
| 2008-02-01 | 8.03 | 2008-04-11 | 7.52 | -6.35 |
| 2008-04-18 | 8.01 | 2008-05-09 | 7.76 | -3.12 |
| 2008-05-16 | 7.96 | 2008-09-19 | 8.14 | 2.26 |
| 2009-05-22 | 7.07 | 2009-12-04 | 9.11 | 28.85 |
| 2009-12-11 | 9.35 | 2010-01-01 | 9.14 | -2.25 |
| 2010-01-08 | 9.64 | 2010-06-25 | 10.79 | 11.93 |
| 2010-07-23 | 10.72 | 2010-07-30 | 10.38 | -3.17 |
| 2010-08-20 | 10.45 | 2010-08-27 | 10.28 | -1.63 |
| 2010-09-03 | 10.47 | 2010-09-17 | 10.70 | 2.20 |
| 2010-10-22 | 11.22 | 2010-12-17 | 10.86 | -3.21 |
| 2010-12-24 | 11.12 | 2011-06-10 | 12.37 | 11.24 |
| 2011-07-01 | 13.29 | 2012-10-12 | 21.42 | 61.17 |
| 2012-11-23 | 21.96 | 2012-12-21 | 20.98 | -4.46 |
| 2013-02-15 | 22.51 | 2014-01-24 | 28.88 | 28.30 |
| 2014-02-14 | 29.90 | 2014-04-11 | 28.92 | -3.28 |
| 2014-04-18 | 29.35 | 2014-05-23 | 27.58 | -6.03 |
| 2014-10-24 | 31.04 | 2015-04-17 | 32.63 | 5.12 |
| 2015-04-24 | 33.15 | 2015-05-01 | 32.78 | -1.12 |
| 2015-05-08 | 33.66 | 2015-05-29 | 32.19 | -4.37 |
| 2015-06-05 | 32.82 | 2015-07-10 | 34.07 | 3.81 |
| 2015-08-07 | 34.82 | 2015-11-13 | 32.11 | -7.78 |
| 2015-11-20 | 35.08 | 2016-01-08 | 33.47 | -4.59 |
| 2016-01-22 | 34.48 | 2016-02-05 | 33.98 | -1.45 |
| 2016-02-19 | 35.80 | 2016-05-13 | 36.34 | 1.51 |
| 2016-05-20 | 37.72 | 2016-09-09 | 37.38 | -0.90 |
| 2017-04-07 | 38.05 | 2017-05-19 | 37.14 | -2.39 |
| 2017-05-26 | 37.77 | 2017-06-09 | 36.84 | -2.46 |
| 2018-01-19 | 39.45 | 2018-11-16 | 51.49 | 30.52 |
| 2019-01-11 | 47.46 | 2019-01-18 | 49.16 | 3.58 |
| 2019-04-12 | 53.97 | 2019-05-31 | 50.29 | -6.82 |
| 2019-06-07 | 51.92 | 2019-08-16 | 51.39 | -1.02 |
| 2019-08-23 | 53.09 | 2020-03-06 | 58.56 | 10.30 |
| 2020-10-09 | 58.19 | 2020-10-30 | 50.80 | -12.70 |
| 2020-11-06 | 53.94 | 2021-03-05 | 62.72 | 16.28 |
| 2021-03-12 | 66.84 | 2021-06-04 | 65.64 | -1.80 |
| 2021-06-25 | 67.53 | 2021-10-01 | 66.61 | -1.36 |
| 2021-11-05 | 71.20 | 2021-11-26 | 69.36 | -2.58 |
| 2021-12-24 | 73.75 | 2022-01-21 | 67.46 | -8.53 |
| 2022-01-28 | 71.38 | 2022-02-04 | 69.18 | -3.08 |
| 2022-10-14 | 63.55 | 2023-02-24 | 77.19 | 21.46 |
| 2023-03-03 | 77.91 | 2023-03-10 | 74.30 | -4.63 |
| 2023-03-31 | 78.36 | 2024-04-12 | 94.42 | 20.50 |
| 2024-04-26 | 96.36 | 2025-03-14 | 113.26 | 17.54 |
| 2025-03-28 | 118.21 | 2025-07-18 | 122.17 | 3.35 |
| 2025-07-25 | 126.44 | 2025-11-21 | 151.43 | 19.76 |
Related items
- Stock Trends Year-End Analysis: Institutional Momentum, ST-IM Alpha, and the Road Into Q1 2026
- The Quiet Power of Hospital Consumables: Durable Trends Hidden in Plain Sight
- Understanding Our Assumptions — A Decade Later
- Navigating Market Turmoil in December 2025 – How Stock Trends Guides Investors
- Positioning for Opportunity: Trade Detente and Stock Trends Momentum
 I very much like the systematic approach to analyzing stock data, it fits my approach.


