
Amidst a market still digesting the Federal Reserve’s first rate cut in nine months, one theme stands out in the latest Stock Trends dataset: the remarkable resilience of retail leaders. While thousands of common stocks across NYSE, Nasdaq, and TSX are posting Strong Bullish signals, three consumer-facing companies — TJX Companies, O’Reilly Automotive, and Dollarama — hold the longest uninterrupted Bullish runs on their exchanges. These records are more than just streaks; they are evidence of durable business models that thrive through economic cycles, proving that retail remains a pillar of strength even in a shifting macro environment.
The Stock Trends trend distribution for the week ending September 19, 2025 shows widespread Bullish breadth across all major exchanges:
| Exchange | Strong Bullish ( |
|---|---|
| NYSE (N) | 1,565 (60%) |
| Nasdaq (Q) | 1,401 (43%) |
| TSX (T) | 738 (67%) |
The current average length of Bullish trend categories on the NYSE is 21 weeks, the Nasdaq 19 weeks, and the TSX 29 weeks. This breadth provides the backdrop for why the longest-running Bullish stocks in retail — TJX Companies (TJX-N), O’Reilly Automotive (ORLY-Q), and Dollarama (DOL-T)— are especially noteworthy. They are not only aligned with the broad trend but have sustained it for years, making them market leaders. But the Stock Trends statistical research on trend length shows that these stocks are on the frontier of bullish trend limits and should be viewed with caution. Stock Trends Weekly Reporter subscribers can review the Longest-Running Bullish Stocks report (Oldest Bullish Stocks), as well as the Long-Running Bearish Stocks report (Oldest Bearish Stocks), for a more comprehensive filter report, but the top ones are also listed on the Trend Summary page for each exchange. Here, we will examine the top Oldest Bullish stocks.
Longevity in Bullish Trends
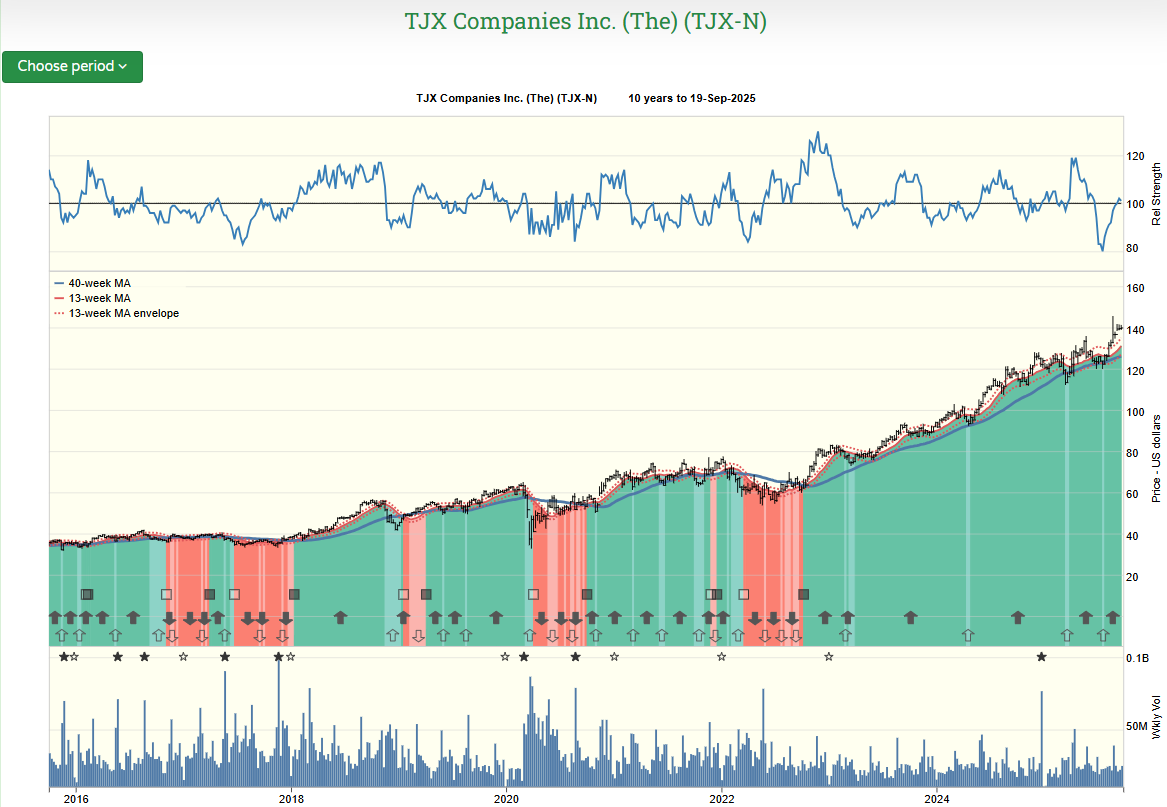
- TJX Companies (TJX-N) — NYSE, now in a 155-week Strong Bullish run.1
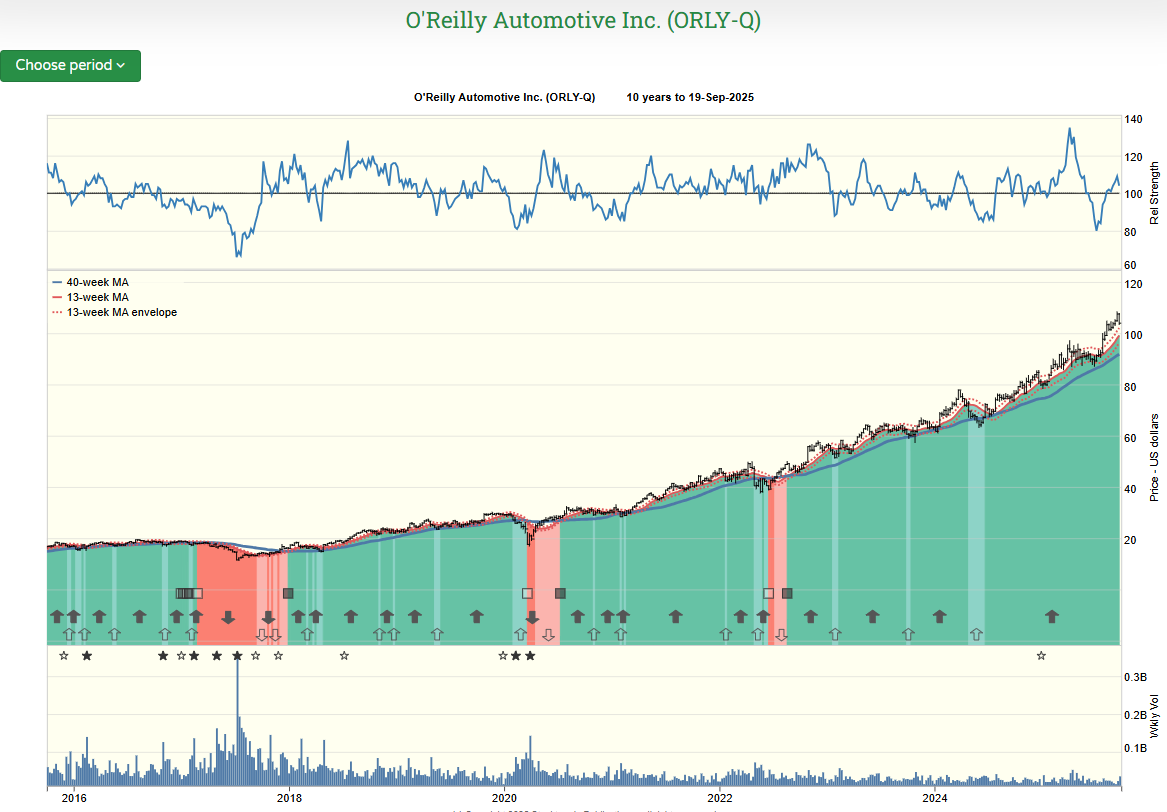
- O’Reilly Automotive (ORLY-Q) — Nasdaq’s longest-running Bullish trend at 162 weeks.2
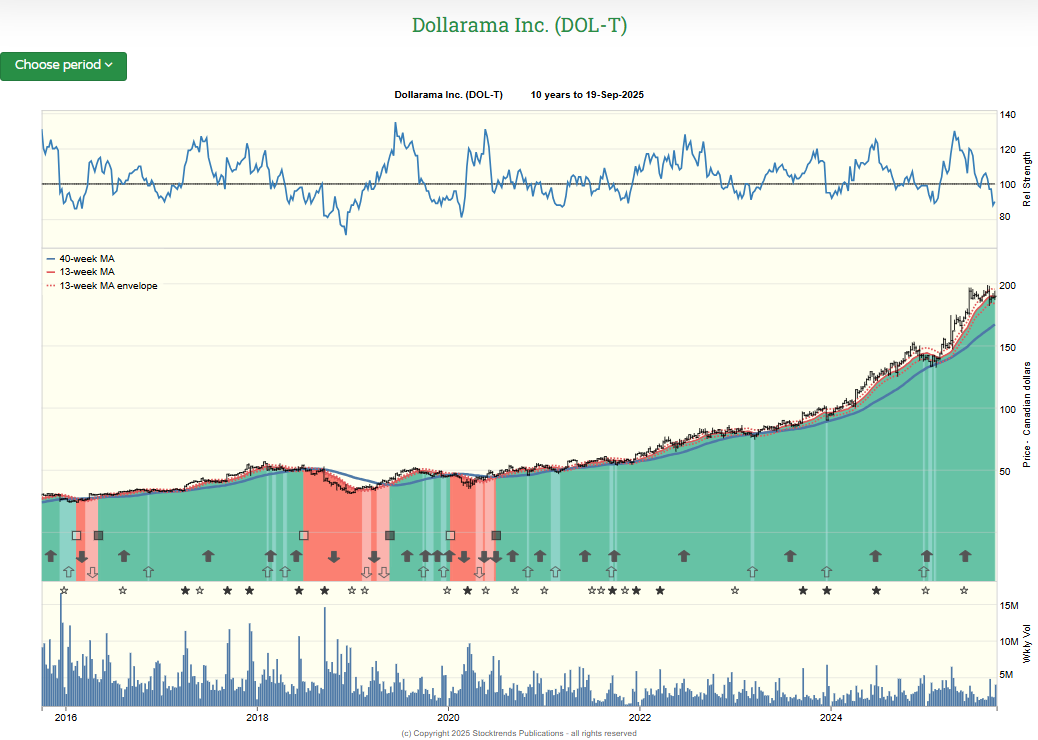
- Dollarama (DOL-T) — TSX leader with an extraordinary 273-week Bullish run.3
Stock Trends Signals Explained
All three stocks carry the Strong Bullish (![]() ) classification. This means their secondary trend (intermediate-term moving averages) remains firmly above their primary trend (intermediate-term averages), and price action has confirmed this strength over years, not weeks. Supporting signals include:
) classification. This means their secondary trend (intermediate-term moving averages) remains firmly above their primary trend (intermediate-term averages), and price action has confirmed this strength over years, not weeks. Supporting signals include:
- RSI: These stocks maintain elevated relative strength compared with benchmarks, although DOL is underperforming the resource-rich TSX benchmark.
- Volume: consistent and steady trading volume.
Macro and Sector Context
The Fed’s September 17 rate cut adds fresh support to the retail backdrop. Lower borrowing costs ease consumer credit conditions, while inflationary pressure sustains value-seeking behavior. Discount leaders like TJX and Dollarama thrive in such conditions, while specialty retailers such as O’Reilly Automotive benefit from secular tailwinds like aging car fleets and deferred new-car purchases.
Company Spotlights
TJX Companies (TJX-N)
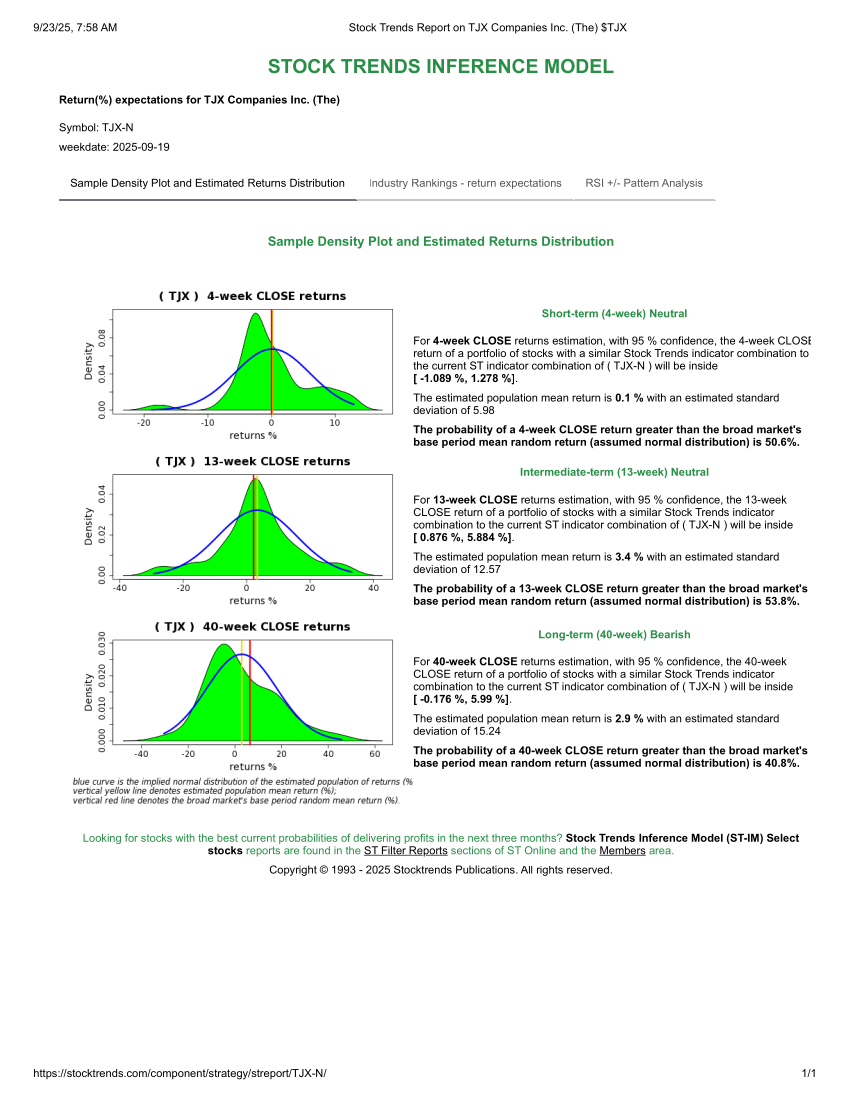
With banners including T.J. Maxx, Marshalls, and Winners, TJX has shown remarkable resilience by offering consumers affordable, branded goods. Its 155-week Strong Bullish trend underscores consistent earnings, dividend growth, and defensive appeal during inflation. However, our Stock Trends statistical analysis of trends (Stock Trends Inference Model) often reveals that trend length does have a statistical limit, where the probability of maintaining a trend becomes increasingly unlikely. For TJX, the 40-week horizon looks weak, with a higher probability of underperformance. The short-term (4-week) and intermediate-term (13-week) horizons are more positive, with a slight probability of over-performance up to the 13-week horizon. The current environment will continue to push TJX higher over the next quarter.
| Symbol | Company | Sector | Trend Age | RSI | Probability of outperformance - 13wk | 13wk return estimate | 40wk return estimate |
|---|---|---|---|---|---|---|---|
| TJX-N | TJX Companies | Retail | 155 wks | 101 | 54% | +3.4% | +2.9% |
O’Reilly Automotive (ORLY-Q)
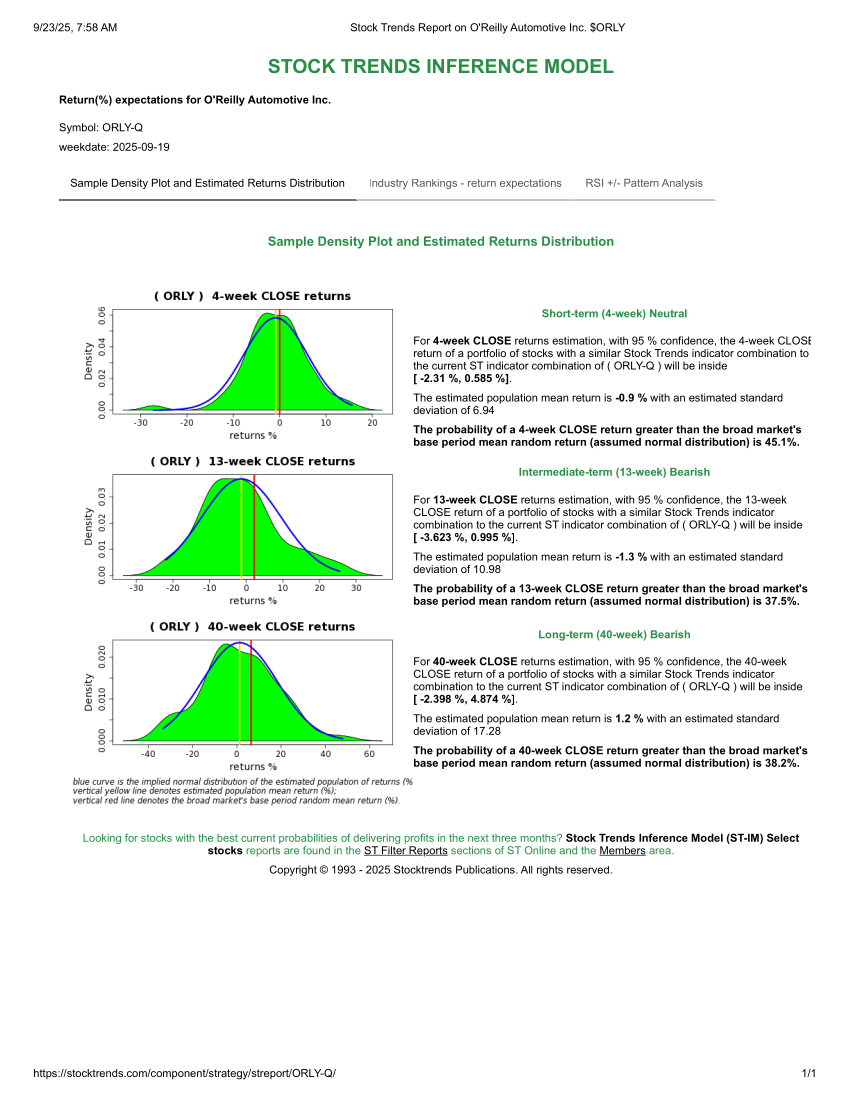
ORLY has capitalized on steady demand for auto parts as consumers hold onto aging vehicles. Its Strong Bullish classification reflects both cyclical demand and long-term structural trends in vehicle maintenance. However, the ST-IM estimates going forward look dim in this statistical framework. The intermediate and long-term estimates show a high probability of underperformance. Caution is advised.
| Symbol | Company | Sector | Trend Age | RSI | Probability of outperformance - 13wk | 13wk return estimate | 40wk return estimate |
|---|---|---|---|---|---|---|---|
| ORLY-Q | O’Reilly Automotive | Retail – Auto Parts | 162 wks | 104 | 37% | -1.3% | +1.2% |
Dollarama (DOL-T)
Dollarama’s expanding Canadian footprint makes it a standout in discount retail. Its ability to thrive in both inflationary and recessionary environments has cemented its long Bullish trend, one that is so long-standing as a Bullish stock that there are not enough other records of similar stocks to create an ST-IM profile.
| Symbol | Company | Sector | Trend Age | RSI | Probability of outperformance - 13wk | 13wk return estimate | 40wk return estimate |
|---|---|---|---|---|---|---|---|
| DOL-T | Dollarama | Retail – Discount | 273 wks | 90 | na | na | na |
Investor Takeaways
The lesson for Stock Trends subscribers is clear: trend longevity matters. These three retailers demonstrate that sector leadership is not only alive, but durable. With rate cuts reshaping consumer credit dynamics, discount and specialty retail leaders are especially well positioned. By focusing on the intersection of ![]() trend indicators, rising RSI, and ST-IM Select probabilities, investors can identify retail stocks poised to sustain performance even in shifting macro conditions, but also be informed that trend durability will reach exhaustion at some point. In the current context, it is prudent to continue to ride the trends until a Weak Bullish (
trend indicators, rising RSI, and ST-IM Select probabilities, investors can identify retail stocks poised to sustain performance even in shifting macro conditions, but also be informed that trend durability will reach exhaustion at some point. In the current context, it is prudent to continue to ride the trends until a Weak Bullish (![]() ) indicator is triggered. That would be a signal of long-term trend exhaustion for these long-term bullish stocks.
) indicator is triggered. That would be a signal of long-term trend exhaustion for these long-term bullish stocks.
1 NYSE summary page: Stock Trends Summary – NYSE
2 Nasdaq summary page: Stock Trends Summary – Nasdaq
3 TSX summary page: Stock Trends Summary – TSX
 I am fascinated with your service and methodology - it is very impressive. [...] Over the years I have concluded that there are many ways to approach stock investing, but once one has chosen a path, one is better off sticking to it.


