
Sharp market selloffs are stressful… and useful. They create a live-fire laboratory where leadership quality is revealed in real time. In the Stock Trends framework, the most informative sequence is a stock that registers a New Weak Bullish (![]() ) during the shock — a pullback statement in a bullish primary trend — and then, within a week, flips back to a Return to Strong Bullish (
) during the shock — a pullback statement in a bullish primary trend — and then, within a week, flips back to a Return to Strong Bullish (![]() ). That transition is a powerful confirmation that buyers remain in control.
). That transition is a powerful confirmation that buyers remain in control.
Why this flip matters
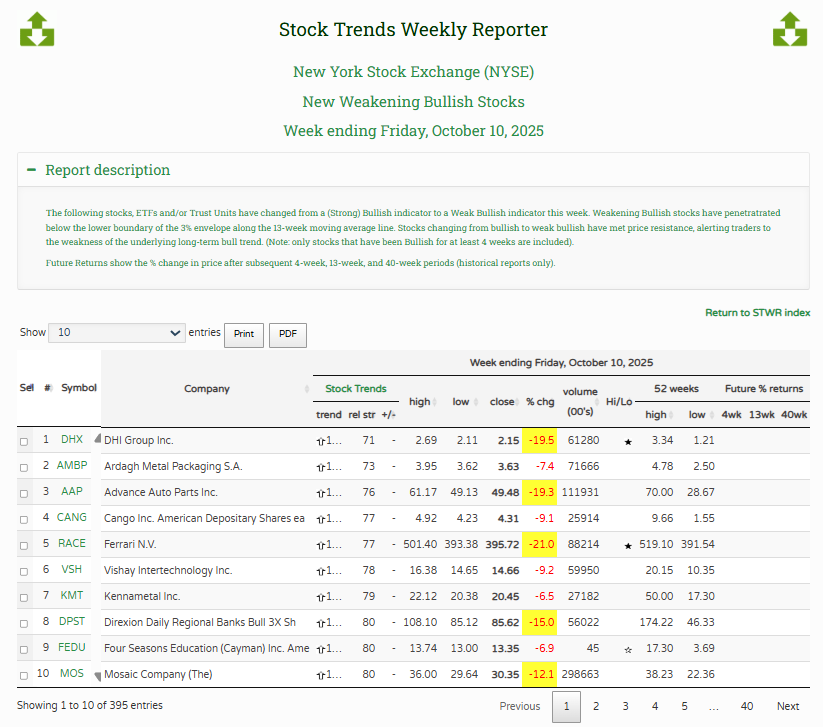
The Weak Bullish (![]() ) classification signals a corrective phase inside a dominant bull trend. It is not a reversal, although it can signal a coming reversal. When the market sells off broadly, many leaders fall into Weak Bullish together. There were 543 newly Weak Bullish North American stocks reported in the October 10 Stock Trends reports. The key tell is what happens next: names that quickly reclaim Strong Bullish (
) classification signals a corrective phase inside a dominant bull trend. It is not a reversal, although it can signal a coming reversal. When the market sells off broadly, many leaders fall into Weak Bullish together. There were 543 newly Weak Bullish North American stocks reported in the October 10 Stock Trends reports. The key tell is what happens next: names that quickly reclaim Strong Bullish (![]() ) demonstrate resiliance and durability — they absorbed supply, held structure, and attracted capital back faster than peers. In practice, that flip often foreshadows renewed outperformance into the next leg up. The market sell-off for the week ended October 10 provides a watchlist of stocks that we can monitor for resilience in the following week's data, week ended October 17.
) demonstrate resiliance and durability — they absorbed supply, held structure, and attracted capital back faster than peers. In practice, that flip often foreshadows renewed outperformance into the next leg up. The market sell-off for the week ended October 10 provides a watchlist of stocks that we can monitor for resilience in the following week's data, week ended October 17.
The decision tree
- Start with the signal: Last week’s New Weak Bullish (trend_cnt = 1) list is your watchlist. Populate a watchlist from the Stock Trends Weekly Reporter filter report - Newly Weak Bullish Stocks
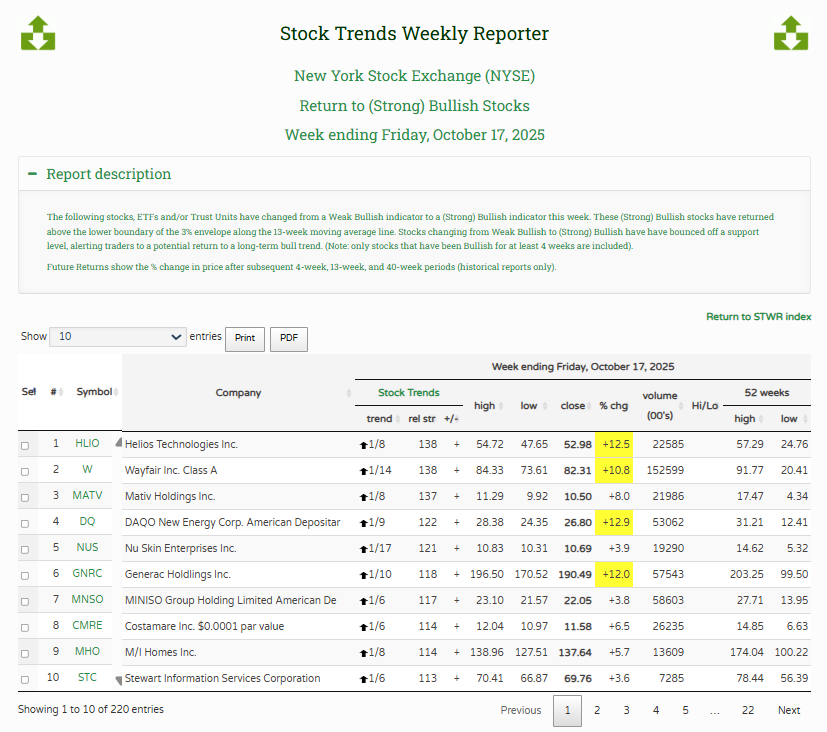
- Confirm the recovery: Cross-check against this week’s Return to Strong Bullish report to isolate rapid rebounders. The Return to Strong Bullish filter report helps us isolate these stocks. If you've created a watchlist, you can easily monitor which stocks have rebounded to Bullish (
 ) in the following week's updates.
 - Quantify the forward view: Use ST-IM’s 13-week estimate (
x13wk). Favor higherx13wk(i.e., better reward-to-risk). - Prioritize Select candidates: Check for 13-week forward outperformance probabilities in the Trend Profile section of the Stock Trends Report page for each stock highlighted, and if it’s a Select ST-IM signal — a statistically stronger outperformance probability 13 weeks ahead.
- Execution cues: Look for weekly RSI to stay positive, volume tags (
 ) signaling strong buy pressure, and a reclaim of the pullback pivot.
Sector concentration: where rebounds cluster
In most extreme pullbacks, we see the bulk of quick flips in sectors that led the prior upleg — commonly Technology and Communications — along with crypto-linked equities and ETFs when digital assets are in play. In this selection filter, Consumer stocks are most prevalent. A second wave often appears in Financials and Industrials as rate and macro jitters fade. Recognizing these clusters helps you bias your list toward groups with supportive flows rather than isolated one-offs.
Ranking the rebounders
We rank the returning leaders by ST-IM forward return expectations and outperformance probability. Here we have created a watchlist of stocks from the Newly Weak Bullish stocks reports of October 10 and filtered for the following properties in the following week's (October 17) Stock Trends reports.
Top 20 — Weak Bullish → Return to Strong Bullish
The table below highlights the most compelling flips of the following filter: stocks that were New Weak Bullish for the week of record (October 10), and have now (October 17 reports) turned Return to Strong Bullish. All stocks currently have an RSI value above 100, meaning they are still outpacing the S&P 500 index benchmark over the past quarter, and they also outperformed the index last week. The order of the table is in descending order of the ST-IM 4-week forward return estimate. Each row links to its Stock Trends Report for full context.
| Company | Symbol | Trend | Trend Wk | Major Trend Wk | RSI | 13wk Return Est (%) | Sector |
|---|---|---|---|---|---|---|---|
| Toyota Motor Corporation | TM | 1 | 7 | 111 | 3.7 | Consumer Discretionary | |
| Mitsubishi UFJ Financial Group Inc. | MUFG | 1 | 146 | 107 | 3.3 | Finance | |
| Helios Technologies Inc. | HLIO | 1 | 8 | 138 | 1.1 | Industrials | |
| Brunswick Corporation | BC | 1 | 7 | 101 | 3.1 | Consumer Discretionary | |
| Dana Incorporated | DAN | 1 | 37 | 109 | 3.7 | Consumer Discretionary | |
| IHS Holding Limited | IHS | 1 | 37 | 107 | 3.0 | Media | |
| Buckle Inc. (The) | BKE | 1 | 13 | 107 | 2.4 | Consumer Discretionary | |
| Ardmore Shipping Corporation | ASC | 1 | 7 | 109 | 1.5 | Industrials | |
| Sociedad Quimica y Minera S.A. | SQM | 1 | 8 | 107 | 3.2 | Materials | |
| Mohawk Industries Inc. | MHK | 1 | 7 | 108 | 1.6 | Consumer Discretionary | |
| Ryder System Inc. | R | 1 | 13 | 101 | 3.7 | Industrials | |
| Vontier Corporation | VNT | 1 | 13 | 104 | 2.2 | Technology | |
| Harrow Inc Com | HROW | 1 | 10 | 105 | 3.9 | Healthcare | |
| Mativ Holdings Inc. | MATV | 1 | 8 | 137 | 0.0 | Materials | |
| Boot Barn Holdings Inc. | BOOT | 1 | 15 | 102 | 4.3 | Consumer Discretionary | |
| Genuine Parts Company | GPC | 1 | 15 | 102 | 4.3 | Consumer Discretionary | |
| CBRE Group Inc Class A | CBRE | 1 | 13 | 106 | 1.7 | Real Estate | |
| Nu Skin Enterprises Inc. | NUS | 1 | 17 | 121 | 8.1 | Consumer Staples | |
| Nomura Holdings Inc ADR American Deposit | NMR | 1 | 15 | 105 | 3.1 | Finance | |
| Expeditors International of Washington I | EXPD | 1 | 11 | 101 | 2.8 | Industrials |
Bottom line
Extreme market pullbacks don’t just test portfolios — they reveal leadership. Stocks that move from New Weak Bullish to Return to Strong Bullish inside a week have demonstrated the two things we value most: trend integrity and market demand. Combine that flip with ST-IM’s forward expectations and Select probability support, and you’ve got a disciplined way to see opportunity when markets wobble — not after they’ve already recovered.
Related items
- Stock Trends Mid-Quarter Review: How the Year-End 2025 Themes Are Performing in Q1 2026
- Stock Trends Year-End Analysis: Institutional Momentum, ST-IM Alpha, and the Road Into Q1 2026
- Understanding Our Assumptions — A Decade Later
- Trading Nvidia with the Stock Trends RSI +/– Pattern Analysis Model
- Navigating Market Turmoil in December 2025 – How Stock Trends Guides Investors
 I am something of a momentum investor. I find Stock Trends useful as I can look at my portfolio as a “watch list” and quickly see where trends are declining in strength or reversing, so it is particularly useful as a tool in portfolio management regarding sales.


