Investors often compare performance to market indexes like the S&P 500, but traditional benchmarks have built-in biases. The S&P 500, for example, is heavily skewed toward large-cap stocks and “is not a good benchmark for measuring alpha” – it reflects a size-factor bias rather than pure manager skill. All major indexes systematically tilt toward certain factors (size, sector, value/growth, etc.), meaning they’re not truly passive representations of “the market.” In contrast, a benchmark based on randomly constructed portfolios avoids those biases. Random portfolios – essentially naïve baskets of stocks selected with no particular weighting scheme – provide a neutral point of reference for performance. In fact, Stock Trends has long advocated that “the only truly passive approach to the markets is one that employs random portfolio construction”, since it doesn’t favor any subset of stocks by design.
Why Use Random Portfolios?
My first introduction to this topic was through quant Patrick Burns, who noted back in 2004 that measuring investment skill against random portfolio benchmarks can “avoid some of the noise” introduced by comparing against a single index. Similarly, performance analyst Ron Surz argued that Monte Carlo simulations using random portfolios offer a more meaningful performance test than flawed static indexes or peer groups. The idea is that by stripping away systematic biases, a random portfolio benchmark provides a clearer view of true alpha – the excess return attributable to skill or strategy, rather than simply riding a biased index.
Monkeys vs. the Market: What Random Portfolios Reveal
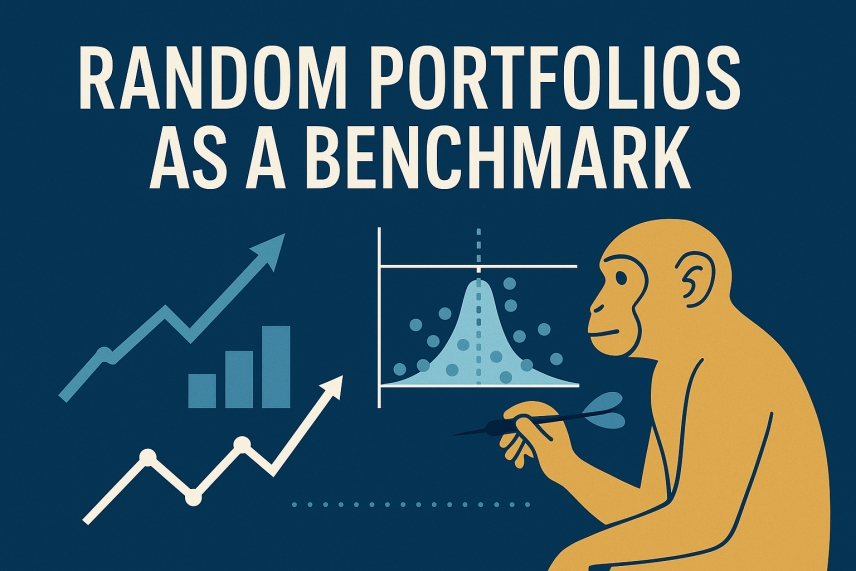
The concept of random portfolio benchmarking is often illustrated with a whimsical image: a monkey throwing darts at stock listings. In practice, a “monkey portfolio” represents a completely random selection of stocks – the kind of portfolio an untrained dart-throwing monkey might build. The performance of such random portfolios tells us what the market delivers “without any specific intelligence” or stock-picking skill. In other words, random portfolio returns represent the baseline returns inherent in the broad market, reflecting pure chance rather than strategy. If your investment strategy can’t beat this baseline, it may not be adding any real value.
Empirical studies have compared random portfolios to the major indexes, and the findings are eye-opening. Our analysis looked at annual 52-week returns from 2003 through 2017 for the S&P 500 versus thousands of random-stock portfolios. The result: the S&P 500 outperformed the average random portfolio in only 7 of those 15 years. Over the entire period, the “naïve” 100-stock portfolios (averaged across 1,000 trials each year) actually beat the index by a cumulative 26%. In plain terms, a broad random mix of stocks often did as well as or better than the carefully constructed S&P – confirming the old saying that a blindfolded monkey picking stocks could rival professional stock selectors. Much of the random portfolios’ edge in that period came from years like 2003 and 2009, when the market rebounded from crashes and smaller-cap stocks far outpaced the mega-caps in the index. The S&P 500’s size bias caused it to miss out on some of those explosive small-cap gains, whereas a truly random basket captured more of them.
To be sure, the pendulum can swing. In recent years, during the late 2010s and early 2020s, the S&P’s tilt toward giant technology firms gave it an advantage over equally-weighted or random portfolios. When mega-cap tech stocks were soaring, a cap-weighted index like the S&P 500 delivered higher returns than the average stock. This highlights an important point: if a particular factor or sector is dominating market gains, an index that emphasizes that factor will outperform a neutral baseline. But the broader lesson remains – an unbiased benchmark lets you see when an index’s outperformance is simply due to its built-in tilt. Random portfolios help investors understand whether an active strategy is truly outperforming the market at large, or just a narrow benchmark that might be riding a specific trend.
In fact, Stock Trends turned this idea into an educational game: the Stock Trends “Slots” challenge generates random portfolios of stocks to see how they perform over a few weeks. It’s a fun illustration that a portfolio picked by chance can sometimes hold its own against the market – reinforcing that a lot of market movement is essentially random. Current plans for the game are to tokenize it and add elements of skill that would engage users and further gamify the application, incorporating the also under-development Stock Trends machine learning Causal AI discovery model. Stay tuned!
A Fair Test of Skill: Random Portfolio Benchmarking in Action
Random portfolio benchmarks truly shine when evaluating investment skill or strategy performance. The technique, pioneered by Surz and others, is conceptually simple: compare your fund or strategy to a large sample of randomized portfolios drawn from the same investment universe. This approach asks, “How would I have done just by luck, given the same pool of opportunities?” and lets you see where your actual performance falls on the spectrum of random outcomes.
Researchers often implement this in a two-step process:
-
Define the Opportunity Set: Identify the universe of assets and any constraints that the manager or strategy operates under. For example, if a mutual fund invests in S&P 500 stocks with certain sector weight limits, that defines the pool and rules. If a hedge fund runs a long/short strategy with leverage and turnover constraints, those are noted. The idea is to capture the “fund manager’s true opportunity set” – all the portfolios they could have held following their mandate.
-
Simulate Random Portfolios: Using that universe and constraints, generate thousands of portfolios randomly. These simulated portfolios obey the same basic rules (e.g. 60% max in stocks, or no single stock over 5%, rebalancing monthly, etc.) but with holdings chosen at random, not based on any skill or forecasting. Because these portfolios have no deliberate strategy, they represent what an unskilled manager’s performance might look like. (Modern computing makes it easy to create and evaluate so many random scenarios.)
-
Compare Performance Distributions: Finally, compare the actual fund/strategy’s performance to the distribution of returns from the random portfolios. If your fund is truly adding value, its result should stand out significantly above the random pack. If it’s middling or worse, it might not be doing better than chance. Statistically, the fund’s percentile ranking among the random outcomes provides a direct measure of performance significance. For example, if your strategy ranks in the 90th percentile (top 10%) compared to random portfolios, that suggests skill (roughly a p-value of 0.10 in statistical terms). If it’s in the 50th percentile, it’s literally average – no better than a coin flip selection.
In practical terms, the above figure illustrates how tough the benchmark can be. The vast majority of random portfolios clustered around a certain average return, with only a small tail (5%) achieving exceptionally high returns. If a fund manager in that period got, say, a 50% total return, it might look good in isolation – but if 50% lies around the median of the random distribution, we’d conclude it’s not statistically distinguishable from random luck. On the other hand, an 80% return was near the top 5% of random outcomes; exceeding that would be strong evidence the manager had real skill or insight beyond what a random stock picker could expect. This method turns performance evaluation into a rigorous statistical test: if your performance falls in the extreme tail of the random distribution, you likely added skill; if not, any outperformance may have been just luck or market beta.
Another way to think of this is in terms of batting average: Instead of comparing a fund manager to a single index “opponent,” we compare them to an entire league of thousands of hypothetical players (random portfolios). If they consistently score in the top ranks of that league, they’re an all-star; if not, they might be no better than the average player. This approach deals with a key limitation of traditional benchmarks – it acknowledges the many alternate paths the market could take. By embedding the fund in a broad distribution of possibilities, it provides a more robust context for judging performance.
Beyond the Index: Use Cases for Random Portfolio Benchmarks
The random portfolio approach isn’t just an academic exercise – it has practical applications across fund management, strategy research, and risk analysis:
-
Mutual Fund and Hedge Fund Evaluation: Random benchmarks offer a custom yardstick for any fund. This is especially useful for funds with unique styles or niche mandates where a generic index is inadequate. Hedge funds are a great example: their strategies can be so specialized (long/short, global macro, etc.) that it’s “notoriously difficult” to find proper benchmarks or peer comparisons. Random portfolios solve this by reflecting each fund’s unique constraints and universe, effectively creating a tailor-made benchmark for that specific strategy. A long/short equity hedge fund, for instance, can be benchmarked against random long/short portfolios using the same leverage and sector limits. If the fund’s returns fall in the top decile of those random outcomes, investors can be more confident that the manager added value beyond simply riding the market.
-
Strategy and Signal Testing: Random portfolios are a powerful tool for vetting new trading strategies or quantitative signals. A clever approach described by researcher Peter Dawson is to compare two sets of random portfolios – one that incorporates the strategy’s stock selection rules and one that does the opposite (excludes those picks). By evaluating the distributions of outcomes with and without the strategy’s “secret sauce,” one can gauge the impact of the strategy. For example, consider a trend-following model that selects certain assets. We generate one group of random portfolios that always include those favored assets (in random weights), and another group that deliberately avoids them, investing in everything except what the model likes. If the portfolios following the model’s picks markedly outperform the ones excluding them, we have strong statistical evidence that the model’s signals add real alpha. In one practical case, researchers “inverted” a popular tactical asset allocation strategy (Meb Faber’s GTAA): the random portfolios that contradicted the strategy (i.e. invested in assets the strategy would normally avoid) showed significantly worse performance, confirming that the strategy’s rules were beneficial. This kind of analysis helps isolate the value of a strategy – if removing the strategy’s information leads to consistent underperformance, it’s a sign the strategy was genuinely adding value.
-
Synthetic and Custom Benchmarks: Random portfolios enable the creation of bespoke benchmarks that mirror a strategy’s behavior. Traditional benchmarks are often static – e.g. a 60/40 stock-bond mix – but what if your strategy dynamically shifts across assets or sectors? A static index may be a poor comparison. Instead, you can simulate a “synthetic benchmark”: run a large number of random portfolios that follow the same allocation ranges or trading frequency as your strategy. The median or middle of those random outcomes becomes a living benchmark that moves as your strategy’s exposures move. For instance, Faber’s GTAA strategy rotates among stocks, bonds, real estate, commodities with monthly timing. A researcher constructed a synthetic benchmark for GTAA by simulating 25,000 random portfolios that also rotated monthly within the same five assets (U.S. stocks, international stocks, bonds, REITs, commodities). The median random portfolio tracked a similar path as an equal-weighted benchmark, but crucially, it “better reflects the dynamics of the GTAA strategy” – because it too shifts allocations over time – while guaranteeing zero skill in its decisions. In comparing GTAA’s performance, this random benchmark was preferred over a simplistic static index, since it was designed to match what the strategy could do without skill. In general, whenever a strategy doesn’t have a clear single-index benchmark (e.g. multi-asset global tactical funds, thematic portfolios, etc.), random portfolios can fill the gap by producing a custom benchmark that moves with the strategy’s scope.
-
Insights on Where Skill Matters: Analyzing random portfolio outcomes can also reveal which decisions contribute most to performance variability. For example, a study by Kritzman and Page used random portfolios to dissect the dispersion of investment results from different levels of decision-making (asset allocation, sector selection, individual stock picking). They found that “dispersion around average performance arising from security selection is substantially greater” than dispersion from broader asset allocation choices. In plain language, picking stocks can lead to a much wider range of outcomes (good or bad) than the choice of asset class mix. Asset allocation, while critical, produced the least dispersion – meaning most 60/40 portfolios will perform more similarly to each other than two stock pickers’ portfolios might. This goes against the conventional wisdom that asset allocation is the dominant driver of returns; it suggests that skill (or lack thereof) in selecting securities can have an even larger impact on how far above or below average an investor lands. Random portfolio simulations were key to quantifying this, by providing a baseline for how much variation to expect just by chance at each decision tier.
These use cases highlight that random portfolio benchmarks are not just about beating the S&P 500 in a cheeky monkey experiment. They form a versatile framework for performance attribution and skill assessment in all kinds of contexts. Whether you’re running a mutual fund, designing a trading algorithm, or managing a multi-asset portfolio, comparing your results to a sea of randomized alter-egos can tell you a lot about where your edge truly lies.
Practical Considerations and Limitations
While random portfolio benchmarking is a powerful idea, it must be implemented carefully to be fair and effective:
-
Defining the Universe and Constraints: The random portfolios must be generated with the same rules and constraints as the strategy being evaluated. Apples-to-apples comparison is crucial. If a fund is limited to mid-cap stocks, the random benchmark should use the same universe – otherwise the comparison could be misleading (e.g. including micro-caps in the random set would unfairly boost the random returns if micro-caps had higher average returns). Likewise, factors like number of holdings, position size limits, turnover frequency, use of leverage, etc., should be mirrored in the random portfolios so that the randomness is the only difference from the real portfolio. In practice, this can mean quite elaborate simulation design to respect all the investment guidelines a manager follows.
-
Sampling Biases (Equal-Weight vs. Cap-Weight): How you randomly select and weight assets matters. A naive approach might pick stocks equally at random and equal-weight them. However, researchers like Surz warn that this could introduce unintended tilts – for example, an equal-weight random selection tends to overweight small-cap stocks relative to a cap-weighted index. Small-cap and value stocks historically have higher volatility and sometimes higher returns, so an equally-weighted “random” portfolio might outperform a cap-weighted benchmark not due to luck but because of a built-in small/value bias. Surz argued that to truly emulate an unbiased manager, one should sample stocks proportional to their market size (value-weighted sampling) so that each stock’s chance of inclusion mirrors its prominence in the market. This way, the random portfolios as a whole reflect the market’s composition and avoid systematically favoring small companies. On the other hand, some experts contend that using equal-weighted random selection is actually more representative of an “unskilled” manager, since it doesn’t assume the manager would allocate by market cap. In practice, the choice may depend on context – if you want to remove all factor tilts, you might lean toward value-weighted sampling; if you want to see what a completely agnostic stock picker might achieve, equal-weight sampling makes sense. It’s important to be aware of these distinctions because they affect the benchmark distribution. The key is consistency: align the random portfolio construction with the spirit of the strategy you’re benchmarking.
-
Risk and Characteristics Mismatch: Even if you match constraints, random portfolios can have different risk profiles than the actual fund. For example, a randomly picked stock portfolio might, on average, have higher volatility or different sector exposures than a carefully constructed active portfolio. Studies have noted that random portfolios often end up with certain “unfair” characteristics versus the fund under evaluation (perhaps higher beta or more small-cap exposure). This doesn’t invalidate the approach, but analysts must either acknowledge these differences or control for them. For instance, if the random benchmarks are consistently more volatile, one might incorporate risk-adjusted metrics (like compare Sharpe Ratios instead of raw returns). Another approach is to impose additional constraints on random portfolios (e.g. match the fund’s sector weights or volatility target) to ensure a fair comparison. The goal is to give the strategy a reasonable and relevant hurdle – not to compare a low-risk fund to wildly risky random portfolios, or vice versa. Properly designed random benchmarks will account for major risk factors so that the competition is on a level playing field.
-
Computational Intensity and Interpretation: Generating and analyzing thousands of portfolios requires computing power and statistical expertise. Thanks to modern software, this is usually manageable (there are even APIs and packages, like Portfolio Optimizer or Portfolio Probe, dedicated to random portfolio simulation). The bigger challenge may be interpreting the results in a way that’s meaningful for investors. It’s one thing to say a fund is in the 80th percentile of random outcomes – but this needs to be translated into plain English (e.g. “Fund X beat 80% of all similar portfolios that could have been built by chance”). There is also the question of how many random portfolios are enough – generally, more is better to stabilize the statistics, but beyond a certain number (say 5,000 or 10,000) you get diminishing returns in insight. As with any Monte Carlo analysis, results can have a margin of error; running the simulation multiple times or increasing the sample can improve confidence. You can observe this in the Monte Carlo Simulations of the Stock Trends Picks of the Week returns published earlier - see Monte Carlo Simulations Validate the Statistical Edge of Stock Trends Picks of the Week. Run the simulations yourself!
-
Not a Replacement for All Benchmarks: Random benchmarks are extremely useful, but they don’t necessarily replace traditional benchmarks in every situation – rather, they complement them. Market indexes still tell us valuable information about broad market performance. The random portfolio approach is best used when you want to isolate skill or analyze a strategy in depth. Many investment reports now might include both: e.g. “Fund outperformed S&P 500 by 2%, and also ranked in the top quartile of random strategy-matched portfolios.” This gives a fuller picture. Also, if a strategy’s universe is basically “the S&P 500 stocks,” then the index itself (with appropriate adjustments) is one point on the random distribution – it’s just a particular weighted combination. In fact, one study found that an equal-weighted index can be a “tough benchmark to beat” for active managers. Random benchmarking shines most when a single index is insufficient or when you suspect that beating the index might not equate to true skill (due to the index’s biases). It’s an additional lens to view performance, one that provides statistical rigor and nuance.
The Bottom Line: A New Standard for Benchmarks
Using random portfolios as benchmarks reframes the performance conversation. Instead of asking “Did you beat the S&P 500?”, we ask “Did you beat what anyone could have done by just picking stocks at random (given the same opportunities)?” It’s a high bar, but a fair and insightful one. This approach has gained traction in the last several years as investors and analysts recognize that a bad benchmark can be worse than no benchmark at all – and that a carefully constructed random benchmark is often the right benchmark for evaluating skill.
For retail investors, the concept might initially sound abstract, but its value is quite practical. It teaches us humility – if your portfolio beats the market, check how it fares against a sea of random portfolios. You might discover that your outperformance isn’t as improbable as you think (in a roaring bull market, many random stock combos will also look brilliant), or conversely, that your underperformance is well within the realm of chance. On the flip side, if you truly have a winning strategy, proving it against a random benchmark can give you confidence that you’re not just enjoying lucky beta or riding coattails of a hot sector. In an era when 88% of professional fund managers lag their benchmark over time, using every tool to discern luck from skill is crucial.
Stock Trends’ own research and tools reflect the importance of random portfolio benchmarks. The Stock Trends Inference Model (ST-IM), for instance, is built on rigorous statistical principles to estimate the probability of outperformance for stocks and strategies. A natural extension of this is incorporating random portfolio comparisons – ensuring that when ST-IM highlights a stock with, say, a 70% chance of beating the market, that inference is grounded in comparisons to unbiased, random outcomes and not just historical quirks. In fact, future enhancements to Stock Trends analytics are leveraging random portfolio simulations as a baseline for strategy performance. By doing so, Stock Trends will help investors answer the key question: is a given trading strategy or signal genuinely adding value, or would a random selection do just as well? Expect to see more of these probabilistic, simulation-based benchmarks in Stock Trends reports and tools, as the platform continues to marry classic trend analysis with modern data science.
In conclusion, random portfolio benchmarks add depth and context to performance evaluation. They force us to confront the role of chance in investing – a sobering and ultimately empowering perspective. For too long, many investors compared results only to blunt indexes that might stack the deck for or against certain strategies. By using random portfolios as an unbiased yardstick, we get a clearer measure of skill, a better understanding of risk, and a reality check on our investment decisions. In the quest for “smarter investing”, as Stock Trends would put it, this approach is becoming an important part of the toolkit – helping ensure that when we do beat the market, we know it wasn’t just monkeys and darts that could have done the same.
Sources:
-
Stock Trends Publications – Random Portfolio Benchmarks (2018)
-
Stock Trends Publications – Stock Trends Slots Game! (2017)
-
Portfolio Optimizer Blog – Random Portfolio Benchmarking (2024)
-
The Capital Spectator – The Case for Using Random Benchmarks (2017)
-
Medium (Limitless Investor) – Randomly Picked Stocks Outshine Wall Street (2024)
 An admitted cynic, it's obviously very high praise when he says he likes StockTrends because of its "simplicity, utility, openness, [and] honesty," and in addition to having "no hidden agenda" is "understandably documented [and] historically verifiable." And, he adds, "It lets me see a lot of things without doing a lot of work." Globe and Mail


