
The market’s October tremor—an abrupt but short-lived flash crash—has given way to a familiar pattern in the Stock Trends framework: the rapid repair of breadth and the birth of new trends. Where panic once pressed prices indiscriminately, order is returning through a disciplined sequence of new bullish signals, rebuilding sectors, and the subtle reorganization of leadership beneath the surface.
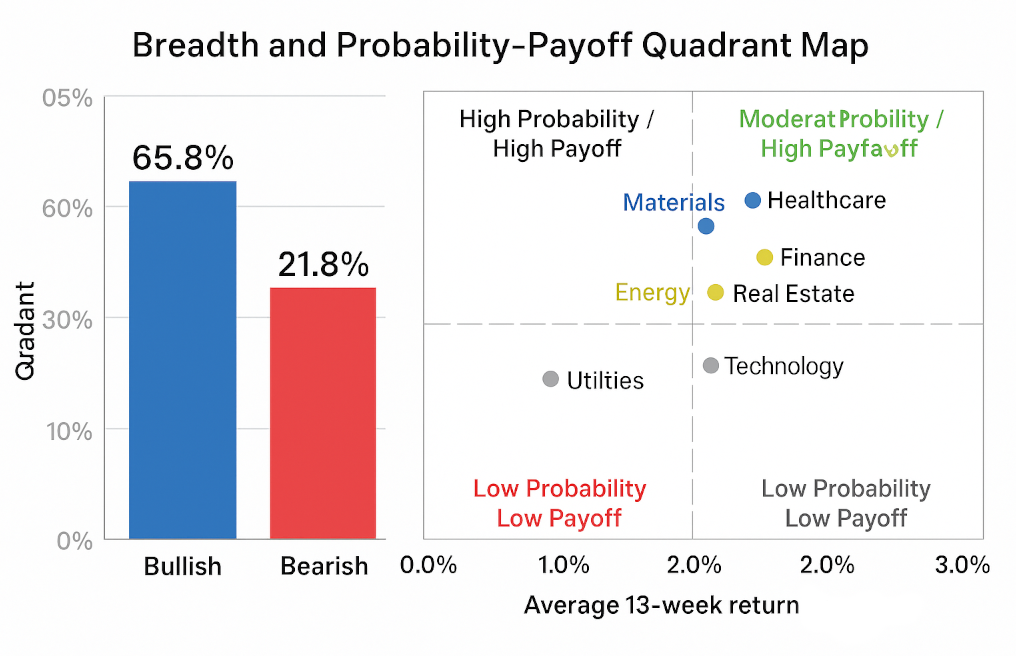
According to the latest Stock Trends universe dated October 24, 2025, 65.8% of listed equities now reside in bullish categories (![]() ,
, ![]() ,
, ![]() ), while only 21.8% remain bearish (
), while only 21.8% remain bearish (![]() ,
, ![]() ,
, ![]() ). That breadth reversal, occurring just two weeks after the October air-pocket, is the hallmark of a market that is rotating rather than breaking. The Stock Trends database now counts 1,663 fresh trend signals, including 1,050 new bullish initiations—a broad renewal of upward momentum across exchanges.
). That breadth reversal, occurring just two weeks after the October air-pocket, is the hallmark of a market that is rotating rather than breaking. The Stock Trends database now counts 1,663 fresh trend signals, including 1,050 new bullish initiations—a broad renewal of upward momentum across exchanges.
This recovery bears the fingerprints of a structural rotation rather than a speculative rebound. The Stock Trends Inference Model (ST-IM), which quantifies the probability of outperforming a random benchmark portfolio over forward horizons, reveals a distinctly ordered hierarchy of opportunity. By aligning each stock’s 13-week probability (the prob13wk measure) with its expected 13-week return estimate, a probability–payoff map emerges—our lens for understanding where the next phase of leadership resides.
1. From Dislocation to Leadership: The Anatomy of Recovery
In the Stock Trends framework, recovery from a flash crash unfolds in stages.
-
Shock and reset: correlations spike, volume surges, and trend counts collapse toward zero.
-
Repair through fresh signals: as selling pressure exhausts, Minor Trend Count = 1 events multiply, producing a flood of New Bullish (
 ,
,  ) entries.
 -
Breadth confirmation: major trend counts stabilize or begin to lengthen, indicating durability in the new cohorts.
The present dataset sits squarely in stage three—breadth confirmation. The histogram of trend ages shows a wide base of short-term bullish trends under 10 weeks old, yet a solid spine of maturing long-term signals remains intact. The flash crash, in other words, did not dismantle the market’s major uptrend structure; it merely refreshed it.
Volume analysis supports this reading. Only 960 names display high-volume tags (![]() ), compared to 2,882 low-volume readings and 10,781 neutral. That distribution describes selective accumulation—not the indiscriminate speculative thrust seen near market tops.
), compared to 2,882 low-volume readings and 10,781 neutral. That distribution describes selective accumulation—not the indiscriminate speculative thrust seen near market tops.
2. The Probability–Payoff Map: A Quantitative Compass
ST-IM’s forward-looking measures—13-week outperformance probability and expected return estimate—offer a statistical compass for investors seeking direction amid rotation.
Plotting sectors by average 13-week outperformance probability versus average expected 13-week return yields a clear quadrant map:
| Quadrant | Description | Current Sector Examples |
|---|---|---|
| High Probability / High Payoff | Strong confidence of outperformance with material expected gain. | Materials, Healthcare |
| High Probability / Moderate Payoff | Reliable but less volatile recovery; mean-reversion and stability plays. | Finance, Real Estate |
| Moderate Probability / High Payoff | Higher-beta cyclical plays; more tactical opportunity. | Energy, Industrials |
| Low Probability / Low Payoff | Defensive or lagging areas. | Utilities, parts of Staples |
Materials now lead the field:
-
Average probability of outperforming the benchmark return in the upcoming 13-week period ≈ 0.535 (54%), expected x13wk ≈ 3.0%,
-
79% of constituents in bullish categories,
-
69% above RSI 100—evidence of strong intermediate momentum.
Healthcare follows closely with 53.2% probability and 2.86% expected gain, supported by consistent volume and sustained relative strength.
In contrast, Real Estate and Finance post the highest average probabilities (54.2% and 53.6% respectively) but smaller payoffs—these sectors represent the stabilizers in the rotation. They demonstrate breadth reliability, not explosive performance, and anchor the probability side of the map.
Together, these sectors form the dual engine of the current advance:
-
Probability leadership in Real Estate and Finance establishes market footing.
-
Payoff leadership in Materials and Healthcare drives alpha potential.
Technology, long the structural core of the bull phase, maintains a steady 53.4% probability of outperforming the benchmark 13-week return with 2.46% payoff—neither leading nor lagging. Its role now is supportive, the backbone of stability rather than the spearhead of speculation.
3. Fresh Bullish Leadership: The New Cycle’s Building Blocks
The breadth of Trend Count = 1 signals reveals the changing complexion of leadership.
-
Finance dominates with 173 new bullish initiations,
-
Followed by Consumer Discretionary (63), Healthcare (58), Industrials (47), and Technology (44).
This clustering of fresh momentum in cyclicals confirms the rotation thesis—capital moving from the prior defensive strongholds toward economically sensitive sectors.
In the ST-IM lens, these fresh cohorts typically exhibit the highest probability acceleration over subsequent weeks, as their early-trend confidence metrics rise faster than those of entrenched trends.
For investors, this means the opportunity lies not in chasing the longest-aged signals, but in harvesting the young trend advantage—those first few weeks after confirmation when probability and payoff climb together.
4. Interpreting the Signals Through the Stock Trends Framework
The Stock Trends indicator system simplifies complex market behavior into observable phases:
-
Bullish (
,  , ) represents positive intermediate-term bias.
 -
Bearish (
 ,
,  ,
,  ) denotes downward or corrective pressure.
 -
The minor trend count variable measures the age of each move,
-
major trend count tracks the age of the major trend—often the “anchor trend” behind the noise.
By coupling these pattern counts with relative strength (RSI) and volume tags, investors can assess both momentum quality and conviction. The current data reveal that 34.6% of all bullish stocks already exceed RSI 100, confirming the presence of broad positive momentum without reaching exhaustion levels.
When overlaid with ST-IM probabilities, the framework becomes a two-dimensional decision tool:
-
Directional bias and maturity (from the trend indicators), and
-
Statistical edge (from ST-IM probabilities).
This combination allows investors to navigate recovery phases with discipline—allocating first to high-probability sectors (Finance, Real Estate), then scaling exposure toward high-payoff sectors (Materials, Healthcare) as confidence builds.
5. Strategic Outlook: The Structure of Rotation
The market’s response to October’s volatility has reinforced the underlying strength of the bull structure. In the Stock Trends model of market evolution, this is the expansion phase following a stress contraction. Breadth has repaired, volatility has receded, and sector leadership has diversified.
-
Risk-on confirmation: defensive sectors such as Consumer Staples show reduced bullish participation (≈ 46%), a sign of healthy risk appetite.
-
Liquidity breadth: even after filtering for capitalization and price, leadership spans multiple sectors, indicating institutional rather than retail participation.
-
Trend longevity: major trend counts remain elevated—suggesting this rally is not merely technical recoil but an extension of the prior cycle.
The probability–payoff map thus defines the current opportunity set:
Probability is the compass; payoff is the journey.
Investors can lean on ST-IM probabilities to anchor confidence, while using return estimates to determine position sizing and risk tolerance.
6. Conclusion: The Discipline of Probabilities in a Rebuilding Market
The post-crash environment often tempts investors into binary thinking—either disbelief or exuberance. The Stock Trends framework offers a middle path: evidence-based conviction built from price behavior and probability.
The data for late October 2025 show a market that has rotated, not broken. Finance and Real Estate provide footing; Materials and Healthcare extend the advance; Technology steadies the bridge between the two. Probability leadership aligns with healthy breadth, and payoff potential is resurfacing in cyclical themes.
As always, the next test will be follow-through: whether fresh bullish cohorts extend beyond four weeks to establish mature, profitable trends. The ST-IM model will continue to track that evolution quantitatively, while the Stock Trends indicators visualize it each week for investors seeking order within volatility.
Related items
- War, Inflation, and Rotation: What Stock Trends Reveals After the Middle East Shock
- Not Risk-On. Not Risk-Off. Rotation.
- The Hard-Asset Regime Is Not a Trade — It’s a Structure
- Market Regimes at an Inflection Point: What Stock Trends Indicators Reveal About the Current Market Climate
- Spotlight on Risk: Bullish Stocks Showing Signs of Weakness
 I want to thank you for posting such an excellent guide to technical analysis on the web. You have provided a great service to all of us novice investors.


