
The latest weekly distribution of Stock Trends indicators points to an important shift in the underlying market regime for both U.S. and Canadian equities. A close examination of the composite trend structure—Bullish and Bearish proportions, crossovers, momentum breadth, and trend age—suggests that the market environment is undergoing meaningful transformation. By relating these observations to the developing Stock Trends ML Causal AI epoch framework, we gain a deeper understanding of where the markets stand within broader macro and behavioural cycles.
While the full epoch model uses a large set of machine-learning features, the essential drivers of regime classification are present in the weekly trend aggregates. These include the share of issues in bullish or bearish states, the appearance of Bullish and Bearish crossovers (![]() and
and ![]() ), breadth indicators such as RSI Up/Down (+/-) distribution and advances versus declines, as well as trend length (primary trend counter) and momentum extremes reflected in new highs and new lows. When viewed through this lens, the U.S. and TSX markets reflect distinct but thematically related regime developments.
), breadth indicators such as RSI Up/Down (+/-) distribution and advances versus declines, as well as trend length (primary trend counter) and momentum extremes reflected in new highs and new lows. When viewed through this lens, the U.S. and TSX markets reflect distinct but thematically related regime developments.
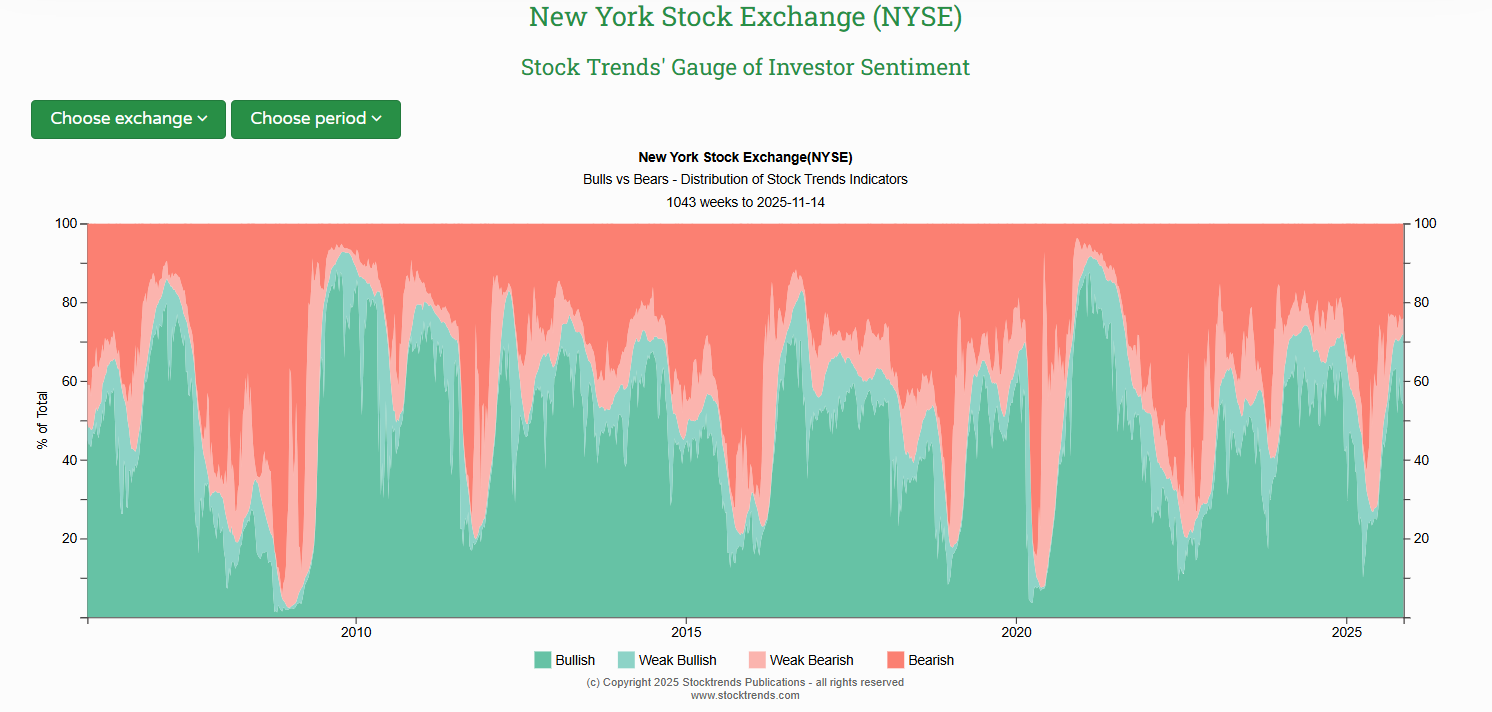
U.S. Market: The Anatomy of an Emerging Bull
The U.S. market continues to show a strengthening but uneven bullish structure. The composite Bullish proportion has risen into the low 60% range. This is significantly above long-term norms and reflects a clear improvement in the long-trend-and-intermediate-trend relationship tracked by Stock Trends. Equally important, the Bearish cohort has shrunk to roughly one-third of issues, and many of these remaining bears are old, with extended trend ages and diminishing influence.
Bullish Crossovers have increased, an important signpost in the Stock Trends methodology. A Bullish Crossover represents the moment a stock transitions from a bearish long-term trend into a positive one, typically after a base-building period or extended correction. Rising crossover counts are characteristic of early bull markets, where improving fundamentals and changing sentiment begin to lift lagging stocks toward recovery.
Yet several key breadth indicators remain soft. The RSI Up share remains below the 50% threshold, and the weekly advancers-versus-decliners ratio shows more issues declining than advancing. This mismatch—improving trend structure but weak short-term momentum breadth—is a classic hallmark of a developing bull market. Leadership tends to be narrow in the early stages, centred on large-cap or thematic groups, while the broader market remains cautious. Over time, improving breadth is needed to confirm that the new bull trend is sustainable.
These conditions align closely with the Stock Trends ML epoch framework’s Emerging Bull phase, characterised by improving long-trend indicators, rising crossovers, and incomplete breadth participation. As these trend aggregates continue to strengthen and breadth eventually normalizes, the U.S. market would move toward what the ML framework describes as a Late Bull Transition, a regime where more sectors and industry groups confirm the broader advance.
In summary, the U.S. market sits in a favourable but still formative part of the bull-building process: the early phase of a trend realignment that typically precedes more durable intermediate-term advances.
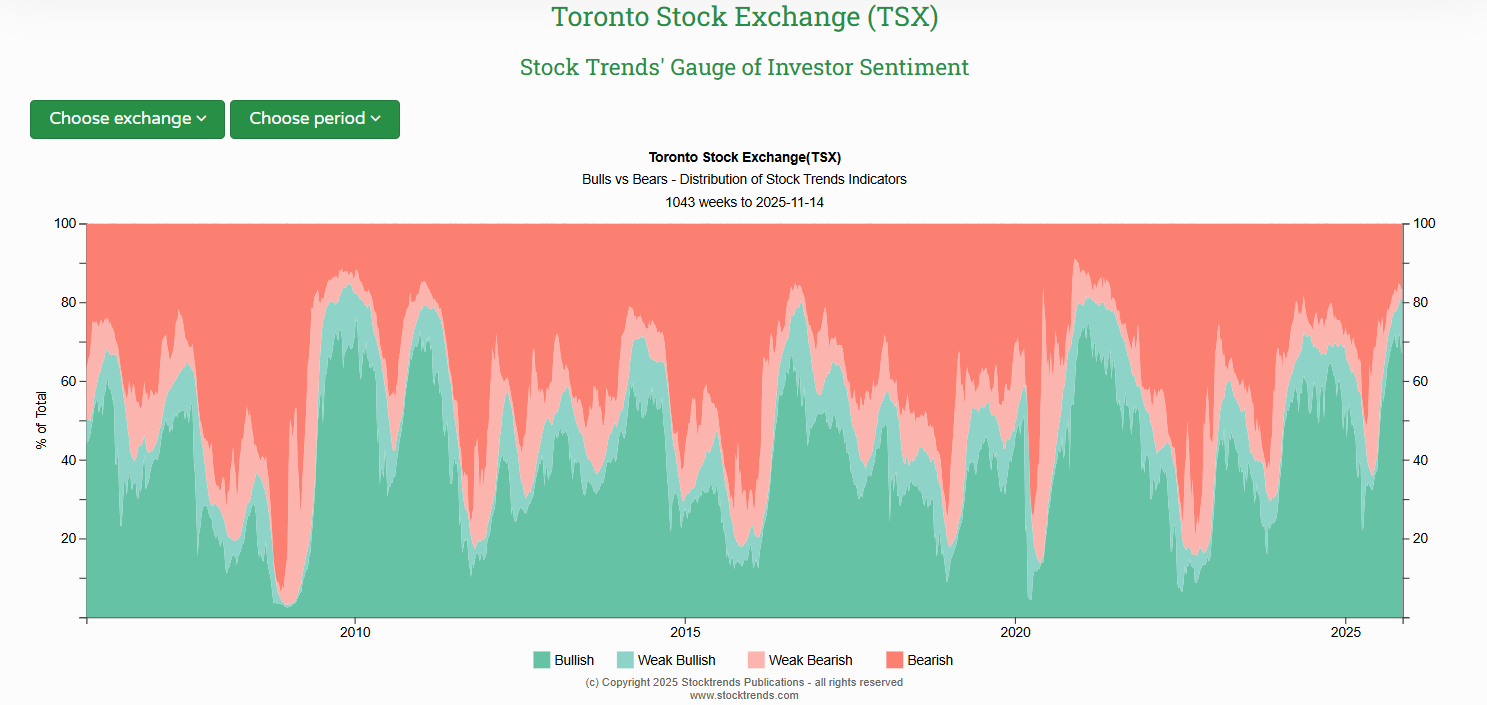
TSX Market: A Mature Bull with Renewed Momentum
In contrast to the U.S., the Canadian market currently exhibits one of the strongest bullish trend distributions in its historical record. The TSX Bullish Composite now exceeds 70%, surpassing every major long-term benchmark and reflecting a deeply established uptrend. The Bearish cohort has collapsed to roughly 15% of issues, a level typically associated with broad-based bull markets.
Momentum readings confirm this. Over 70% of high/low list constituents are making new weekly highs, indicating that breakouts are widespread and reinforcing the underlying momentum strength. Breadth is healthy, with advancing issues outnumbering decliners, and trend-age measures show a blend of long-running bullish trends and newly emerging ones—an ideal configuration of persistence and renewal.
Interestingly, RSI breadth is weaker, with only about a third of issues outperforming the index in the latest week. This may appear contradictory, but in Stock Trends analytics, this combination—strong long-trend structure with weak short-term momentum—is typical of rotational bull markets. These occur when leadership rotates among sectors, such as between cyclicals, resources, and technology groups, without altering the long-term upward trajectory.
Within the ML epoch model, this aligns most closely with the Bull Market Maturity regime. Mature bulls maintain strong long-term structures but oscillate week-to-week as capital shifts among sectors. Periods of heavy sector rotation may temporarily resemble the model’s Rotation/Volatile epoch, but the persistent strength in trend aggregates, new highs, and breadth clearly anchor the TSX in the mature bull phase.
Thus, the Canadian market stands not at the beginning of a new cycle, but well within the reinforcing middle stage—an environment where trend persistence and breakout dynamics dominate the investment landscape.
Comparing the Regimes: A Tale of Two Bulls
The divergence between the U.S. and TSX markets is not contradictory; it is diagnostic. The U.S. market exhibits the structural hallmarks of a developing bull phase: improving trends, rising crossovers, and narrow leadership. The TSX shows the signatures of a well-established, multi-quarter bull: dominant bullish proportions, widespread breakouts, and strong breadth.
Both markets are bullish, but at different positions within the bull cycle.
When viewed through the conceptual lens of the Stock Trends ML epoch model:
- U.S. Market → Emerging Bull (Epoch 1) with conditions trending toward Late Bull Transition (Epoch 4) once breadth confirms.
- TSX Market → Bull Market Maturity (Epoch 5) with occasional Rotation/Volatile (Epoch 6) behaviour during sector shifts.
The core indicator aggregates align cleanly with the epoch concepts—providing a powerful, interpretable framework for investors analyzing current market conditions.
Investor Takeaways
U.S. Market:
A strengthening early-stage bull phase with leadership concentrated in select groups. Watch for breadth improvement—particularly rising RSI Up breadth and a shift in weekly advancers—to confirm broader participation. This remains a constructive but selective opportunity environment.
TSX Market:
A mature, broad-based bull supported by strong trend persistence and renewed breakout momentum. Sector rotations may create short-term churn but do not undermine the underlying strength. Trend-following and breakout strategies remain well supported by the indicator landscape.
Big Picture:
Stock Trends analytics continue to point to resilient and improving equity conditions across North America. The exact placement within the ML epoch framework differs by market, but both markets sit firmly within the Bull regime sequence.
Related items
- War, Inflation, and Rotation: What Stock Trends Reveals After the Middle East Shock
- Not Risk-On. Not Risk-Off. Rotation.
- The Hard-Asset Regime Is Not a Trade — It’s a Structure
- Understanding Our Assumptions — A Decade Later
- From Flash Crash to Rotation: The Probability–Payoff Map of a Rebuilding Market
 You have created and maintained an amazing, highly educational program and I am grateful for your part in getting our retirement funds to the good place they are.


