The market is a complex, ever-shifting landscape. While prices fluctuate and headlines come and go, what if there was a way to make sense of these movements — not just in hindsight, but with forward-looking precision? This is the question that lies at the heart of the Stock Trends platform, and our latest research reinforces why Stock Trends indicators are more than just signals — they’re market context encoders.
Foundations: Why We Built Epochs
Over the past several months, I have been building a new machine learning pipeline to support Causal AI analysis. At the core of this effort lies the challenge of understanding market regimes, or what we now refer to as epochs — extended periods that reflect the dominant market sentiment, momentum structure, and leadership behavior.
Using engineered features derived from the Stock Trends indicator framework (including our proprietary trend codes, relative strength index [RSI] metrics, volume tags, and trend age variables), we clustered weekly market data into distinct epochs. These epochs now serve as a foundational feature for future causal analysis, helping us answer high-value questions like:
- What conditions most often lead to market surges or corrections?
- Which sectors consistently lead in bull markets?
- When is risk truly rewarded — and when is it punished?
But before diving into causal inference, we needed to ask: Do these epochs tell us anything meaningful about the market?
The answer, as it turns out, is a resounding yes.
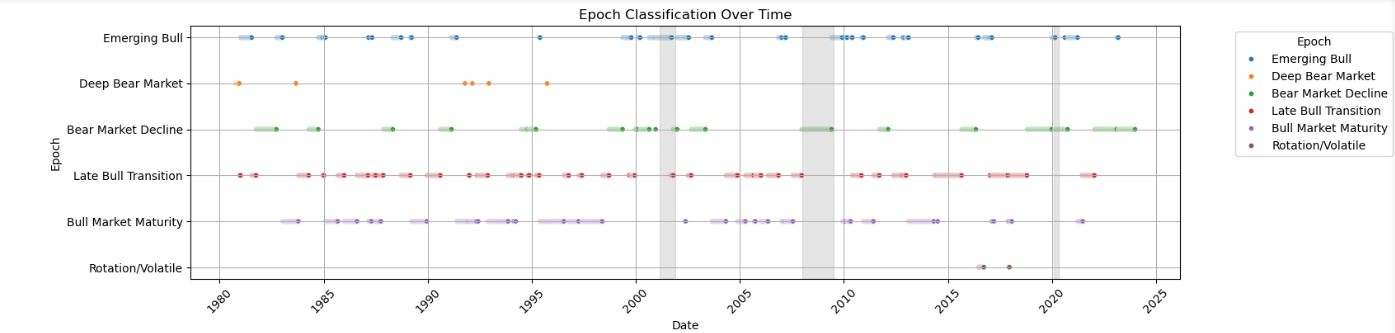
The Epochs Explained
Using unsupervised learning methods like PCA and t-SNE combined with our trend features, we identified six primary market regimes:
- Emerging Bull – The beginning of a new uptrend, marked by increasing bullish breadth.
- Bull Market Maturity – Sustained market strength with broad participation and stable trend persistence.
- Late Bull Transition – Waning bullishness and trend exhaustion; potential top formation.
- Rotation/Volatile – Market in flux, often with strong sector dispersion and lower breadth.
- Bear Market Decline – Clear downtrend with increasing bearish momentum and volatility.
- Deep Bear Market – Severe contraction; typically brief but intense.
These epochs are not arbitrary. They emerge from our indicators — especially combinations of:
trend( ,
, ,
,  ,
, ,
, ,
, ) and
) and trend_cnt(direction and age of trend)rsiandrsi_updn(momentum versus benchmark)vol_tag(volume anomalies,
 )
)mt_cnt(multi-week trend persistence)- Engineered composites like ST Composite, sector RSI averages, and RSI-relative scores
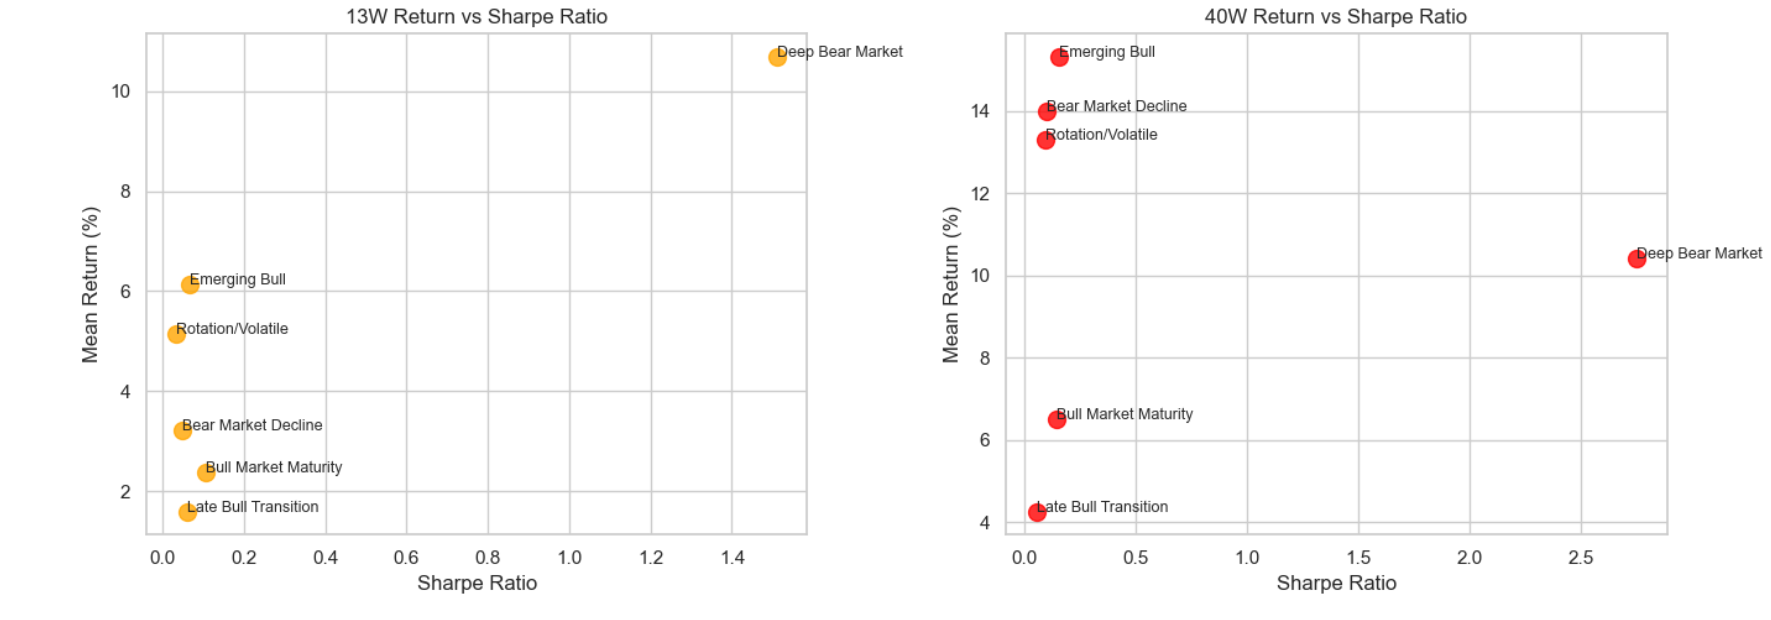
Forward Return Profiles: Risk and Reward by Epoch
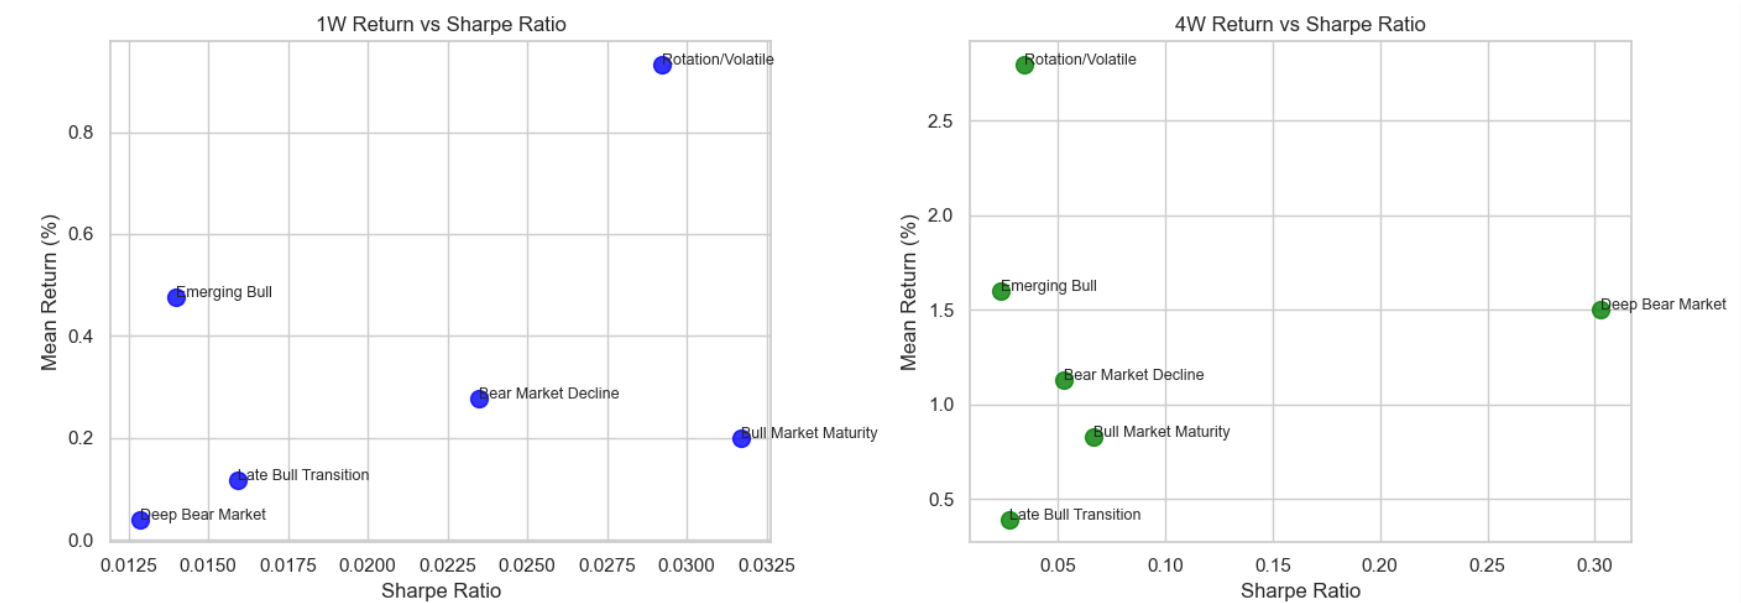
Our analysis of forward returns (measured subsequent returns after observations of Stock Trends indicator combinations and market indicator aggregates) revealed a clear differentiation in return behavior across these epochs, validating their relevance for strategy design.
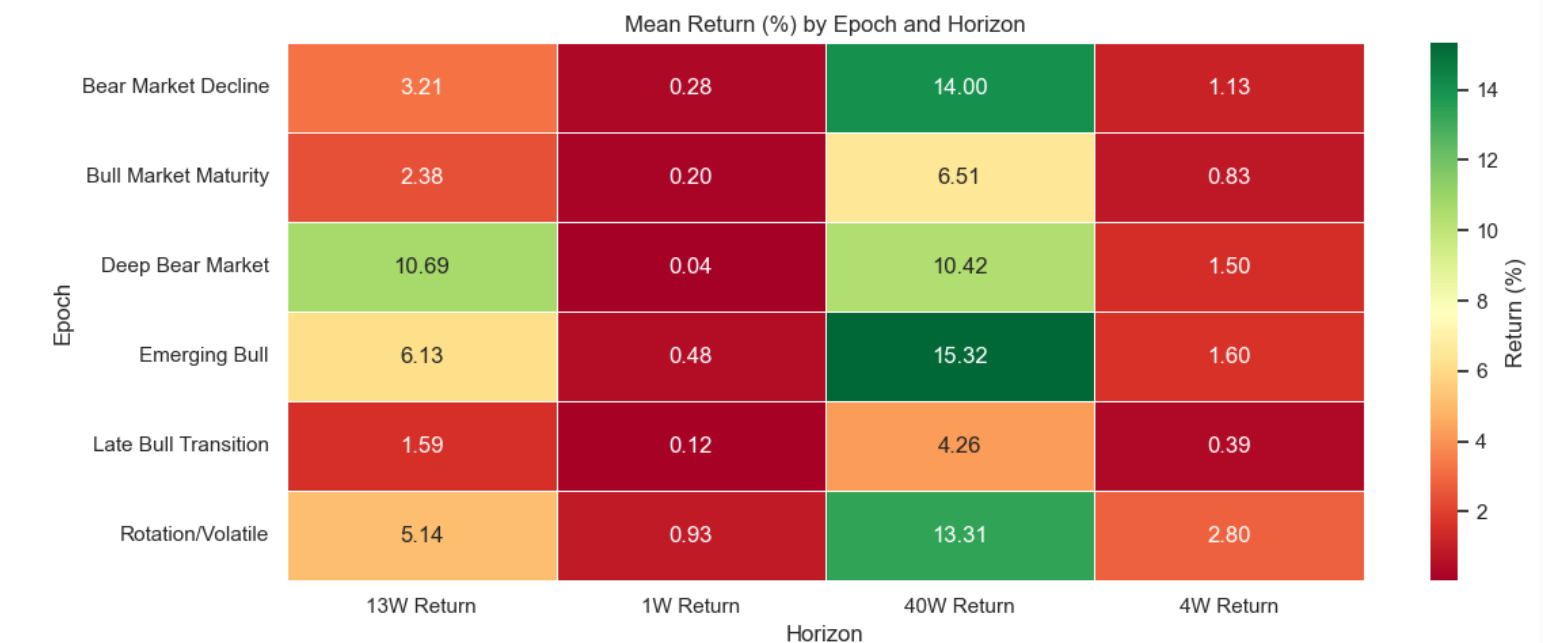
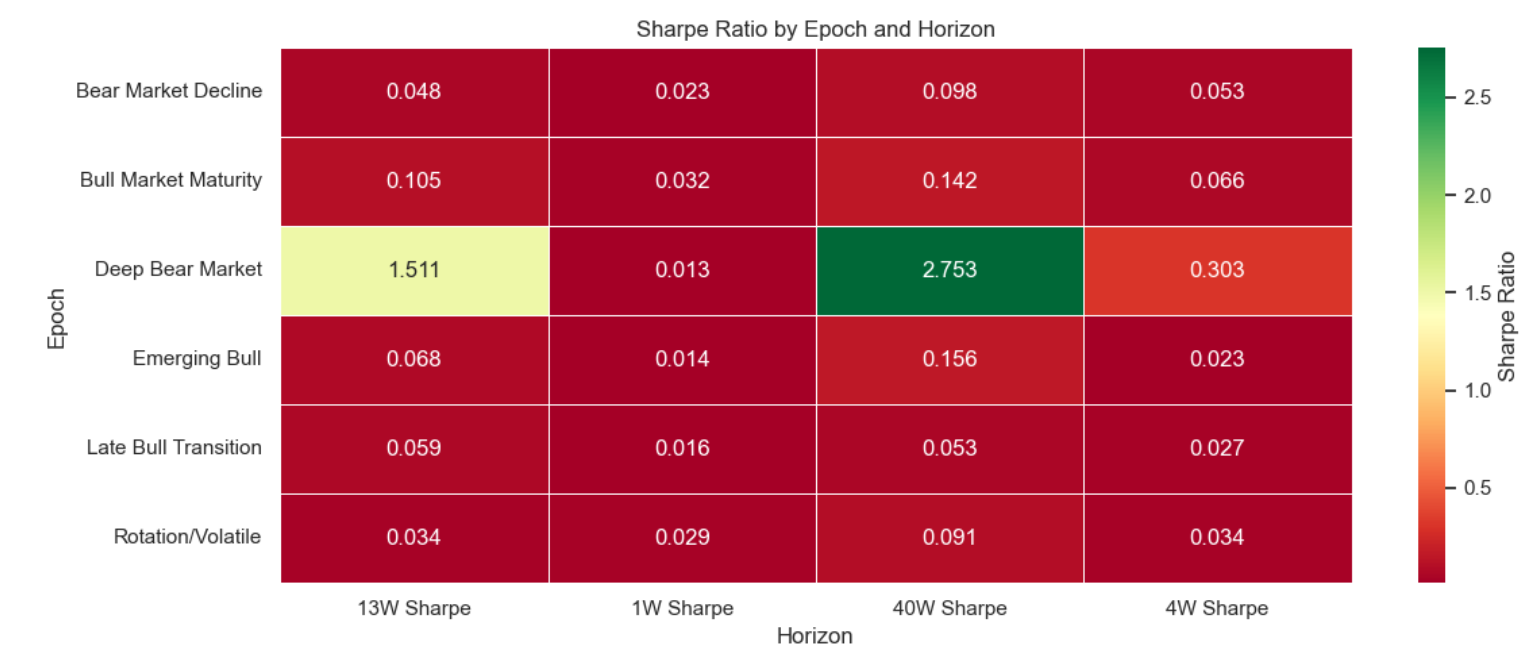
The Bull Market Maturity epoch offers the highest return-to-risk ratio, ideal for momentum-driven strategies. In contrast, Late Bull Transition epochs showed the lowest Sharpe ratios across all horizons, suggesting increased risk with little reward — a time when caution is warranted.
Emerging Bull and Rotation/Volatile epochs offer higher absolute returns but come with elevated volatility — aligning with our expectation that they represent early-stage recoveries or confused markets with sector choppiness.
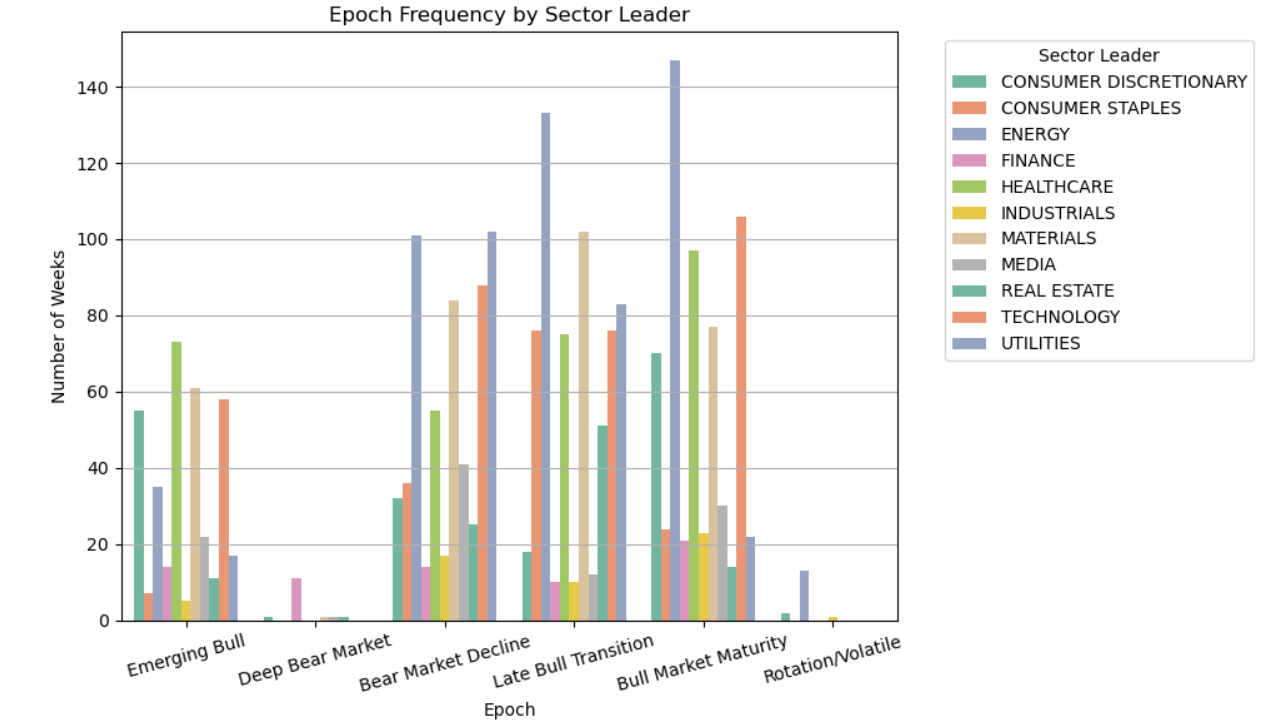
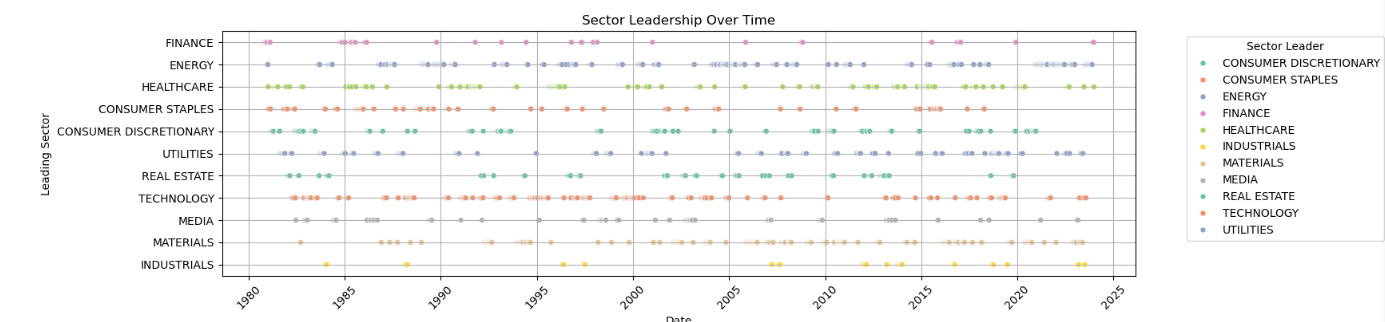
Sector Leadership Across Epochs
Sector rotation is one of the market’s most consistent behaviors, and our analysis confirms it. By aggregating sector frequencies during each epoch, we found that:
- Technology and Finance dominate most epochs, particularly during Bull Market Maturity and Emerging Bull.
- Healthcare plays a stabilizing role across cycles, with higher weights during Bear Market Decline and Emerging Bull.
- Industrials and Materials pick up momentum in mid-to-late bull phases, suggesting economic confidence.
- Consumer Discretionary surges during bull epochs, while Staples increase in relative share during defensive phases.
In Rotation/Volatile epochs, we saw sector frequencies more evenly spread, reflecting investor indecision and macro uncertainty — consistent with a “chop zone.”
Why This Matters for Stock Trends Users
Stock Trends is not a black box. Our indicators are explicit encodings of market behavior, distilled weekly and updated across the North American equity landscape. The power of these indicators lies in how they aggregate, compress, and communicate trend structure — not just in single stocks, but across sectors and the market as a whole.
With the addition of engineered epoch labels and sector context variables, we are now positioned to apply Causal AI to answer deeper questions:
- Which indicator combinations consistently precede high-performing environments?
- What causal role does sector leadership play in regime transitions?
- How should allocation shift in response to early indicators of regime change?
These are not questions of prediction. They are questions of understanding — and with understanding comes better strategy design, risk management, and investor confidence.
What’s Next: The Causal AI Frontier
All of this groundwork — from feature engineering to clustering, forward return profiling, and sector attribution — was done in preparation for the Causal AI modeling pipeline now being developed. This model will empower us to go beyond correlations and instead identify drivers and triggers of market moves, using the Stock Trends indicators as core variables in a probabilistic causal graph.
It’s a new chapter for Stock Trends — one that reaffirms our foundational insight: the indicators matter because they reveal structure in chaos.
Stay tuned.
Related items
- War, Inflation, and Rotation: What Stock Trends Reveals After the Middle East Shock
- Not Risk-On. Not Risk-Off. Rotation.
- The Hard-Asset Regime Is Not a Trade — It’s a Structure
- Understanding Our Assumptions — A Decade Later
- Navigating Market Turmoil in December 2025 – How Stock Trends Guides Investors
 I have had the good fortune to be reasonably successful and enjoy the investment process. Your process would be recommended for both experts and those who are new to investing.


