Monte Carlo Simulations Confirm the Statistical Strength of Stock Trends’ Picks of the Week
How well does a systematic momentum strategy perform over the long term? New statistical simulations provide robust validation of the Stock Trends methodology using over 30 years of technical signal data.
Each week, the Stock Trends Weekly Reporter highlights stocks and ETFs that meet a specific set of technical criteria. The result is a series of reports, including the Picks of the Week—a curated list of securities that show strong momentum based on the proprietary Stock Trends indicators, including trend strength, trend age, volume activity, and relative price performance. There have been over 120,000 picks since 1993 when Stock Trends was first published.
While subscribers rely on these picks each week, this article demonstrates their effectiveness over time by applying a Monte Carlo simulation process. Two different simulation methods—Realistic and Theoretical—are used to model portfolio outcomes over a 10-year horizon. The results speak powerfully to the statistical advantage offered by the Stock Trends model.
Simulation Goals and Methodology
To assess how the Picks of the Week perform as a systematic investment approach, we apply 1,000 Monte Carlo simulations of 10-year portfolio paths. Each simulation models monthly trading based on the 4-week forward return of Picks of the Week selections, as published in the Stock Trends Weekly Reporter.
Key Parameters:
- Portfolio size: 5 equally-weighted stocks
- Holding period: 4 weeks (i.e., monthly rotation)
- Investment horizon: 120 months (10 years)
- Performance metric: Price return only (excludes dividends or fees)
Each simulation generates a growth curve showing the total return of the portfolio over the 10-year span. The simulations differ in their sampling approach:
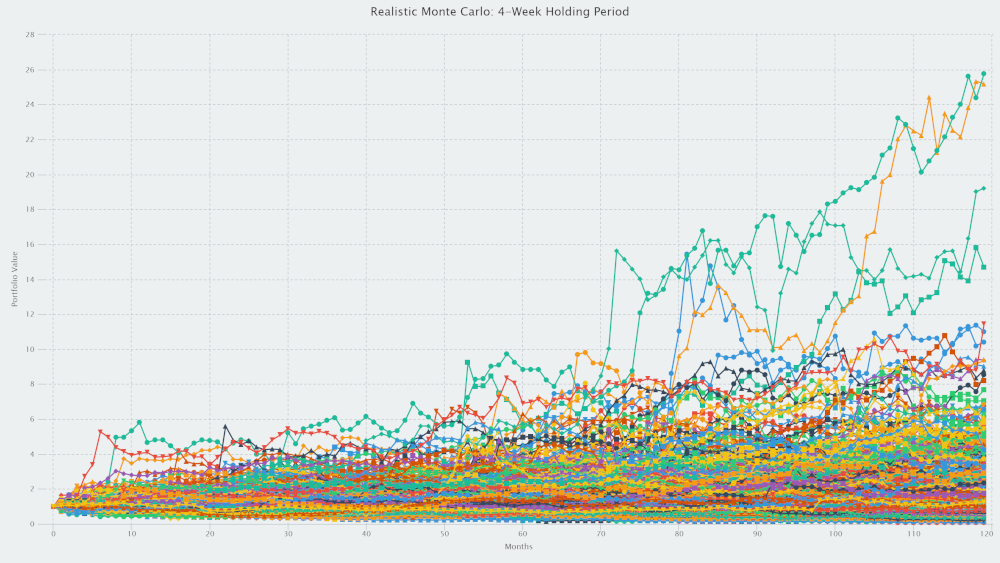
Realistic Simulation
This simulation mimics a real investor's experience. Each month, a portfolio of 5 stocks is randomly selected from a single week's Picks of the Week. These picks are based on signals generated during that specific week in history. The portfolio is held for 4 weeks, then replaced by a new portfolio of 5 picks drawn from the next available report, preserving the historical timing sequence. This method captures both the availability and cyclicality of technical signals in practice.

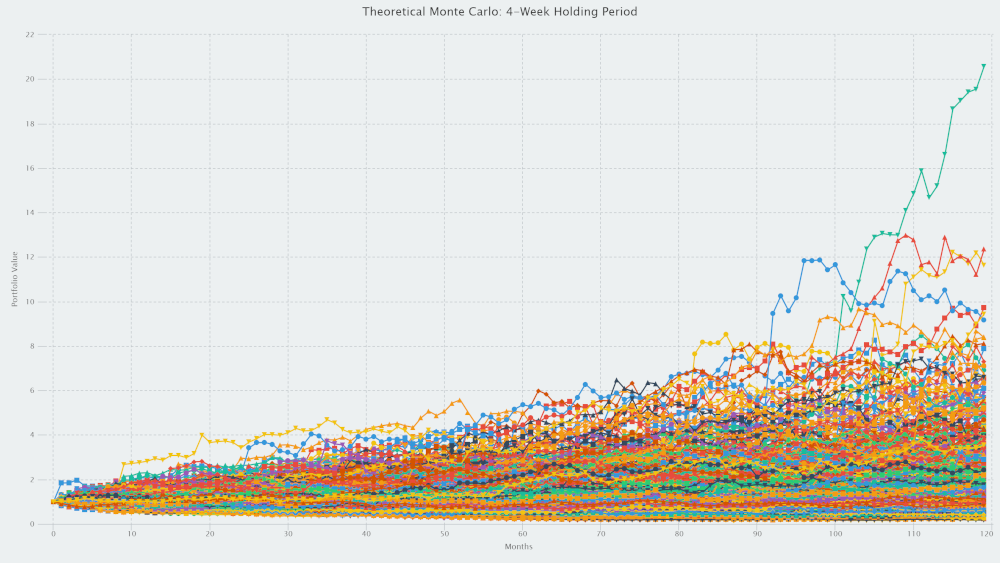
Theoretical Simulation
This simulation removes time constraints. Portfolios are constructed by randomly selecting 5 stocks from the entire history of Picks of the Week reports, without regard to the timing of the signal. While not replicable in real-time investing, this method evaluates the statistical power of the Stock Trends signals as a population of candidates, agnostic to when the signal was generated. It provides a measure of the consistency and reliability of Picks of the Week performance across market environments.

Simulation Results
The summary table below compares key outcomes of the 1,000 simulations for each method:
| Method | Max Final | Median Final | Min Final | Mean CAGR | Sharpe Ratio |
|---|---|---|---|---|---|
| Realistic | 25.76× | 1.34× | 0.06× | 3.13% | 0.36 |
| Theoretical | 20.58× | 1.44× | 0.17× | 4.21% | 0.58 |
Note: CAGR (Compound Annual Growth Rate) reflects the average annualized return. The Sharpe Ratio is calculated assuming a 0% risk-free rate and reflects the return relative to volatility.
Interpreting the Results
Realistic Simulation
The realistic simulation provides a practical benchmark for investors following the Picks of the Week report in a disciplined monthly strategy. Across 1,000 simulations:
- The maximum outcome was a 25.76× return (2,476% return) on capital after 10 years.
- The median final value was 1.34×, suggesting modest but positive compounding in most cases.
- A Sharpe Ratio of 0.36 aligns with long-term equity market performance benchmarks, indicating solid returns with moderate volatility.
Theoretical Simulation
The theoretical simulation, although less practical in application, offers powerful insight into the statistical consistency of the Stock Trends model. In this approach:
- The median return is even higher than the realistic case, at 1.44× final value.
- The Sharpe Ratio improves to 0.58, reflecting stronger return-to-risk characteristics in the signal set as a whole.
- A Mean CAGR of 4.21% confirms the positive expectancy of the selection methodology across thousands of random combinations.
While this simulation doesn’t reflect investor behavior, it validates that the Stock Trends indicators consistently identify stocks with favorable return distributions—a testament to the model’s robustness.
Why This Matters
These results affirm what long-time subscribers already understand: the Picks of the Week methodology is not based on hype or guesswork. It is grounded in measurable signals—price trends, trend age, volume surges, and benchmark-relative performance—that translate into statistically favorable opportunities.
Importantly, the analysis highlights the variability in outcomes as well. While some simulations achieved substantial compounded growth, others resulted in drawdowns. This underscores the need for consistent participation and diversified allocation, principles that are central to the Stock Trends approach. Users must apply their own critical assessments of each Picks of the Week selection to determine how well the pick fits their own risk profile and whether there are other factors - both technical and fundamental - to consider. Indeed, investors must discern which of the Picks of the Week are qualified trades. This will vastly improve the probability that the user will achieve return results that tend closer toward the top-range randomized results.
Supporting Evidence from Stock Trends ML Project
The findings here are bolstered by early research from the Stock Trends Machine Learning Project, where Causal AI methods have been applied to Stock Trends’ historical indicators. Preliminary results show that features such as:
trendandtrend_cnt(trend classification and duration)mt_cnt(momentum strength)rsiandrsi_updn(relative performance)vol_tag(volume anomalies)
...are statistically and causally linked to future returns. The same variables inform the Picks of the Week selections. These simulations, therefore, provide not only a statistical backtest, but also independent validation from machine learning research.
A Methodology Built to Endure
Whether through realistic simulations that mimic investor behavior, or theoretical models that evaluate the selection framework’s statistical power, the verdict is clear: Stock Trends Picks of the Week deliver a measurable edge - especially when used with additional layers of filtering.
For investors seeking disciplined exposure to market momentum, supported by years of data and verified through statistical and AI models, the Picks of the Week remain a powerful tool. This latest analysis reinforces the integrity of the Stock Trends indicators and underscores the value of technical signal-based investing.
**Transaction Costs and Trading Realities**
As outlined in our earlier article on Trading After the Signal, timing and execution are integral to realizing the benefits of trend-based strategies. While the Monte Carlo simulations presented here do not factor in explicit transaction costs (including slippage), it is important to recognize that the trading framework modeled—a five-stock portfolio rebalanced every four weeks—implies a relatively low turnover rate. This is consistent with the moderate trading pace advocated in the Stock Trends methodology. Over a 10-year simulation horizon, this amounts to 120 portfolio adjustments. Even accounting for modest trading expenses—commissions, bid-ask spreads, and slippage—the net impact on compounded returns would not materially alter the broad conclusion: that the Stock Trends Picks of the Week selections provide statistically significant performance benefits. Furthermore, as discussed in *Trading After the Signal*, the advantage lies not only in raw returns but in the methodical application of trend momentum indicators—minimizing noise, enhancing discipline, and, in practical terms, helping investors avoid costly overtrading. The robustness of both the theoretical and realistic simulations confirms that even after accounting for real-world friction, the Stock Trends strategy maintains its integrity and long-term reward potential.
Related items
- Stock Trends Mid-Quarter Review: How the Year-End 2025 Themes Are Performing in Q1 2026
- Stock Trends Picks Confirm Emerging Bullish Leadership
- Stocks Highlighted in Fall 2025 Trends
- Stock Trends: The Human Side of Market Trends
- Money management and trading psychology: building a resilient trading plan that integrates with the Stock Trends decision-tree framework


 Stock Trends information is part of the base information I review before making a trade.


