Financial markets are unpredictable. Even when a trading strategy has a positive expectancy, a few bad trades can wipe out an account if position sizes are too large or emotions override discipline. Academic studies show that how much capital is allocated per trade is more influential on long‑term returns than the specific trading system used. For example, research cited by position‑sizing specialist Van Tharp found that portfolio performance variability was overwhelmingly explained by position‑sizing decisions rather than the underlying strategy. This suggests that money management is not a peripheral task but the core engine that preserves capital and compounding power.
Traders therefore, need a systematic money‑management framework, not only to survive inevitable drawdowns but to thrive through compounding. Contemporary research and professional practice converge on several fundamental principles:
-
Risk only a small percentage of capital per trade. Many active trading guides recommend risking no more than 1 %–2 % of a trading account on a single position. Investopedia’s risk‑management overview warns that large positions expose traders to crippling drawdowns and notes that the one‑percent rule—limiting any single trade to 1 % of total capital—is widely adopted by day traders. Even the more liberal 2 % rule emphasises calculating the capital at risk, dividing it by the stop‑loss distance and adjusting position size accordingly. The objective is capital preservation: ten consecutive losing trades will only reduce a 2 %‑risk account by about 20 %.
-
Define stop‑loss and take‑profit levels in advance. Successful traders “plan the trade and trade the plan.” They set stop‑loss points to cap downside and take‑profit levels to bank gains. Stops help avoid the “it will come back” mentality—selling when a stock breaks key support prevents a small loss becoming catastrophic. They also enable expected‑return calculations, forcing traders to evaluate whether a trade’s probability‑weighted gain justifies its risk.
-
Diversify across assets and positions. Portfolio diversification spreads exposure across different asset classes, sectors and company sizes so that one asset’s performance does not drive overall results. Each asset class behaves differently across economic environments - diversification reduces unsystematic risk by avoiding concentration in one company or sector. Diversifying both across and within asset classes stabilises returns and reduces volatility.
-
Size positions using a formula rather than intuition. Position‑sizing frameworks like the fixed‑percentage method (risking a constant percentage of capital per trade) or Van Tharp’s CPR formula (Capital at risk ÷ Risk per unit) provide objective ways to determine position size. The CPR approach ensures that total risk (e.g., 1 % of equity) is divided by the per‑unit risk (difference between entry price and stop‑loss), producing the number of shares/contracts to trade. This prevents emotional over‑trading and allows adjustments as account equity changes. Alternative strategies such as volatility‑based sizing, constant‑dollar sizing or the Kelly criterion adjust position sizes based on volatility or expected return, but practitioners caution that the Kelly and Optimal F formulas are highly aggressive and can lead to large drawdowns; many professionals therefore use fractional Kelly or limit risk to 1 %–2 %.
-
Manage the risk of ruin. The risk of ruin is the probability of losing enough capital that trading is no longer possible. That probability depends on the win/loss ratio, position size and volatility; it can be reduced by diversification, proper position sizing, stop‑loss orders and hedging. Historical examples like the collapse of Long‑Term Capital Management demonstrate how leverage and concentrated bets can quickly lead to ruin.
-
Maintain a robust trading plan and journal. Traders should outline their motivation, define SMART goals, decide how much capital they can commit and set a risk‑reward ratio before trading. Risk only a small percentage of capital on each trade—generally less than 2%—and recording trades in a diary that includes not just entry/exit points but also the rationale and emotions behind decisions. This record‑keeping fosters accountability and helps identify patterns in decision‑making.
-
Cultivate the right mindset. Trading psychology is as important as technical analysis. Well-known trading author Mark Douglas’s maxim is that “successful trading is about managing your psychology, not predicting the markets”. Emotional intelligence—the ability to recognize and regulate emotions—helps traders remain rational during volatility. Without discipline, traders may chase losses or overtrade due to fear or greed. Practising self‑awareness, accepting emotions, and treating every trade as a learning opportunity are key steps toward emotional mastery.
These principles are widely endorsed by investment educators, regulators, and professional traders. They provide a research‑backed foundation on which traders can build a resilient, rules‑based system. The Stock Trends Handbook chapter on Money Management presents many of these principles.
Integrating money‑management with the Stock Trends methodology
Stock Trends Weekly Reporter (STWR) and its decision‑tree framework offer a structured way to apply these money‑management principles. STWR subscribers receive weekly filter reports highlighting stocks with favourable trends, momentum and volume. The decision tree guides a trader through six stages—screening candidates, evaluating trend indicators and counters, analysing relative strength patterns, forecasting returns with the Stock Trends Inference Model, assessing market context via trend‑distribution, and finally taking action. While the Stock Trends Handbook outlines this process, the framework’s power comes from integrating external risk‑management and psychology research:
-
From selection to position sizing. Stage 1 of the decision tree uses STWR filter reports (e.g., the STIM Select Stocks filter and the Newly Weak Bearish or Newly Weak Bullish report) to identify candidates. Once a candidate is selected, traders can apply fixed‑percentage or CPR position‑sizing methods. For instance, if a trader decides to risk 2 % of a $50 000 account and the stop‑loss distance is $5 per share, the CPR formula (Risk ÷ per‑unit risk) suggests buying 200 shares (risk $1000 ÷ $5). This objective sizing aligns with research recommending small risk per trade and positions the trader for consistent growth.
-
Trend signals and stop‑loss placement. Stage 2 evaluates Stock Trends’ bullish or bearish classifications and trend counters, which rely on moving‑average crossovers and envelope channels. These indicators can inform stop‑loss placement: a break below the 13‑week envelope support may be used as an exit point, consistent with advice to use technical levels for stop‑losses. Because Stock Trends emphasises trading with the trend and letting profits run, traders can adjust stops as the trend evolves while still adhering to fixed risk percentages.
-
Relative strength patterns and expected return. Stage 3 incorporates the Stock Trends RSI ± pattern model, which estimates next‑week outperformance probabilities. Combining this probability with a trade’s risk‑reward ratio enables an expected‑return calculation—the same concept recommended by risk‑management literature. If the model suggests a >50 % chance of outperformance and the reward outweighs the risk by at least 2:1, the trade may meet the trader’s predefined criteria.
-
Diversification across positions and sectors. STWR filter reports cover multiple exchanges and sectors. Traders should avoid concentrating capital in a single sector or theme, following diversification rules to reduce unsystematic risk. For example, instead of taking three positions in technology stocks, a trader might choose one tech name, one energy stock and one consumer defensive. The decision tree’s market context stage (trend distribution) can also highlight sector rotation—helping traders spread bets across sectors with favourable momentum.
-
Risk of ruin and capital allocation. By capping position sizes and diversifying, traders reduce their risk of ruin. The STWR handbook advocates limiting initial positions to around one‑fifth of trading capital and risking only a small percentage per trade. These recommendations align with risk‑of‑ruin research: over‑leveraged trades can quickly deplete capital, whereas diversified, small‑risk positions keep the account viable. Traders using Stock Trends can further mitigate risk by closing positions flagged as deteriorating by the Newly Weak Bullish report or bearish crossovers.
-
Trading plan and journal. IG Bank stresses that a trading plan should include specific goals, risk limits, and a trading diary. The decision tree itself can serve as a template for such a plan—each stage corresponds to a decision point (screen, evaluate trend, assess momentum, project return, gauge market context, act). Recording the rationale at each stage (e.g., trend classification, RSI pattern, expected return) in a journal reinforces discipline and allows traders to reflect on emotional responses.
-
Psychology and discipline. Mark Douglas’s insight that trading success depends on managing one’s psychology complements the decision tree: even with robust signals, traders must follow their risk rules and accept probabilistic outcomes. Using STWR’s structured process reduces emotional decision‑making, while self‑awareness practices (e.g., recognising greed or fear) help traders stick to their plan.
Bringing it all together
Money management and trading psychology are not optional extras but the foundation of any successful trading methodology. Extensive research shows that limiting risk per trade, using objective position‑sizing formulas, diversifying across assets, setting stop‑losses, and maintaining a disciplined trading plan are essential for capital preservation and long‑term growth. Psychological mastery—acknowledging emotions and thinking in probabilities—further distinguishes consistent traders from gamblers.
The Stock Trends decision‑tree framework provides a disciplined way to apply these principles. Its filter reports and statistical models identify opportunities, while the tree’s stages encourage traders to evaluate trends, momentum, expected returns, and macro context systematically. By combining this structure with the best‑practice guidelines outlined above—small per‑trade risk, stop‑loss planning, diversification, formalised trading plans and psychological discipline—traders can enhance both risk‑adjusted returns and peace of mind. In other words, the synergy of research‑based money management and Stock Trends’ analytical tools gives traders the confidence to ride winners, cut losers, and weather market storms.
Money Management + STWR Decision Tree: A Real Data Walkthrough (April 25, 2025 – Sep 12, 2025)
This example integrates industry-standard money-management practices with a practical application of the Stock Trends Weekly Reporter (STWR) decision tree.
The Money-Management Bedrock (used throughout)
- Small risk per trade: size so one loss ≈ 1–2% of equity.
- Objective position sizing: equal-weight entries ≈ CPR sizing when stops are a fixed % of price.
- Pre-defined exits: initial stop 10% below entry; trailing stop at 10% under the highest weekly close since entry.
- Diversification: max five holdings, sector cap ≤ 2 per sector.
- Risk of ruin control: small per-trade risk + diversification + mechanical exits.
- Plan & journal: the STWR decision tree is the written plan; we log each trade and weekly review.
- Psychology: follow the rules; think in probabilities; avoid discretionary overrides.
The Updated STWR Decision-Tree Implementation
Every week, we evaluate and (if needed) rebalance. All rules operate on weekly closes.
| Stage | Rule |
|---|---|
| 1) Universe & Liquidity | Common stocks only; Price ≥ $2; Weekly dollar volume ≥ $50-million. |
| 2) Trend Alignment | (Strong Bullish |
| 3) Momentum (RSI±) | RSI > 100 and current week rsi_updn = ‘+’. |
| 4) ST-IM Risk-Adjusted Rank | Composite score = 0.4×(4w ER/SD) + 0.6×(13w ER/SD), with a small probability bonus if prob13wk exceeds baseline. |
| 5) Portfolio Construction | Top-ranked non-held names, sector cap ≤ 2. Max 5 holdings. |
| 6) Money Management | Equal-weight new entries (≈20% each). Stops: 10% initial; 10% trailing below the highest weekly close since entry. |
| 7) Weekly Review | Exit any close ≤ stop; immediately refill open slots with the week’s best candidates (sector cap respected). |
Note: this is just an example, and although the same principles should be applied, individual investors can implement various selection criteria based on their own risk tolerance and capital. Also, the trading period of this example is relatively short in our trend analysis framework.
Backtest Setup
- Period: Apr 25 → Sep 12, 2025 (21 weeks)
- Starting capital: $100,000
- Max positions: 5 (sector cap ≤ 2)
- Stops: 10% trailing (weekly close basis)
- Sizing: equal-weight on entry (~$20k per position)
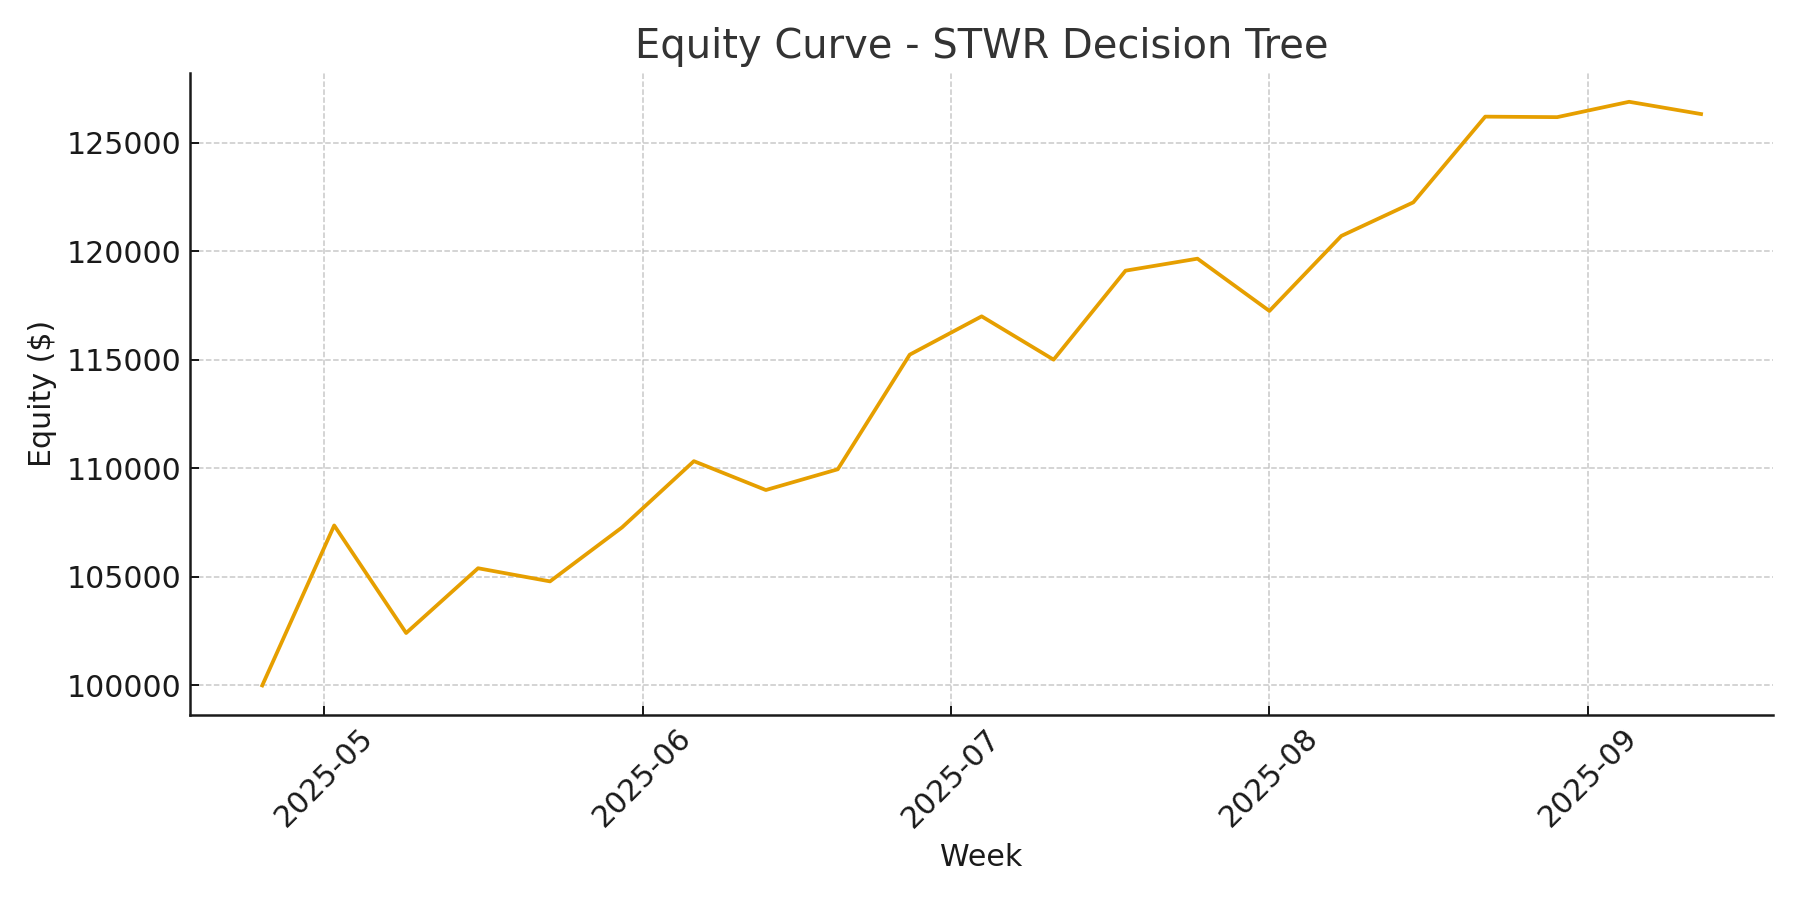
Headline Results
| Start Equity | $100,000.00 |
|---|---|
| End Equity | $126,328.37 |
| Total Return | +26.33% |
| Max Drawdown (equity) | -4.62% |
| Trades Executed | 11 total (8 buys, 3 exits) |
Week of Sep 12, 2025: no new signals triggered. No entries or exits; positions marked-to-market.
Week-1 Portfolio (2025-04-25)
| Date | Symbol | Company | Sector | Industry Group | Entry (Adj Close) | Shares | Cost |
|---|---|---|---|---|---|---|---|
| 2025-04-25 | ATON | AlphaTON Capital Corp. | Healthcare | Biotechnology & Life Sciences | $8.45 | 2,367 | $20,001.15 |
| 2025-04-25 | CALX | Calix Inc | Technology | Software & IT Services | $39.62 | 506 | $20,047.72 |
| 2025-04-25 | CRS | Carpenter Technology Corporation | Industrials | Industrial Goods | $199.00 | 100 | $19,900.00 |
| 2025-04-25 | GLNG | Golar LNG Limited | Energy | Fossil Fuels | $40.31 | 497 | $20,034.07 |
| 2025-04-25 | SCHW | Charles Schwab Corporation (The) | Finance | Capital Markets | $79.94 | 250 | $19,985.00 |
Active Management with Money-Management Discipline
- Stops: Each position began with a 10% initial stop; stops trailed 10% under the highest weekly close afterwards.
- Rotations: On any stop breach at Friday close, we exited and refilled with the top ST-IM risk-adjusted candidate (respecting sector cap).
- Risk budget: Equal-weight entries align with a ~2% risk budget per name when the stop is 10% below entry.
- Expected-risk balance: Among qualifiers, we ranked by 4w/13w ER/SD composite with a modest probability tilt (
prob13wk).
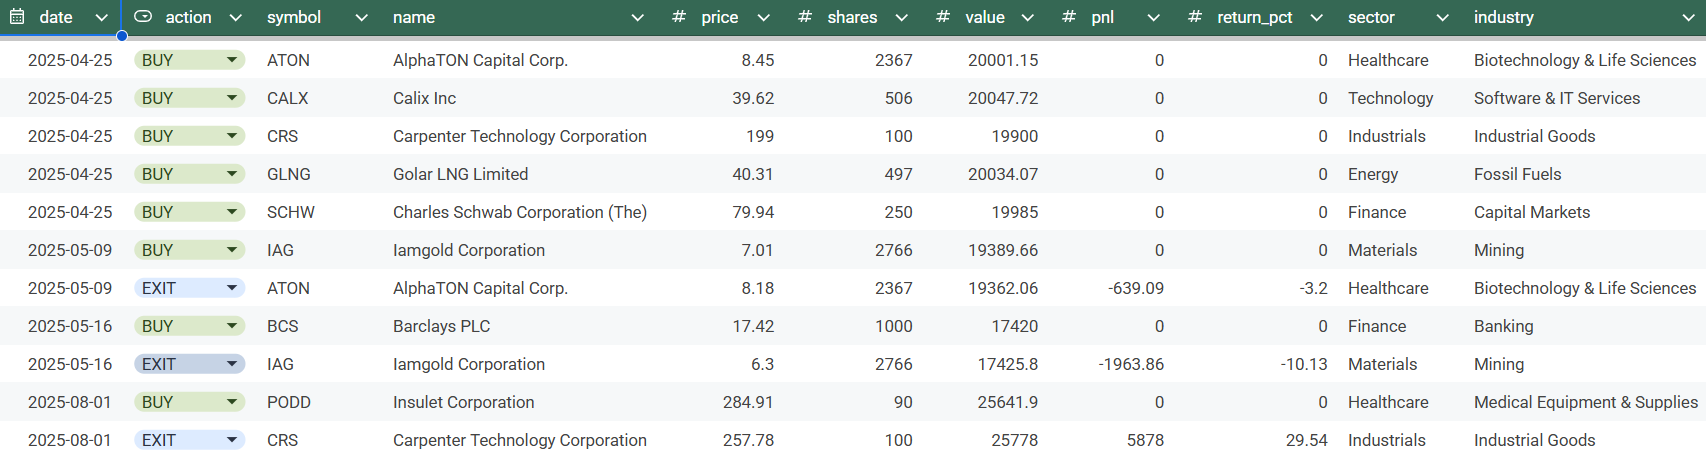
Notable Realized Outcomes
| Category | Exit Date | Symbol | Company | P&L | Return |
|---|---|---|---|---|---|
| Largest realized winner | 2025-08-01 | CRS | Carpenter Technology Corporation | +$5,878.00 | +29.54% |
| Largest realized loser | 2025-05-16 | IAG | Iamgold Corporation | −$1,963.86 | −10.13% |
Equity Curve
Trading Log
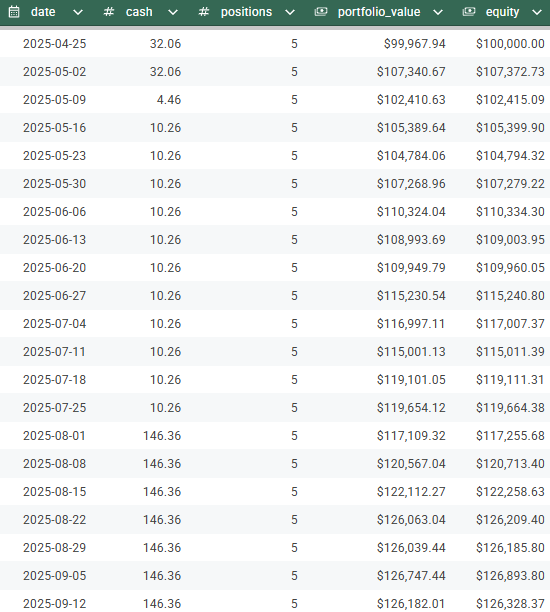
Portfolio Equity
Week of Sep 12, 2025 — Holdings assessment
No entries or exits this week; all positions were marked-to-market and trailing stops were advanced where applicable.
- CALX — Close: $61.47; Trailing stop: $55.32; Cushion: +10.00%. Comfortable buffer; continue to hold.
- GLNG — Close: $40.67; Trailing stop: $40.36; Cushion: +0.77%. On watch — a weekly close ≤ $40.36 would trigger an exit by rule.
- PODD — Close: $341.78; Trailing stop: $313.59; Cushion: +8.25%. Healthy buffer; hold.
- SCHW — Close: $93.54; Trailing stop: $87.37; Cushion: +6.59%. Moderate buffer; hold.
Notes: Trailing stop = 10% below the highest weekly close since entry.
Options - alternative rules to implement
- Liquidity guardrails: Raise the dollar-volume floor if desired.
- Sector constraints: Tighten to ≤ 1 per sector in narrow markets; loosen in broad uptrends.
- Stops: Compare 8–12% fixed, ATR-based, or time-based exits for regime robustness.
- Sizing: Switch from equal-weight to explicit CPR sizing at 1–2% of equity per trade.
Educational illustration only. This is not investment advice. Live execution entails slippage, fees, taxes, and liquidity constraints not modeled in this weekly-close study.
 You have created and maintained an amazing, highly educational program and I am grateful for your part in getting our retirement funds to the good place they are.


