
At Stock Trends, we interpret market conditions through the combined lens of our proprietary indicator framework and the Stock Trends Inference Model (ST-IM). For the trading week ended August 15, 2025, the data signals broad opportunities across sectors and exchanges — from Canadian resource anchors to U.S. technology innovators. The thematic structure of this week’s analysis emphasizes the importance of sector breadth, the evolving epoch backdrop, and targeted stock-level opportunities.
1) Sector Breadth and Market Epoch Context
The current epoch, as defined by Stock Trends ML Project distributions, continues to register a tilt toward Bullish breadth, with signs of maturity evident. Rising counts in Weak Bullish (![]() ) trends point to rotational shifts as certain sectors consolidate leadership. Sector RSI readings remain strongest in Technology, Industrials, and Energy, while interest-sensitive groups such as Utilities and Real Estate are mixed. This dynamic reflects a market still anchored in cyclical and innovation themes, but also preparing for late-cycle adjustments. The implication for positioning is selectivity: emphasize sectors where breadth and indicator confirmation already cluster.
) trends point to rotational shifts as certain sectors consolidate leadership. Sector RSI readings remain strongest in Technology, Industrials, and Energy, while interest-sensitive groups such as Utilities and Real Estate are mixed. This dynamic reflects a market still anchored in cyclical and innovation themes, but also preparing for late-cycle adjustments. The implication for positioning is selectivity: emphasize sectors where breadth and indicator confirmation already cluster.
2) Healthcare and Biotech Leadership
Healthcare remains a global pocket of strength, with biotech capturing renewed attention amid robust R&D pipelines and regulatory momentum.
Liquidia Corporation (LQDA-Q) — Indicator profile: Bullish (![]() ). ST-IM 13-week mean return ~15.9%; probability of exceeding the 2.19% 13-week base return is 62%. The elevated RSI confirms sector momentum, with Liquidia representative of broader risk-seeking behavior in the space and consistent with our epoch’s risk-on pockets.
). ST-IM 13-week mean return ~15.9%; probability of exceeding the 2.19% 13-week base return is 62%. The elevated RSI confirms sector momentum, with Liquidia representative of broader risk-seeking behavior in the space and consistent with our epoch’s risk-on pockets.

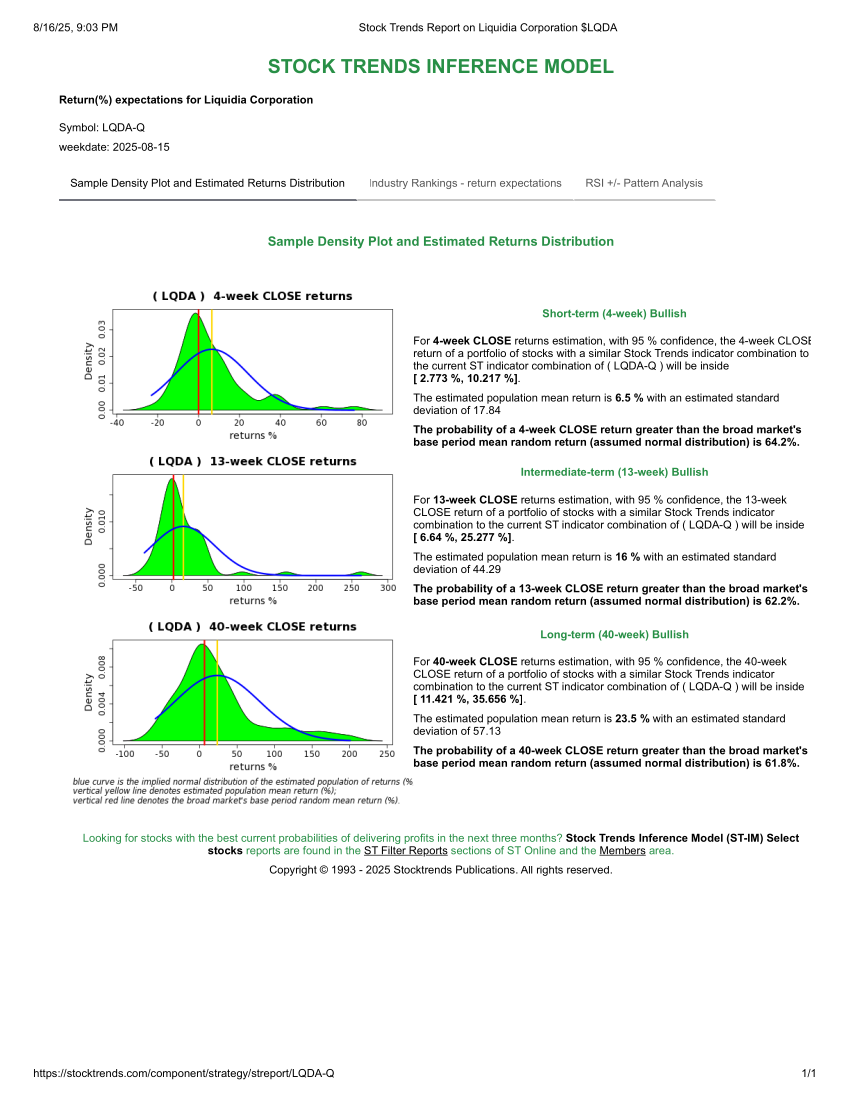
Note: all probability estimates below represent the probability of the stock's forward 13-week return being greater than the base 13-week random expected return, which is 2.19%. This analysis is available for individual stocks under the Trend Profile (subscribers only) of the stock's Stock Trends Report page, which is linked to for each stock below. See Stock Trends Inference Model.
3) Energy Transition: Fossil Fuels and Renewables
Energy shows bifurcated leadership across fossil fuels and renewables, a hallmark of the current epoch’s breadth.
- Antero Resources (AR-N) — Trend: Weak Bullish (
 ), indicating a countertrend advance within a longer bearish framework. ST-IM 13-week probability of outperforming the baseline: ~57%. Industry context: resilient U.S. natural gas demand as LNG export capacity expands; volume support suggests institutional participation.
 - GE Vernova (GEV-N) — Trend: Bullish (
 ); probability ~56%. As a renewables and grid-modernization player, GEV aligns with policy tailwinds driving clean-infrastructure investment in the U.S. and EU.
Taken together, these signals highlight a dual energy regime — traditional resource firms and green power developers advancing in tandem — that supports the sector’s contribution to the Bullish backdrop.
4) Materials and Mining Resilience
Materials and mining continue to provide both defensive hedging and cyclical leverage:
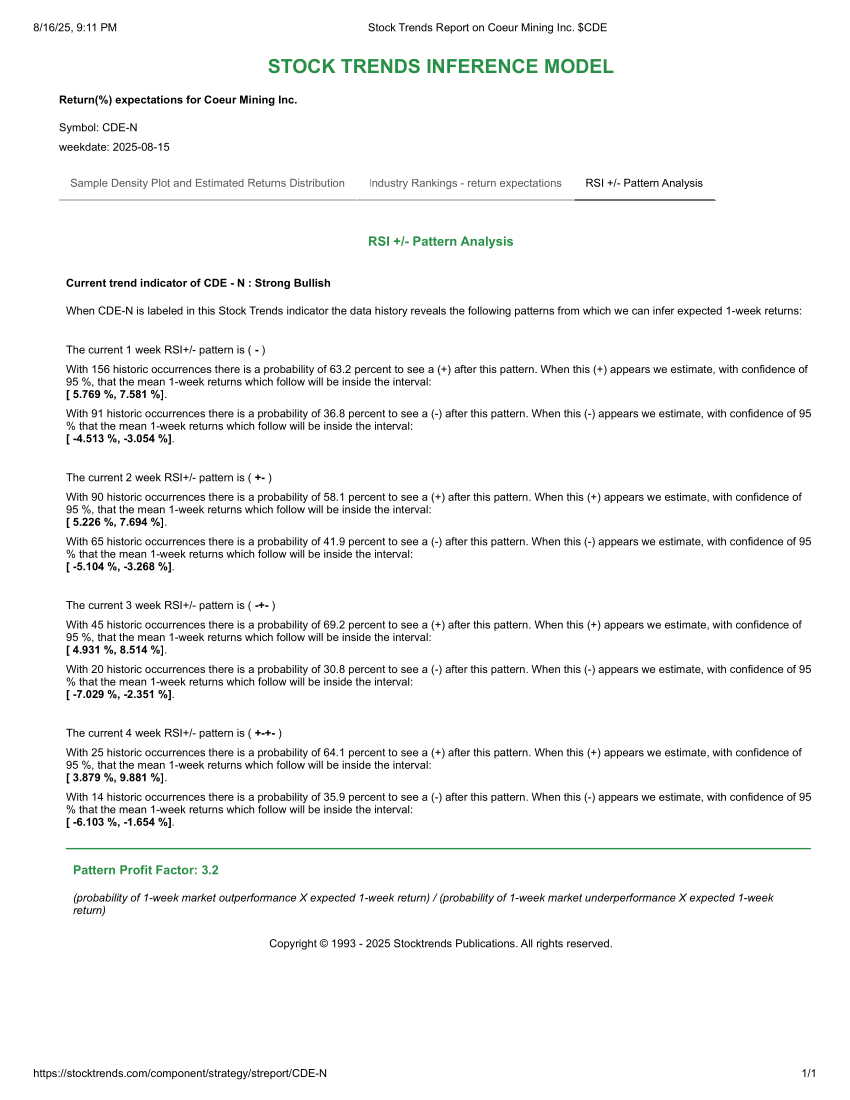
- Coeur Mining (CDE-N) — Trend: Bullish (); probability of 13-week performance ahead beating the base random result is 57%. Macro backdrop: gold and silver remain supported by central-bank demand and investor hedging, consistent with late-cycle positioning. The RSI +/- Pattern Analysis also indicates a Profit Factor of 3.2, meaning there is a good probability that the price movement in the coming week will exceed market performance, with expected returns between 3.9% and 9.9%.
- Ramaco Resources (METC-Q) — Trend: Bullish (); probability ~55.5%. Met coal exposure provides a cyclical lever to industrial activity and infrastructure demand; RSI and volume posture confirm sponsorship.
5) Technology and Innovation
Nasdaq innovation remains central to market leadership, supported by secular tailwinds in AI, quantum computing, and digital infrastructure:
- KANZHUN Limited (BZ-Q) — Trend: Bullish (); 13-week probability ~57%. Digital platforms in human-capital services benefit from post-pandemic labor flexibility and enterprise digitization.
- Quantum Computing Inc. (QUBT-Q) — Trend: Weak Bullish (); probability ~55%. While speculative, quantum technologies continue to attract government and institutional investment — validating the risk appetite reflected in Stock Trends signals.
- IREN Limited (IREN-Q) — Trend: Bullish (); probability ~56.6%. Positioned at the nexus of digital infrastructure and crypto finance, with indicator momentum consistent with the epoch’s risk-on tilt.
6) Real Estate Services
Real estate remains mixed, but selective outperformance is visible:
CoStar Group (CSGP-Q) — Trend: Bullish (![]() ); probability ~55%. Commercial property data services see structural demand as institutions reposition portfolios in a shifting rate environment. Stock Trends indicators confirm relative strength despite cross-currents in the broader property complex.
); probability ~55%. Commercial property data services see structural demand as institutions reposition portfolios in a shifting rate environment. Stock Trends indicators confirm relative strength despite cross-currents in the broader property complex.
7) Canadian Anchors in Resources
While the U.S. contributes innovation and healthcare leadership, TSX-listed resource names continue to underpin Canada’s contribution to sector breadth:
First Quantum Minerals (FM-T) maintains a Bullish (^+) trend; copper demand tied to global electrification themes supports the technical profile. The Canadian complex’s persistent Bullish and crossover counts are consistent with our epoch view that cyclicals remain foundational to the market’s intermediate-term tone. The RSI +/- Analysis for FM-T shows a Profit Ratio of 4.9 and an expected return of 3.9% - 9.9% in the coming week, on a 70% probability of outperforming the TSX index.
Follow the leadership
The August 15, 2025 Stock Trends dataset emphasizes cross-exchange leadership, with Nasdaq innovation and U.S. healthcare complementing Canadian resource anchors. The ST-IM framework validates these opportunities, with multiple stocks carrying probabilities > 55% of outperforming their base expectations over 13 weeks (vs. the 2.19% random baseline). The epoch perspective highlights that while the Bullish backdrop remains intact, signs of maturity warrant disciplined diversification and risk management.
- Positioning: Tilt toward sectors where breadth and indicator confirmation cluster (Tech/Innovation pockets; Materials/Mining; selective Energy).
- Validation: Use ST-IM selectively — only where probabilities exceed baseline thresholds and align with trend, RSI, and volume.
- Discipline: Buy on signal ( /
 / ) with RSI ≥ 100, scale with confirmation as trend count builds, and re-rank weekly by RSI change and volume tags.
Related items
- Not Risk-On. Not Risk-Off. Rotation.
- The Hard-Asset Regime Is Not a Trade — It’s a Structure
- Stock Trends Mid-Quarter Review: How the Year-End 2025 Themes Are Performing in Q1 2026
- Stock Trends Year-End Analysis: Institutional Momentum, ST-IM Alpha, and the Road Into Q1 2026
- Understanding Our Assumptions — A Decade Later
 Hence, anyone who had followed the "Stock Trends" line should have sold their Bre-X shares and, with the windfall, paid for a lifetime subscription to The Globe and Mail and more. Talk about return on investment!


