Nvidia’s extraordinary rise in recent years has made it a centrepiece of both long-term institutional portfolios and short-term trading desks. Yet few tools provide a disciplined, data-driven lens for navigating NVDA’s volatile weekly momentum. The Stock Trends RSI +/– Pattern Analysis model model is one of them—an evidence-based framework that converts historical price–benchmark relationships into probabilistic expectations of next-week performance. When applied to NVDA-Q, it becomes a powerful guide for traders seeking tactical entries, binary-style short-term trades, or precision timing for longer-term positions.
Why RSI +/– Pattern Analysis Matters for a Momentum Stock Like Nvidia
NVDA is the archetypal momentum-driven stock: strong secular tailwinds, persistent institutional accumulation, and sharp swings in relative strength. Traditional indicators often struggle to separate signal from noise in high-velocity names. The Stock Trends RSI +/– model, however, is built precisely for this environment. It evaluates how a stock has historically performed in the week following specific RSI up/down configurations, quantified as (+) or (–), and grouped by pattern duration (1-week, 2-week, 3-week, etc.).
This transforms subjective “momentum intuition” into a statistical expectation backed by decades of weekly data. The model is especially useful for:
- Short-term pattern traders
- Intermediate-term trend followers looking for tactical entry points
- Aggressive binary traders implementing probability-weighted setups
- Investors seeking to scale into long-term positions more efficiently
For a stock as widely followed—and frequently overextended—as Nvidia, disciplined timing is essential. RSI +/– Pattern history provides precisely that discipline.
Current NVDA RSI +/– Pattern Profile
The screenshots below summarize the current Stock Trends indicator history and RSI +/– Pattern Analysis state (Trend Profile tab of the Stock Trends Report) for NVDA-Q.
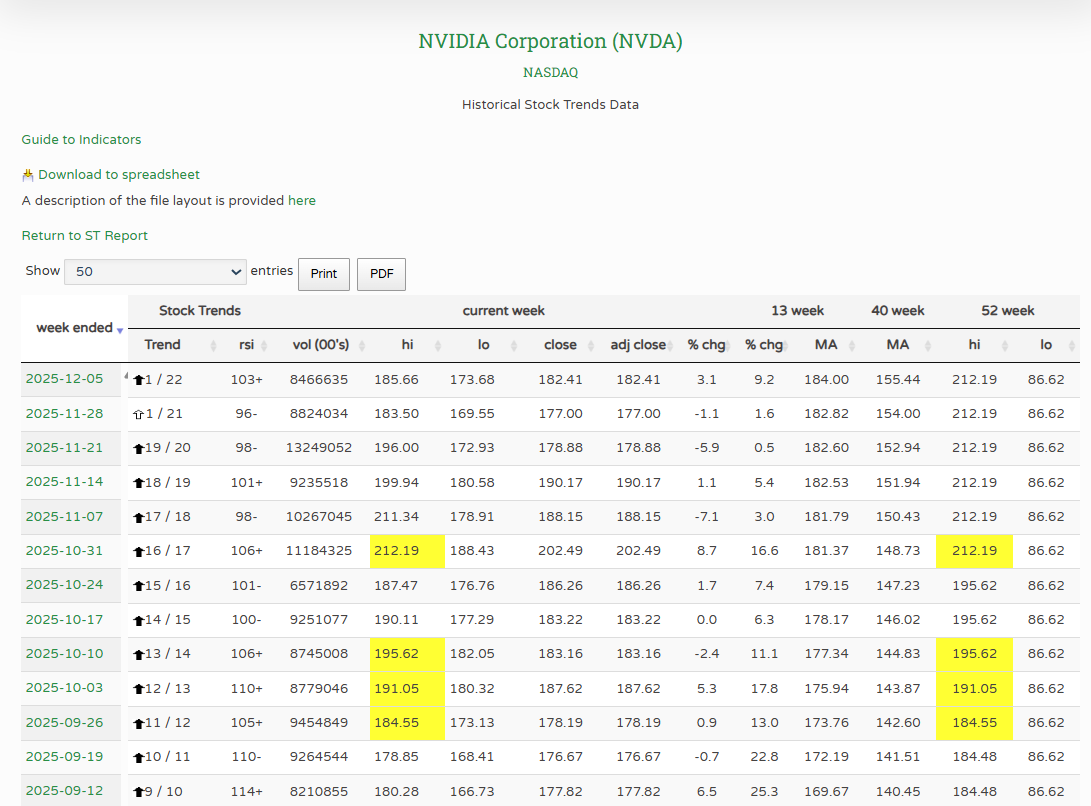
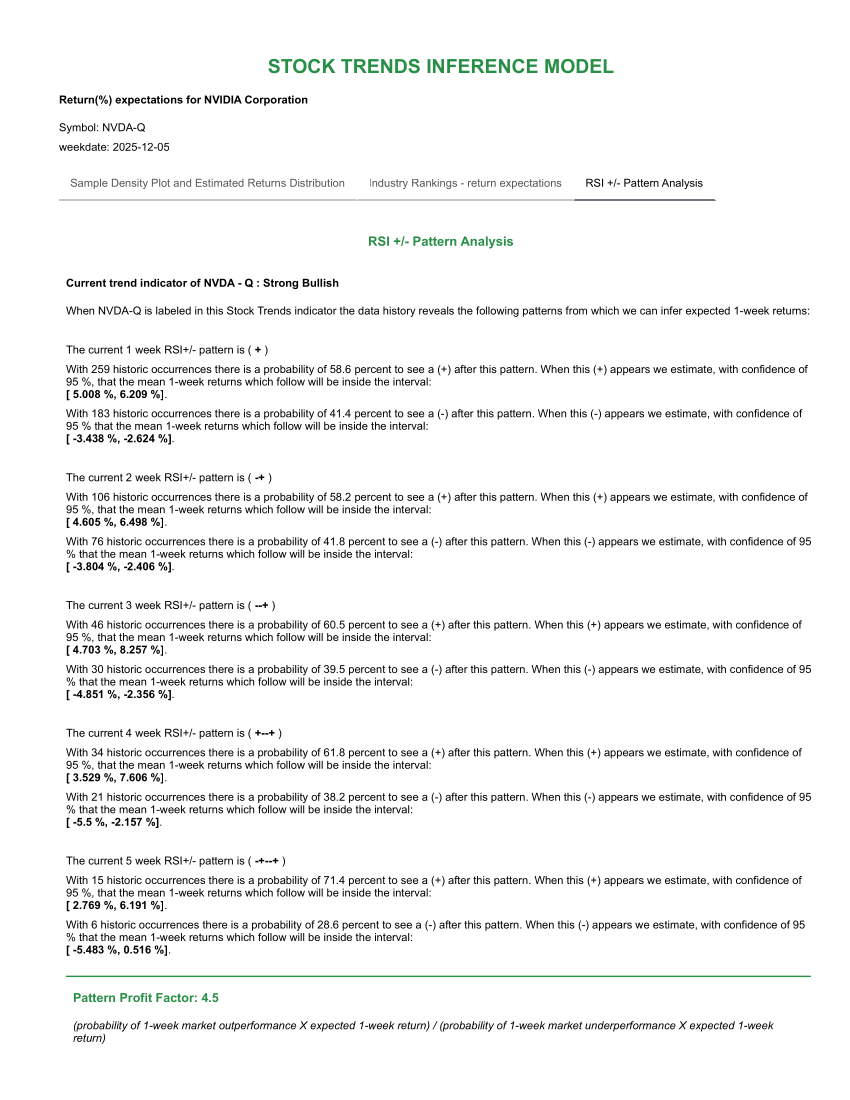
Based on the current readings, NVDA is exhibiting a 1-week (+) pattern within a broader Strong Bullish ![]() trend classification. Historically:
trend classification. Historically:
- The 1-week RSI (+) pattern carries a 58.6% probability of a positive next-week market outperformance.
- The expected 1-week return for the (+) outcome lies within the 95% interval: [5.00%, 6.20%].
- The corresponding (–) outcome, with a 41.4% probability, historically falls within [–3.44%, –2.62%].
As patterns extend into 2-week, 3-week, 4-week, and 5-week sequences, the probabilities shift—in some cases strengthening, in others weakening. For traders, these pattern durations are critical in determining whether NVDA’s momentum is accelerating or losing steam relative to the market benchmark.
The longest current pattern NVDA is exhibiting is a 5-week (-+--+) pattern within a broader Strong Bullish ![]() trend classification. Historically:
trend classification. Historically:
- The 5-week RSI (-+--+) pattern carries a 71.4% probability of a positive next-week market outperformance.
- The expected 1-week return for the (+) outcome lies within the 95% interval: [2.77%, 6.19%].
- The corresponding (–) outcome, with a 28.6% probability, historically falls within [–5.48%, 0.516%].
How to Trade Nvidia Using RSI +/– Patterns
1. Short-Term Pattern Trades (1–2 week horizon)
Traders seeking quick, probability-weighted setups can treat the RSI +/– pattern as an actionable signal. A (+) pattern—especially one with a high positive historical probability—can serve as a trigger for:
- Short-term long entries
- Weekly binary-style directional trades
- Adding to winning NVDA swing trades already underway
Because the model expresses both the probability and the magnitude of expected outcomes, it provides a structured way to size trades and define risk.
2. Intermediate-Term Trend Alignment
Even investors planning to hold for several weeks or months benefit from optimizing entry points. Entering an intermediate-term trade during a high-probability RSI (+) pattern improves forward return potential while reducing the risk of absorbing a short-term pullback.
When NVDA is already in a Strong Bullish ![]() Stock Trends trend classification, as it is now, the RSI patterns often reinforce trend continuation more reliably.
Stock Trends trend classification, as it is now, the RSI patterns often reinforce trend continuation more reliably.
3. Scaling Into Long-Term Positions
Long-term NVDA investors, who may struggle with timing new buys during rallies, can use RSI +/– patterns to:
- Add on dips during (–) patterns with historically modest downside
- Add on strength during extended (+) sequences with high continuation probabilities
Pattern sequences (e.g., 3-week (+ + +)) are particularly useful for judging whether momentum is becoming stretched or is still statistically strong.
4. Aggressive Binary or “Probability Edge” Trading
Some traders use the RSI +/– model for highly aggressive weekly setups. The model provides:
- A binary probability structure
- Expected return intervals (positive and negative)
- Pattern Profit Factor (PPF), which quantifies the reward-to-risk of following the observed historical pattern
For NVDA, the current Pattern Profit Factor of 4.5 indicates a significantly favorable positive-to-negative payoff structure for the current pattern set.
Interpreting the Pattern Profit Factor (PPF)
The PPF incorporates both probability and expected magnitude to create a single number representing pattern attractiveness:
(probability of 1-week market outperformance × expected 1-week return) / (probability of 1-week underperformance × expected 1-week negative return)
For NVDA, a PPF of 4.5 signals that this is historically a strong setup for traders who align their entries with similar past RSI conditions.
Bringing It All Together: Using Pattern Analysis Within the Stock Trends Framework
RSI +/– Pattern Analysis is not meant to stand alone. Its power is amplified when used in conjunction with the rest of the Stock Trends system:
- Trend Classification – identifies whether NVDA is trending or consolidating.
- Trend Count & Momentum Count (mt_cnt) – measure the maturity of a trend cycle.
- RSI Relative Strength – signals NVDA’s performance vs. the market benchmark.
- Volume Tags – add confirmation of institutional demand or exhaustion.
When multiple Stock Trends indicators align—such as the current Strong Bullish trend, a positive RSI (+) pattern, and supportive volume signals—the probability of a successful short-term or intermediate-term NVDA trade increases materially.
Final Thoughts
Nvidia is a complex, fast-moving stock. Investors often struggle with the emotional timing challenges created by its volatility and rapid appreciation. The Stock Trends RSI +/– Pattern Analysis model offers traders a disciplined, statistical edge—one that transforms NVDA’s weekly movements into actionable probabilities.
Whether you are entering a swing trade, timing a long-term position, or trading aggressively with a weekly horizon, the model brings clarity to decision-making and aligns short-term expectations with decades of historical evidence.
To view all of NVDA’s current trend indicators, visit the Stock Trends Report page:
NVDA-Q Stock Trends Report
Related items
- Stock Trends Mid-Quarter Review: How the Year-End 2025 Themes Are Performing in Q1 2026
- Stock Trends Year-End Analysis: Institutional Momentum, ST-IM Alpha, and the Road Into Q1 2026
- Understanding Our Assumptions — A Decade Later
- Navigating Market Turmoil in December 2025 – How Stock Trends Guides Investors
- When the “Big Short” Turned Its Eye on Tech: Interpreting the Burry Shock Through Stock Trends Indicators
 An admitted cynic, it's obviously very high praise when he says he likes StockTrends because of its "simplicity, utility, openness, [and] honesty," and in addition to having "no hidden agenda" is "understandably documented [and] historically verifiable." And, he adds, "It lets me see a lot of things without doing a lot of work." Globe and Mail


