In the August 15, 2025 update of Stock Trends Weekly Reporter, a deeper analysis of the North American equity universe reveals a narrow cohort of stocks that, while still classified in bullish trend categories, may be showing signs of structural weakness. This analysis builds upon — and adds context to — our previous article, Stock Trends Insights: Market Breadth Across Sectors and Exchanges, which emphasized broadening strength across sectors. Here, we shift our attention to vulnerable elements within that strength.
To highlight potential downside risks, we apply a focused filter on the Stock Trends August 15 dataset, selecting only those stocks that appear to contradict the bullish narrative:
- Trend: Bullish (
 ) or Weak Bullish (
 )
) - RSI: Under 100 (excluding potential data anomalies)
- Trend Age (Bullish trend category trend counter): Greater than 26 weeks (indicating trend maturity)
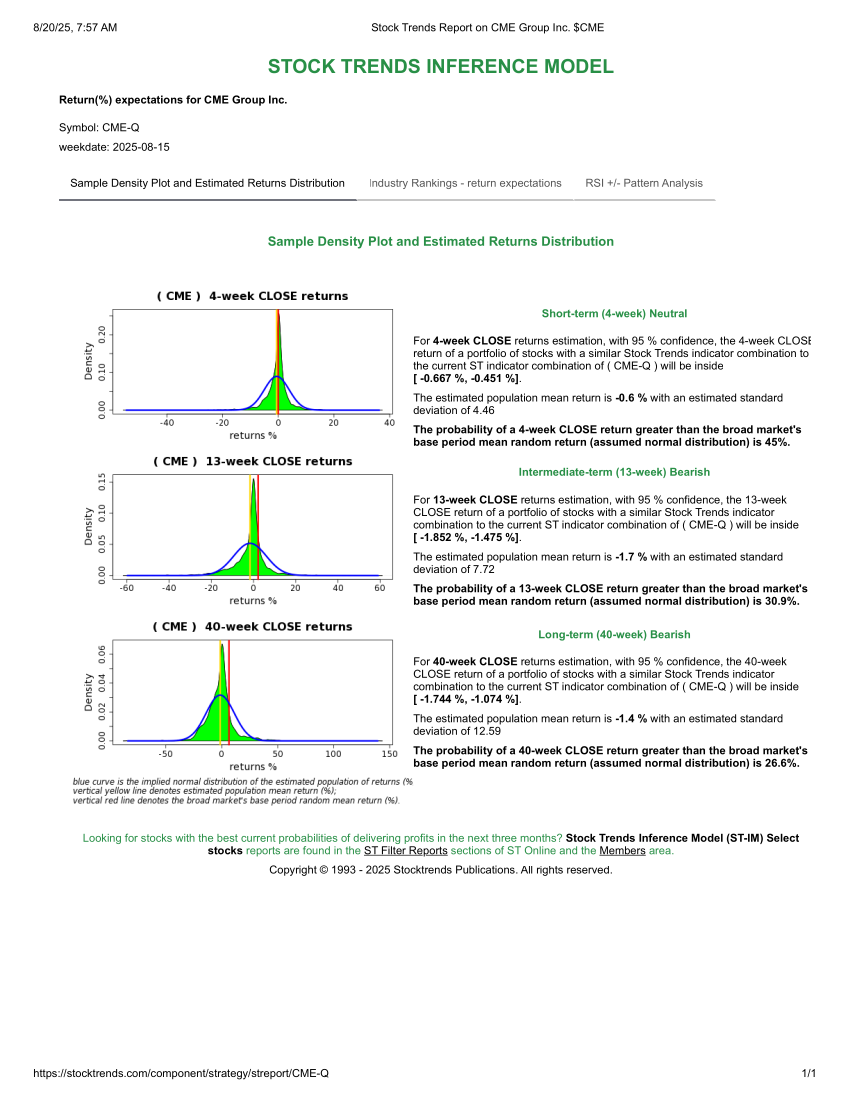
- 13-week and 40-week ST-IM estimates: Both negative
- Liquidity screen: Traded Value (price × volume × 100) > $1,000,000
This stringent filter isolates a group of common stocks with maturing bullish trends and increasingly negative forward outlooks — a cautionary signal for trend-following investors who may otherwise overlook deteriorating conditions beneath the surface.
Filter Results: At-Risk Bullish Stocks
The following stocks meet all criteria and warrant closer monitoring by trend investors. These are not yet in a confirmed reversal, but their technical and forecast profile suggests the bullish thesis may be fading.
Note: The ST-IM 13-week and 40-week forward return estimates are available for individual stocks under the Trend Profile (subscribers only) of the stock's Stock Trends Report page, which is linked to for each stock below. See Stock Trends Inference Model.
| Symbol (link to ST Report) | Company | Trend | Trend Age (weeks) | RSI | ST-IM 13wk | ST-IM 40wk |
|---|---|---|---|---|---|---|
| AEE | Ameren Corporation | 55 | 95 | -0.719016 | -3.168359 | |
| GB | Global Blue Group Holding AG | 63 | 93 | -2.155909 | -3.119952 | |
| KT | KT Corporation | 56 | 98 | -1.026767 | -2.422343 | |
| OCFT | OneConnect Financial Technology Co. Ltd. | 41 | 95 | -1.750701 | -0.903864 | |
| TXNM | Texas New Mexico Power LLC | 53 | 99 | -0.141218 | -1.257373 | |
| UGI | UGI Corporation | 46 | 92 | -1.904909 | -1.606464 | |
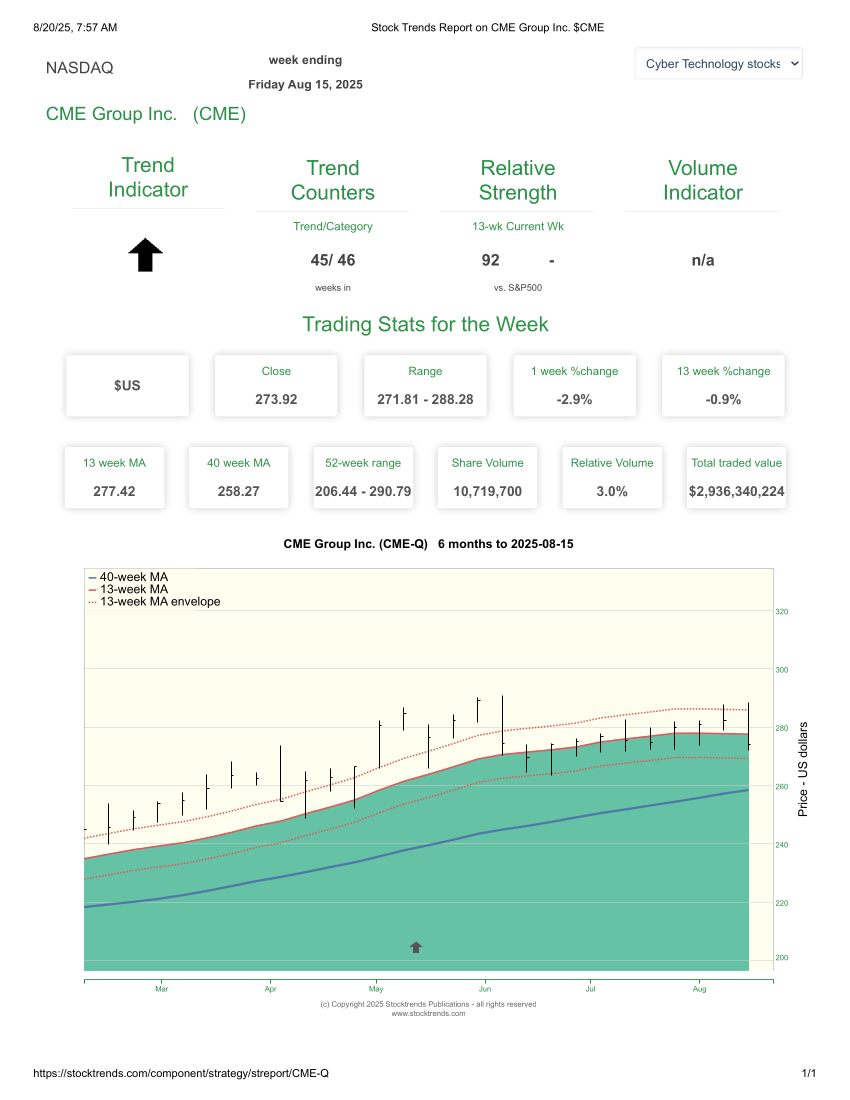
| CME | CME Group Inc. | 46 | 92 | -1.663907 | -1.408775 | |
| DUOT | Duos Technologies Group Inc. | 40 | 72 | -1.178355 | -7.795327 | |
| EBMT | Eagle Bancorp Montana Inc. | 56 | 87 | -3.744828 | -0.858228 | |
| OPOF | Old Point Financial Corporation | 51 | 96 | -1.212694 | -2.988526 | |
| OPRT | Oportun Financial Corporation | 37 | 83 | -0.359091 | -0.929073 | |
| OVBC | Ohio Valley Banc Corp. | 46 | 90 | -0.807006 | -1.547368 | |
| PLMR | Palomar Holdings Inc. | 89 | 70 | -0.170455 | -7.210714 | |
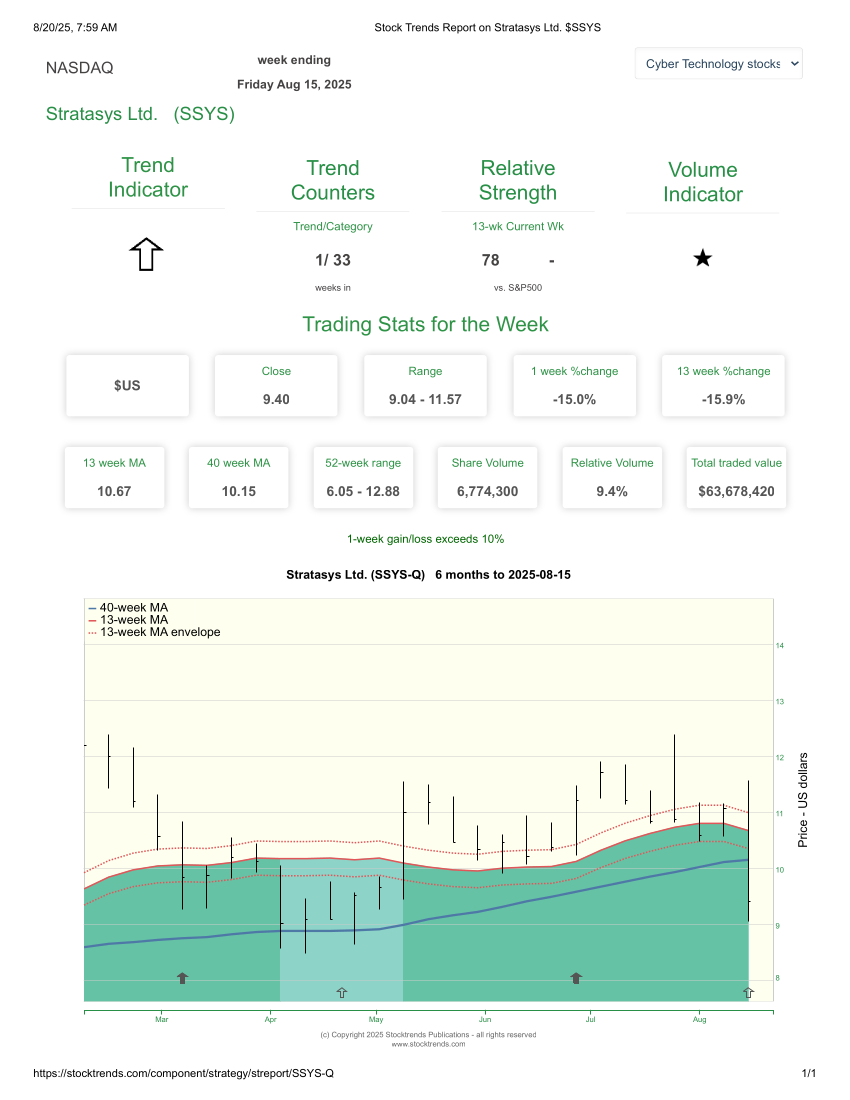
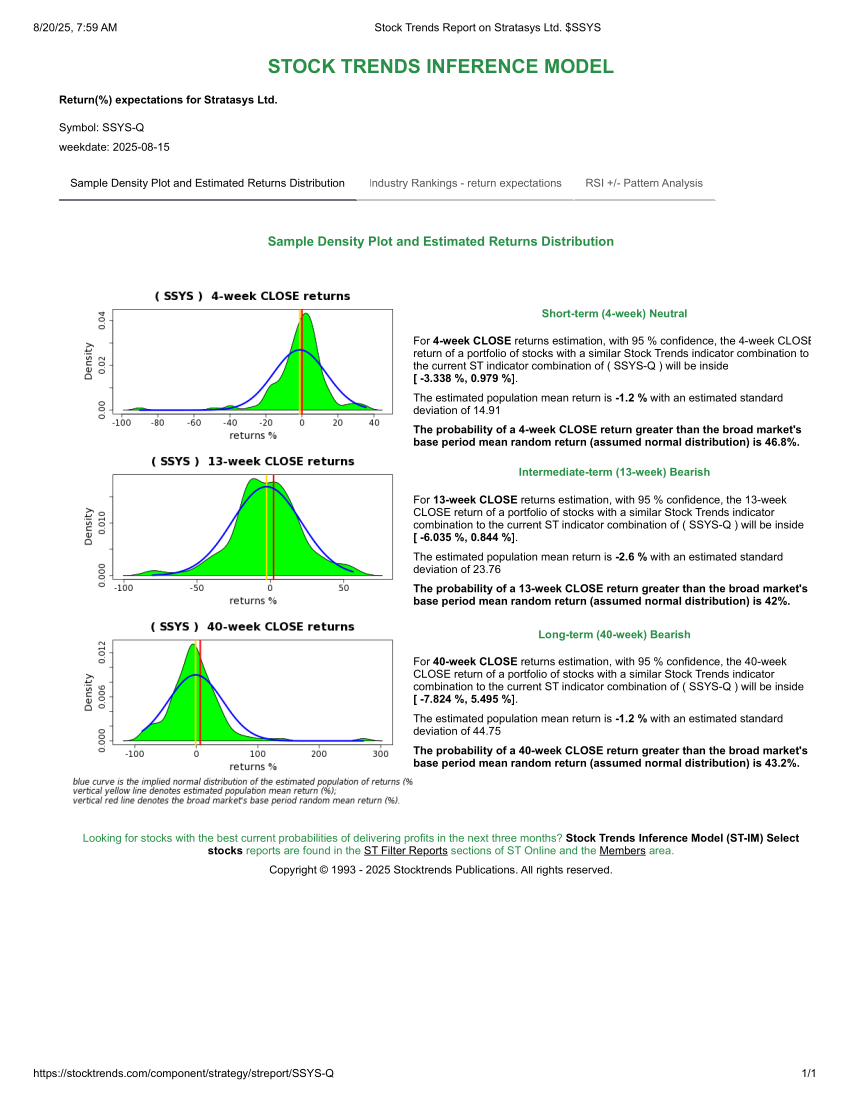
| SSYS | Stratasys Ltd. | 33 | 78 | -2.595420 | -1.164516 | |
| TGTX | TG Therapeutics Inc. | 79 | 75 | -0.076364 | -3.434615 | |
| BLN | Blackline Safety Corp. | 128 | 78 | -0.468000 | -2.319565 | |
| CIX | CI Financial Corp. | 50 | 95 | -0.827121 | -2.229134 |
Each of the stocks listed above presents characteristics that may lead to future classification as Bearish, particularly as earnings revisions, macroeconomic conditions, and technical momentum deteriorate. The extended age of their bullish trend may signal exhaustion — particularly where the Stock Trends Inference Model (ST-IM) projects negative expected returns over both 13-week and 40-week horizons.
Two At-Risk stocks
CME maintains a Bullish trend with a mature trend age (over 40 weeks), yet both its 13-week and 40-week ST-IM return forecasts are negative—highlighting latent fragility despite outward strength. This technical warning comes amid a backdrop of macro uncertainty: recent producer-price index data surprised on the upside, dampening expectations for imminent rate cuts and sparking rotation away from rate-sensitive exchanges. While Q2 earnings beat expectations, reporting $1.7 billion in revenue, EPS of $2.96, and record futures volumes. Investors should watch whether weakening rate sentiment undercuts CME’s near-term momentum, despite its strong fundamentals.
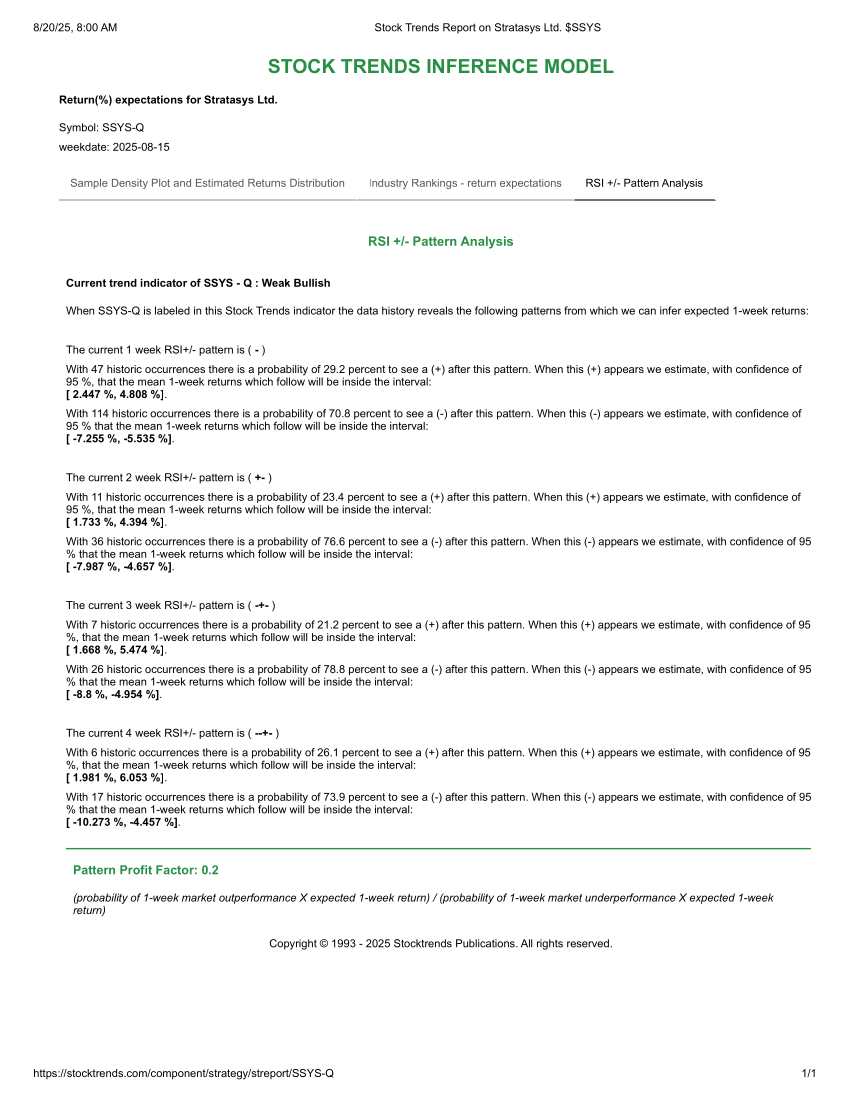
Stratasys is flagged as a newly Weak Bullish trend but flags elevated risk: its 13-week and 40-week projections are negative, and its RSI remains weak, suggesting limited upside. This technical signal aligns with recent earnings that, while showing a nudged Q2 revenue beat ($138.1M) and improved margins, included a lowered full-year guidance and mixed margins, triggering last week's 15% price sell-off on high volume (![]() ). Despite efforts to stabilize, including launching GrabCAD Print Pro™ 2025 to streamline additive workflows, Stratasys sits precariously between profitability gains and slowing demand in the broader 3D printing sector. As such, prolonged negative model projections signal caution for trend followers. Additionally, the Stock Trends RSI +/- Pattern Analysis for SSYS shows a low Pattern Profit Factor and a high probability of underperformance in the week ahead.
). Despite efforts to stabilize, including launching GrabCAD Print Pro™ 2025 to streamline additive workflows, Stratasys sits precariously between profitability gains and slowing demand in the broader 3D printing sector. As such, prolonged negative model projections signal caution for trend followers. Additionally, the Stock Trends RSI +/- Pattern Analysis for SSYS shows a low Pattern Profit Factor and a high probability of underperformance in the week ahead.
Sectoral Context
While the broader sector breadth analysis from our previous article pointed to strength in areas like Consumer Discretionary and Financials, this filtered universe cuts across sectors — revealing vulnerabilities even within seemingly strong industries. In particular, some Financial Services and Consumer Cyclical stocks appear prominently in this filtered group.
This is reflective of the mixed macro signals currently influencing market sentiment. August inflation prints and renewed uncertainty over the U.S. Federal Reserve’s rate trajectory have cast a shadow over growth-sensitive sectors. Long-dated treasury yields remain elevated, dampening valuations and increasing refinancing risk — especially for firms with deteriorating balance sheet momentum.
What Stock Trends Users Can Do
Investors using the Stock Trends Weekly Reporter can replicate this type of risk filtering by applying a multi-layered approach across:
- Trend Signal & Age: Use the Trend Age field (Trend Category counter) to identify mature or extended uptrends.
- Volume & Liquidity: Cross-filter to ensure focus on tradable names.
- Model Risk Assessment: Use the ST-IM forward return estimates (4-week, 13-week, and 40-week) to assess the trend’s probabilistic sustainability.
- Industry & Sector Heatmaps: Pair with breadth views to identify divergence between strong sectors and weak constituents.
This type of analysis, empowered by the full Stock Trends dataset, ensures subscribers can proactively manage risk — not just chase upside. Staying vigilant for reversal signs within maturing trends is a hallmark of successful technical investing.
Related items
- War, Inflation, and Rotation: What Stock Trends Reveals After the Middle East Shock
- Stock Trends Mid-Quarter Review: How the Year-End 2025 Themes Are Performing in Q1 2026
- Stock Trends Year-End Analysis: Institutional Momentum, ST-IM Alpha, and the Road Into Q1 2026
- Understanding Our Assumptions — A Decade Later
- Trading Nvidia with the Stock Trends RSI +/– Pattern Analysis Model
 I am just writing to tell you of my appreciation of your service! It makes so much sense to me. You seem to be an oasis of stability and sensibility in a stockmarket jungle.


