Each week, Stock Trends Weekly Reporter (STWR) subscribers are presented with a valuable array of technical and statistical filter reports—highlighting stocks demonstrating defined trend behavior, volume signals, and momentum dynamics. While these filters help narrow the list of potential opportunities, what follows after identifying a candidate stock is equally important. For the disciplined investor, recognizing a promising technical signal must be followed by structured decision-making. That’s where a Stock Trends Decision Tree Framework comes in.
This article provides a structured approach for Stock Trends subscribers to move from filter report selection to trade execution, using the robust Stock Trends indicator framework, Inference Model, RSI+/- pattern analysis, and market context provided by Stock Trends Trend Distributions and Causal AI Epoch assessments. We demonstrate this process using two real-time examples from the current week’s reports: Riot Platforms Inc. (RIOT-Q) from the STIM Select Stocks report, and Costco Wholesale Corporation (COST-Q) from the Newly Weak Bullish Report.
Stage 1: Screening with the STWR Filter Reports
The Stock Trends Filter Listings are the initial decision point in the framework. These reports isolate securities based on defined technical behavior, whether it’s a change in trend classification, volume signal confirmation, or momentum strength. The STIM Select Stocks filter, for example, uses the Stock Trends Inference Model to screen for stocks whose expected returns in all three forecast horizons (4-week, 13-week, 40-week) exceed market base period averages, and whose probability of outperformance is statistically significant. By contrast, the Newly Weak Bullish Report alerts subscribers to trend deterioration in stocks that have been in a bullish posture but now show weakness.
Stage 2: Trend Indicator Assessment and Volume Alignment
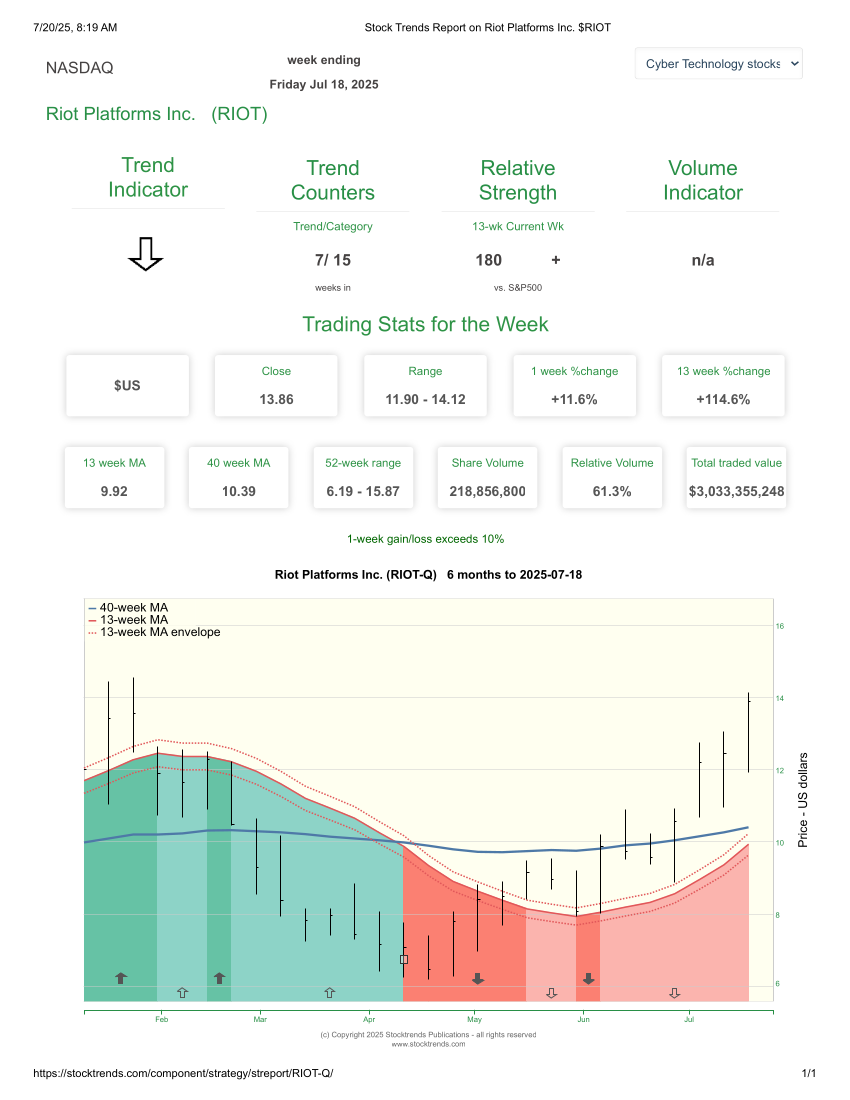
After identifying a stock through a filter report, users should evaluate the current Stock Trends trend indicator and trend counters. The quality and age of a trend, whether Bullish, Bearish, or Neutral, can suggest whether a stock is entering, maintaining, or exiting a defined market phase. Users should also compare this information to the 13-week and 40-week moving averages and the volume indicator, when available, to validate trend momentum.
In the case of RIOT-Q, the stock is currently labeled Weak Bearish (![]() ), but is trading above the upper boundary of the 13-week moving average envelope—a technical condition often preceding a Bullish Crossover (
), but is trading above the upper boundary of the 13-week moving average envelope—a technical condition often preceding a Bullish Crossover (![]() ). For COST-Q, the label has been downgraded to Weak Bullish (
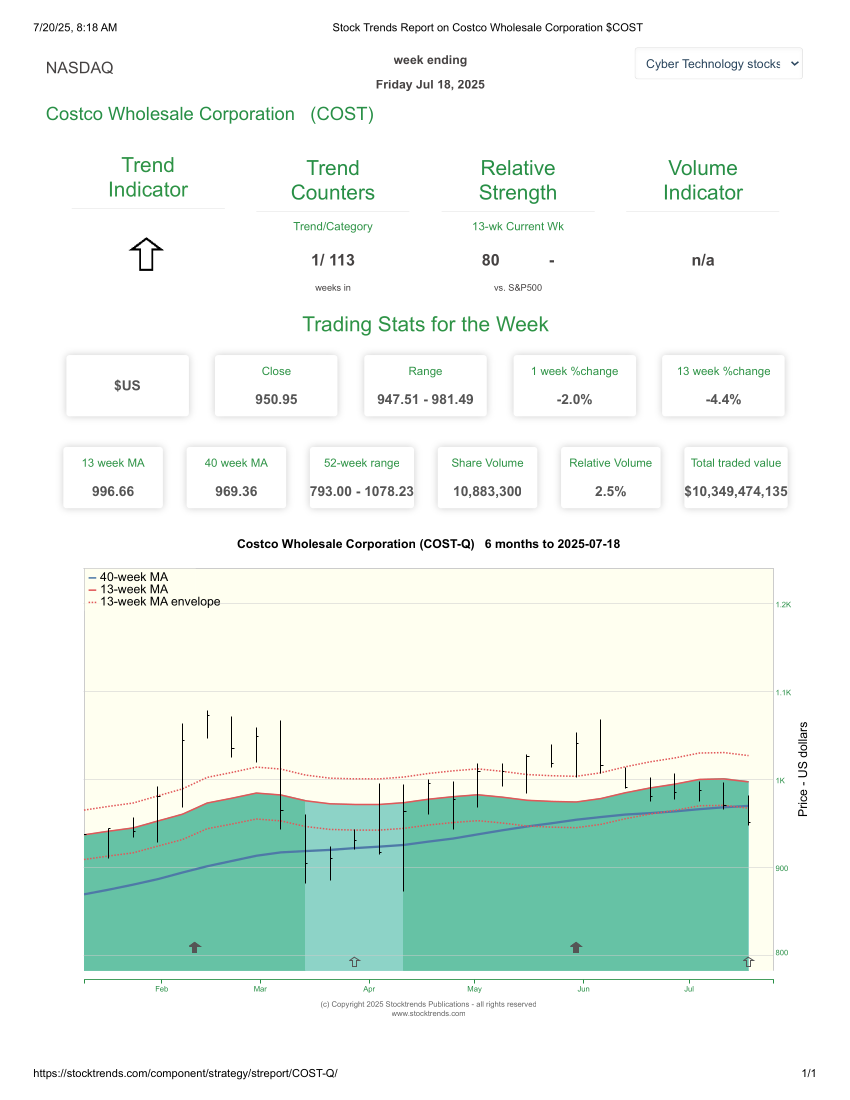
). For COST-Q, the label has been downgraded to Weak Bullish (![]() ), with the stock trading below its 13-week average envelope, a signal of fading trend strength and potential reversal.
), with the stock trading below its 13-week average envelope, a signal of fading trend strength and potential reversal.
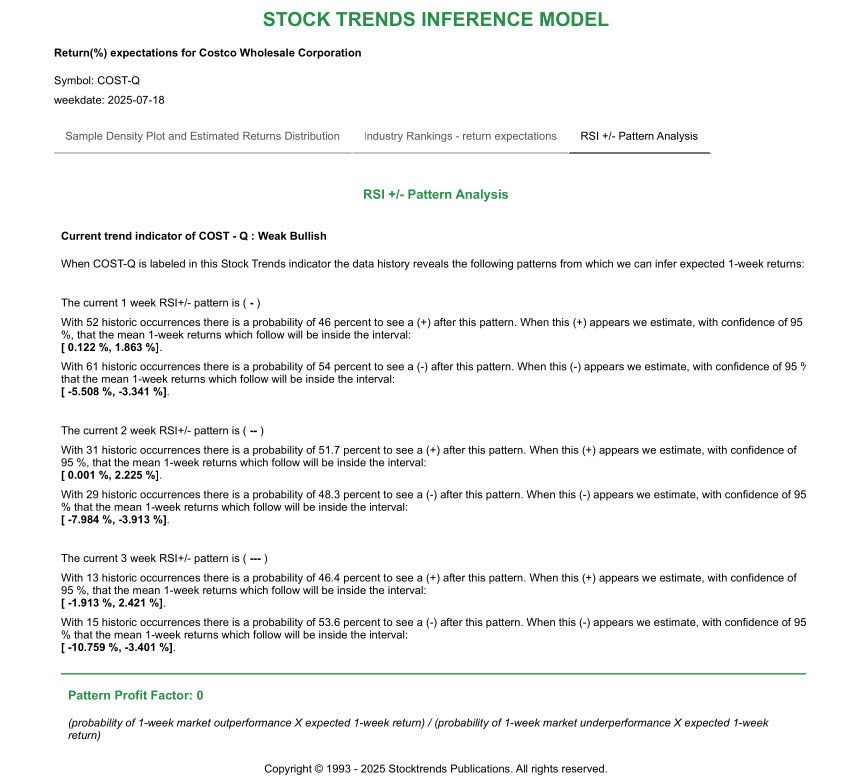
Stage 3: RSI +/- Pattern Analysis
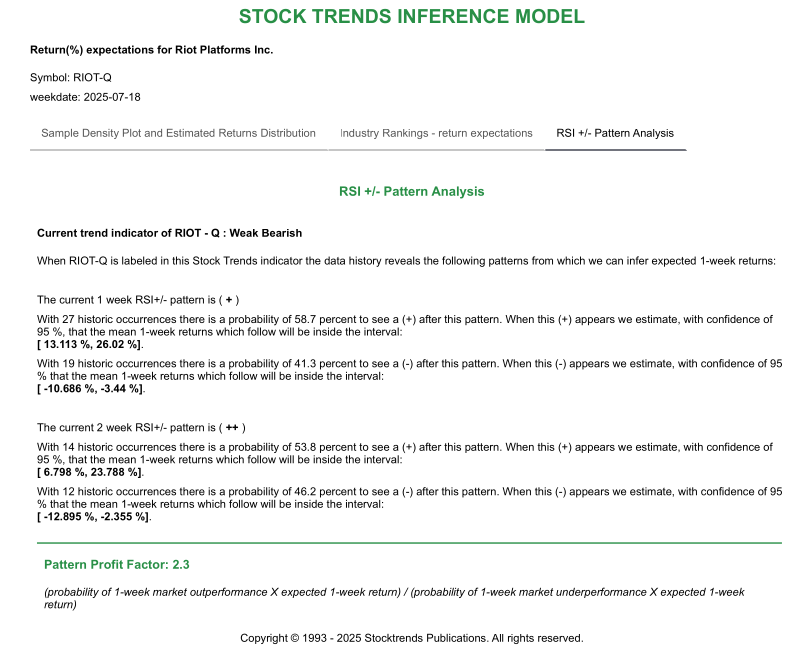
The RSI +/- Pattern Model provides short-term probabilistic insight into future returns. It analyzes weekly sequences of relative strength (+ for outperforming the S&P 500, − for underperforming) and estimates the probability and magnitude of next-week outperformance or underperformance.
For RIOT-Q, the current pattern of (++), backed by a Pattern Profit Factor of 2.3, indicates a favorable risk-reward profile: a 53.8% probability of outperformance and potential returns exceeding 13% in the following week. For COST-Q, the RSI +/- pattern (---) signals deterioration, with a Profit Factor of 0 and a higher probability of continued underperformance.
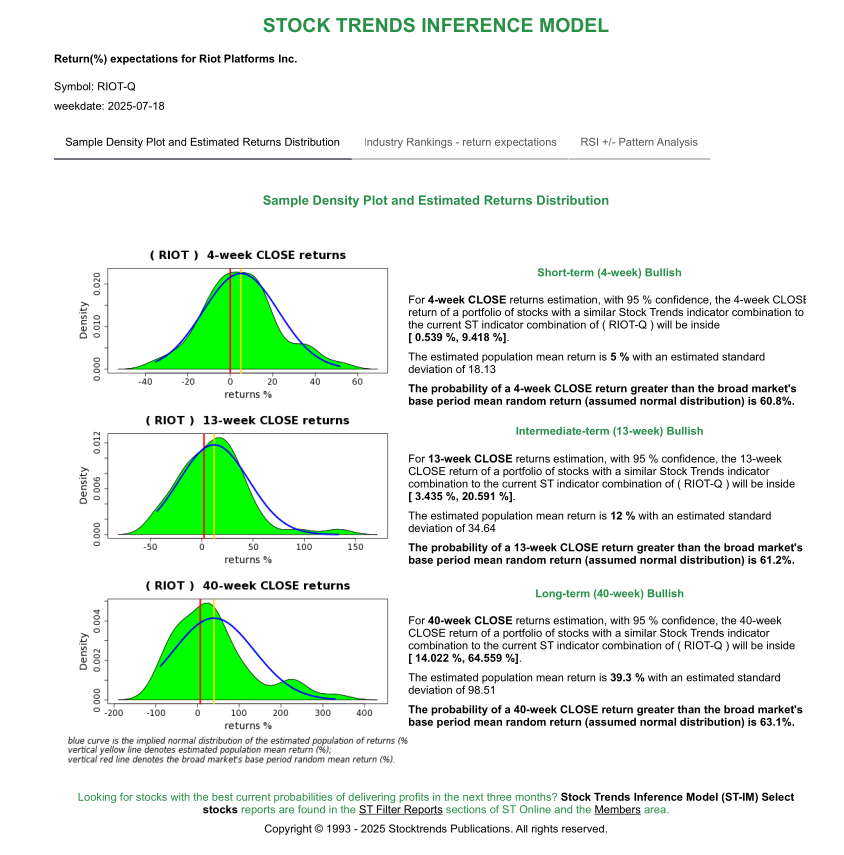
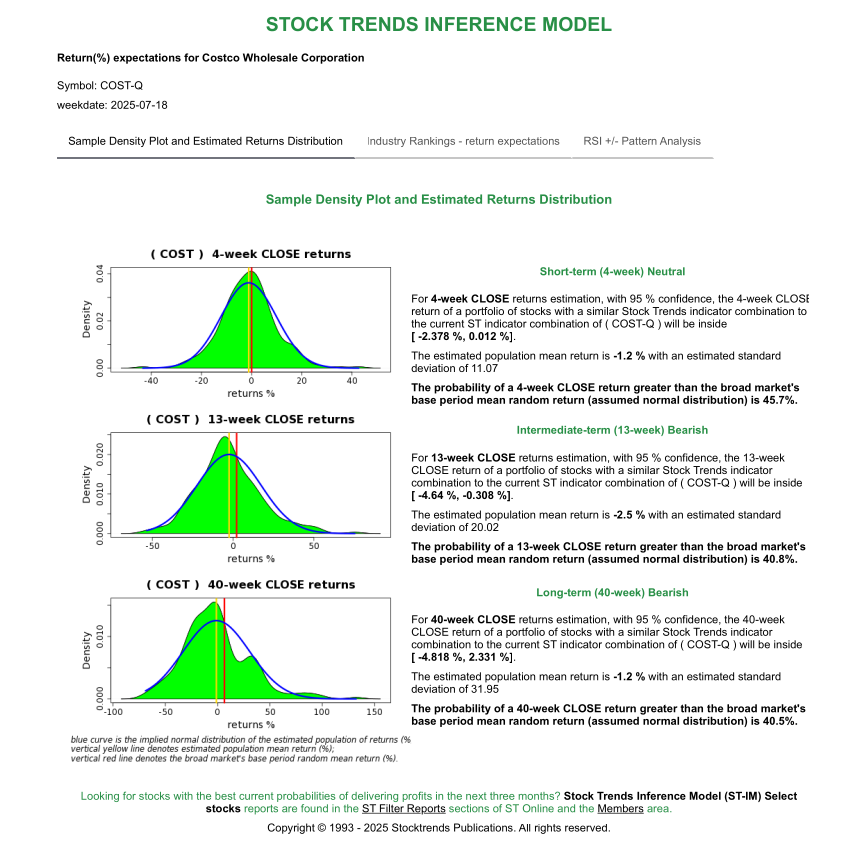
Stage 4: Inference Model Forecasting
The Stock Trends Inference Model estimates returns over 4-, 13-, and 40-week horizons, drawn from historical portfolios sharing the same indicator profile. This model incorporates confidence intervals, expected mean returns, and probability of outperformance against a market base benchmark.
Here’s how the two examples compare:
| Horizon | RIOT-Q | COST-Q |
|---|---|---|
| 4-week | Mean: +5.0%, CI: [0.54%, 9.42%] | Mean: –1.2%, CI: [–2.38%, 0.01%] |
| 13-week | Mean: +12.0%, CI: [3.43%, 20.59%] | Mean: –2.5%, CI: [–4.64%, –0.31%] |
| 40-week | Mean: +39.3%, CI: [14.02%, 64.56%] | Mean: –1.2%, CI: [–4.82%, 2.33%] |
| Prob > Market | 60.8%, 61.2%, 63.1% | 45.7%, 40.8%, 40.5% |
RIOT-Q demonstrates a statistically meaningful opportunity across all timeframes. In contrast, COST-Q signals negative drift and low probability of beating the market in any horizon—an important consideration for long-term investors.
Stage 5: Market Context – Trend Distribution and Causal AI Epochs
Stock Trends’ aggregate Trend Distribution Reports and Causal AI Epoch analysis provide critical context. For example, a rising count of Weak Bearish indicators or Bullish Crossovers across the market often signals a trend transition epoch. Causal AI models, which analyze the broader behavior of trend classifications across sectors, may indicate whether capital is rotating into risk assets or defensive stocks.
In this week’s update, Causal AI places the market in a Rotation or Early Bull Epoch, favoring high-beta and speculative sectors—such as crypto and technology. This supports the opportunity in RIOT-Q, a blockchain infrastructure stock, and casts further doubt on the current outlook for COST-Q, a defensive consumer stock underperforming in a shifting macro environment.
Stage 6: Trading Action – Execute or Exit
At this stage, the investor must make a decision. The following comparison illustrates how the decision tree plays out in this week’s two examples:
| Element | RIOT-Q | COST-Q |
|---|---|---|
| Filter Screen | STIM Select Stocks | Newly Weak Bullish |
| Trend Indicator | Weak Bearish (Bullish Crossover alert) | Weak Bullish (Bearish Crossover warning) |
| RSI Pattern / Profit Factor | (++), Profit Factor = 2.3 | (---), Profit Factor = 0 |
| Inference Model | Bullish all timeframes, 60–63% outperformance | Bearish/Neutral, <46% outperformance |
| Sector/Epoch Alignment | Crypto in Early Bull Epoch | Defensive laggard in rotation cycle |
| Action | Enter risk-managed long | Exit or avoid |
This disciplined framework allows investors to incorporate Stock Trends indicators, momentum analysis, and contextual insight to make consistent and evidence-based decisions.
A Disciplined Roadmap from Insight to Execution
The Stock Trends Decision Tree Framework empowers subscribers to translate data into action—screening with purpose, evaluating with structure, and executing with discipline. By combining the filter reports, trend classifications, RSI +/- pattern probabilities, multi-period return forecasts, and macro context from Causal AI, investors gain a toolkit not just for choosing stocks—but for managing them actively through changing market conditions.
As this week’s case studies of RIOT-Q and COST-Q demonstrate, the clarity of action that this framework provides—whether entering high-reward trades or stepping aside to protect capital—helps reinforce Stock Trends’ mission to promote strategic, trend-informed investing.
Related items
- TJX at New Highs — A Case Study in Long-Run Trend Persistence and Momentum Rotation
- Stock Trends Gauge of Investor Sentiment: A Market at the Crossroads of Renewal
- Stocks Highlighted in Fall 2025 Trends
- Stock Trends: The Human Side of Market Trends
- Money management and trading psychology: building a resilient trading plan that integrates with the Stock Trends decision-tree framework
 I want to thank you for posting such an excellent guide to technical analysis on the web. You have provided a great service to all of us novice investors.


