The Stock Trends Gauge of Investor Sentiment has long served as a vital compass for interpreting the emotional currents that drive markets. By measuring the distribution of Bullish and Bearish Stock Trends indicators across all New York Stock Exchange issues, this gauge transforms the abstract notion of “market mood” into a quantifiable, observable pattern of investor behavior. Over the past two decades, it has proven to be an uncanny mirror of investor psychology — revealing when fear gives way to opportunity, and when euphoria conceals risk.
A Two-Decade Reflection of Market Psychology
The most recent 20-year sweep of this indicator offers a remarkable chronicle of market history. From the depths of the 2008–2009 financial crisis to the speculative heights of 2021 and the recovery now emerging in 2025, the alternating dominance of red (Bearish) and green (Bullish) areas on the Stock Trends chart maps a psychological landscape every bit as important as the economic one. The NYSE Bulls vs. Bears 20-year graph reveals the aggregate trend insight below.
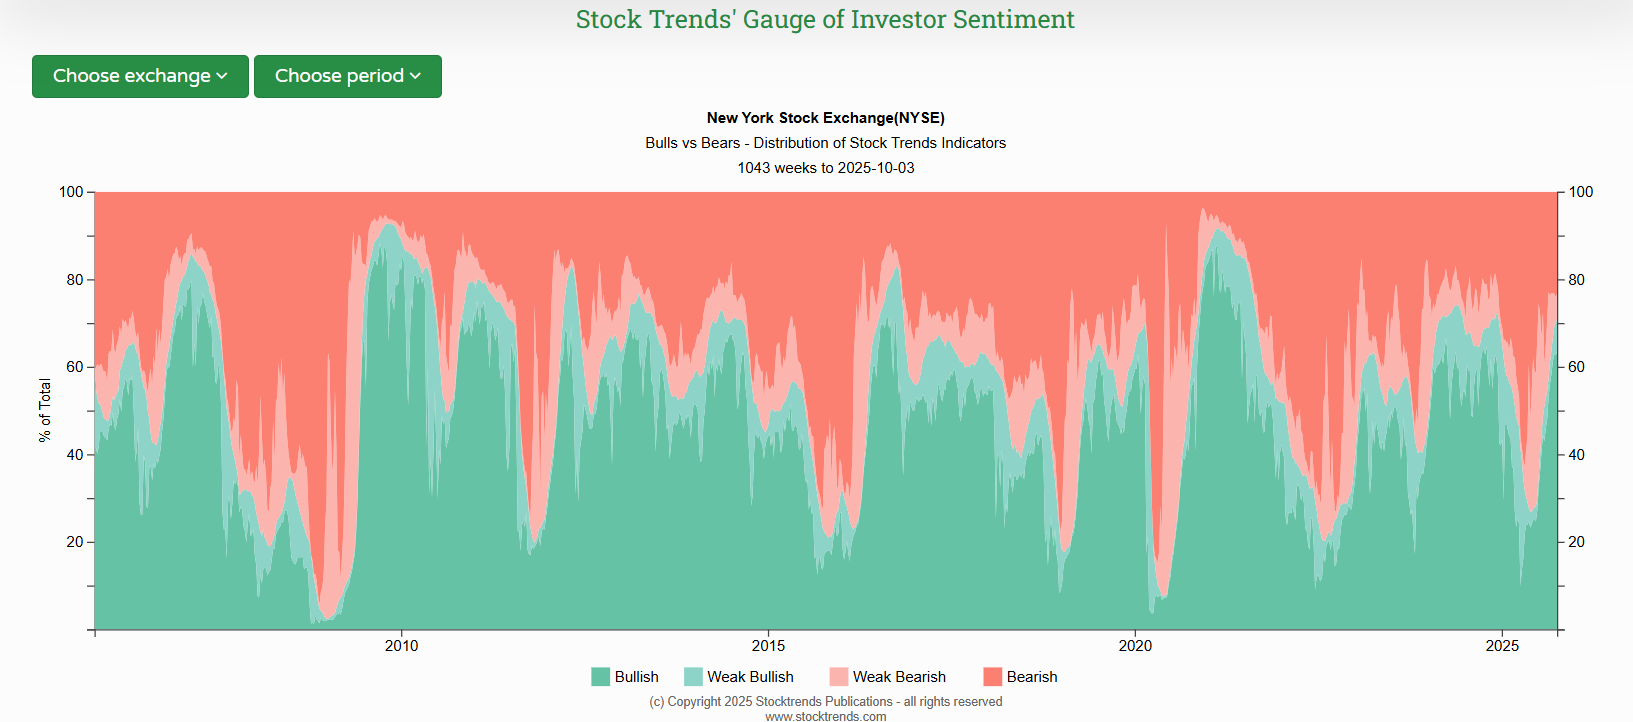
When nearly all stocks across the NYSE sank into Bearish or Weak Bearish classifications during the 2008 collapse, the indicator reached an extreme rarely seen — a visual manifestation of panic and capitulation. That red tide subsided through 2009 as investor confidence cautiously returned, marking the inception of a decade-long bull market. The story repeated itself in miniature through the Eurozone crisis of 2011, the oil crash of 2016, and again during the pandemic shock of 2020. Each surge of red in the gauge coincided with despair, and each contraction of red — the gradual reappearance of green — signaled the birth of a new advance.
In contrast, the years of exuberant green tell their own cautionary tales. Periods when Bullish sentiment exceeded 80 percent of all NYSE stocks — such as 2014 and 2021 — corresponded closely with overextended optimism and subsequent market peaks. In those phases, investors had largely exhausted the supply of new buyers; there was little room for breadth to expand further. History’s verdict is clear: when nearly everyone is Bullish, the potential for disappointment grows.
| Period | Sentiment Reading | Market Event | Sentiment Implication | Market Outcome |
|---|---|---|---|---|
| Late 2007 – Early 2009 | Bearish > 85%, Bullish < 10% | Global Financial Crisis bottoming | Panic and capitulation; nearly all NYSE stocks bearish | Major bottom (March 2009); start of decade-long bull market |
| 2010 – 2011 | Bullish rising > 70% → sharp reversal | 2011 Eurozone & U.S. debt crisis | Sentiment collapsed amid global fears | Short-lived bear market; recovery began late 2011 |
| 2013 – Mid 2014 | Bullish > 80%, Weak Bearish minimal | S&P benchmark 1,550 → 2,000 | Mature phase of 2010s bull; market paused in 2015 | |
| 2015 – Early 2016 | Bearish ~75–80% | China devaluation & oil crash | Sentiment pessimistic, breadth collapse | Bottom Feb 2016 → renewed bull trend |
| 2018 Q4 | Bearish surge > 70% | Fed tightening & trade war sell-off | Fear spike, sentiment washed-out | Sharp bottom Dec 2018; new rally through 2019 |
| Early 2020 | Near 100% Bearish | COVID crash | Maximum fear and liquidation | Fastest reversal in history → massive bull 2020-21 |
| Late 2021 | Bullish ~90%, Weak Bearish minimal | Post-pandemic euphoria | Euphoria phase – excess liquidity and breadth saturation | Preceded 2022 bear market |
| 2022 – 2023 | Bearish ~80%, Bullish < 20% | Inflation & rate shock | Broad pessimism and valuation compression | Bottom Oct 2022 → 2023 recovery |
| Mid 2024 – 2025 | Bullish recovering to ~60–65% | Early-cycle upswing | Gradual re-accumulation; cautious optimism | Suggests new bull phase with room to expand |
The Gauge as a Contrarian Indicator
Stock Trends’ framework of trend analysis is grounded in the principle that the market’s aggregate state reflects both price and psychology. The Gauge of Investor Sentiment embodies that philosophy. It serves not as a momentum indicator, but as a contrarian signal of cyclical extremes — the moments when collective perception diverges most from underlying value.
When Bearish classifications dominate more than 80 percent of issues, the crowd has already acted on its pessimism. At such extremes, the odds favor contrarian accumulation, not liquidation. Conversely, when Bullish indicators encompass a similar majority, the market often enters a stage of complacent overconfidence. In both cases, the turning point is less about valuation than emotion — the pendulum of sentiment swinging beyond reason.
This pattern has persisted with remarkable consistency. In 2009, 2016, 2020, and 2022, the Stock Trends Gauge of Investor Sentiment turned from deep Bearish saturation to gradual green expansion — each time preceding a powerful market recovery. Likewise, the euphoric dominance of green in late 2021 foreshadowed the sharp reversion of 2022’s inflation-induced correction.
2025: Recovery in Progress
Today, the Gauge reveals a market in mid-transition — neither euphoric nor fearful, but cautiously constructive. The proportion of Bullish and Weak Bullish trends has expanded from the 2022–2023 Bearish lows, yet remains below the levels that historically accompany market tops. This balance reflects a market still rebuilding conviction, digesting the policy shocks and valuation resets of recent years.
In behavioral terms, it is the phase of disbelief — when investors remain hesitant to trust the rally, even as underlying participation broadens. Historically, this has been the most fertile stage of a new bull cycle. As breadth improves and new leadership emerges across sectors, the foundation for a sustainable advance is laid not in optimism, but in skepticism.
Lessons in Market Sentiment
The enduring message of the Stock Trends Gauge is that markets are not governed solely by earnings, interest rates, or policy decisions. They are shaped by the aggregate emotional responses to those forces — fear, greed, confidence, doubt — reflected daily in the trends of thousands of individual securities.
By quantifying those responses, the Gauge gives investors a crucial edge. It teaches that bottoms are born in pessimism, not clarity, and that tops are crowned by comfort, not caution. For long-term investors guided by Stock Trends methodology, this insight remains essential: sentiment extremes are not the enemy — they are opportunity’s advance warning.
How Investors Can Use the Gauge
- Track extremes, not headlines. Bearish shares above ~80% historically align with durable lows within weeks to months.
- Fade euphoria. Bullish shares sustained above ~80% warn of late-cycle risk and thinner upside.
- Respect breadth transitions. Crossovers and persistent expansions in green indicate improving participation and healthier uptrends.
- Weak Bullish and Weak Bearish surges. A spike in the percentage of Weak Bullish stocks warns of a market top. A rise in the percentage of Weak Bearish stocks alerts of a market bottom.
Markets turn when sentiment exhausts, not when the news flow turns rosy. The Stock Trends Gauge gives investors a disciplined lens on that process — a breadth-based translation of crowd emotion into objective signals. In 2025, it argues for measured optimism: the crowd isn’t convinced yet, and that is often where opportunity begins.
Conclusion
The market of 2025 stands at a delicate but promising juncture. The scars of the 2022–2023 downturn have yet to fully fade, but beneath the surface, strength is building. The Stock Trends Gauge of Investor Sentiment — that quiet barometer of collective mood — suggests that this is not the time to look backward in fear, but forward with disciplined optimism.
For those who understand that markets turn not when the news improves, but when sentiment exhausts its pessimism, the signal is clear: the crowd is still uncertain, and that, as always, is where opportunity begins.
Methodology: The Gauge aggregates weekly Stock Trends classifications (Bullish, Weak Bullish, Weak Bearish, Bearish) across NYSE constituents (stocks only, not ETFs). Proportions are computed as a share of the investable universe each week, forming a market-wide breadth profile of trend states. For individual issues, consult the Stock Trends Strategy Summaries (NYSE) and security-level Stock Trends Reports. The Nasdaq, NYSE American, and TSX Summaries are also featured weekly.
 Stock Trends information is part of the base information I review before making a trade.