Random Portfolio benchmarks

  • 03 September 2018 |
  • Written by  Skot Kortje, Stock Trends Analyst
  • font size
  • Print

The S&P 500 index is a size factor-based index that is not a good benchmark for measuring alpha (market intelligence). Naive portfolios generated by random sampling provide a better alpha benchmark.

The growth of passive investing has a lot to do with investors migrating to lower cost investment vehicles, but implicit in the migration to passive frameworks is a presumably lower risk metric. Investors want to be exposed to equities but don’t want to take risks beyond those inherent in the benchmark indexes they are investing in. Additionally, index investors are opting out of the risks of active management because the returns generated have recently not kept pace with the index benchmarks. But indexes are not what investors should be using as benchmarks. They don’t represent a truly passive approach to the market. The only truly passive approach to the markets is one that employs random portfolio construction.

Why random portfolios? Because all indexes are systematically biased by their factor premises. The prevalent index factor is size (market capitalization) but other factor frameworks include sector, industry, value, growth, momentum, and smart beta. Each of these index frameworks employs a systematic weighting of components based on predetermined valuation that aims to minimize variability of returns based on defined factors.

Take a look at the S&P 500 index. It’s the most traded index in the world - through ETFs like SPY - but more importantly is the primary benchmark for U.S. equities. The performance S&P 500 index guides investors in terms of relative performance of actively managed funds and ultimately is the most broadly used compensation metric of the asset management industry. The fees investors pay these managers and, ultimately, the employment, compensation and rewards these fees fuel depend on the structure of the index.

The S&P 500 index is first and foremost a members club. Stocks are included in the index by decision of a committee. Yes, constituent stocks must meet certain primary criteria - market capitalization (float adjusted weightings), liquidity, domicile, public float, sector classification, financial viability, and length of time publicly traded and stock exchange - but the criteria is set by a member board. And it’s set with a certain purpose in mind: the index is a gauge of large cap U.S. equities.

So we know that the SPX is a factor-based measure of U.S. equities - it tells us about the price movement of large-cap stocks. That should surprise few people. Implicit in this size factor is the fact that the SPX accounts for about 80% of the entire capitalization of the U.S. stock market. That’s a good chunk of the assets invested in this market.

However, the size factor weighting of the SPX is problematic when it comes to fulfilling the index’s role as a benchmark. The size bias distorts the benchmark performance and concentrates on the largest companies, often adding additional risk in those constituents because many are in the same sector or industry. In fact, the current weighting of the SPX shows that about 28% of the index weighting is in technology stocks. Further, the top 4 stocks by weight in the index are Apple, Microsoft, Amazon, and Facebook. The S&P 500 index has a decidedly tech bias at this time, a considerable sector risk for a benchmark index that is ostensibly supposed to track the overall performance of U.S. equities.

That may be a reasonably correct weighting of big cap U.S. equities, however it’s not a correct benchmark measure of alpha. Alpha is the intelligence that extracts investment returns above the market performance. A portfolio of stocks constructed with a size bias only tells us about the performance of the bias. It does not represent the performance of a naive portfolio - a portfolio of stocks that has no factor bias. A naive portfolio would not have a selection criteria that restricts to a subset of a given universe of stocks. It would be a portfolio derived from a set of randomly selected stocks.

Random portfolio returns give us an estimate of the returns that are built into the broad market. Irrespective of factors that deliver alpha, a measure of random portfolio returns tells us the returns a given market generates without having any specific intelligence about how to generate those returns. They are the returns that would be generated by an untrained monkey.

What have been the random portfolio returns of the U.S. equity market? How do they compare to the returns of the S&P 500 index? Below is an annual comparison of 52-week returns (%) of the market cap index and the mean (average) return (%) of randomly selected portfolios. The last column shows the differences in returns (%) between the market cap index (SPX) and the random portfolios.

The random portfolio returns are the mean return (%) of 1,000 randomly selected portfolios of 100 common stocks selected at the beginning of the return period. That would be equivalent to 1,000 different monkeys picking a 100 stock portfolio, then taking the average return of those 1,000 portfolios after the 52-week period. The universe of stocks from which these random portfolios are selected includes all NYSE/Nasdaq listed common stocks that have traded for at least 40-weeks trading at a price above $2 and weekly trading volume above 100,000 shares. That would be a universe of about 3,900 stocks.


Annual returns (%) - SPX and random portfolios


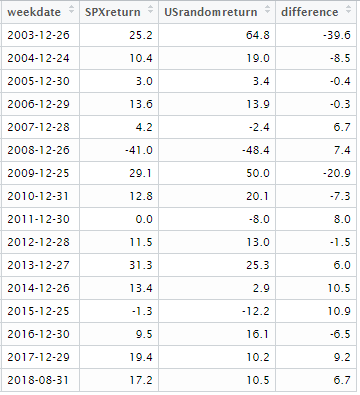
This summary tells us that the S&P 500 index has only out-performed the random portfolios in 7 of the last 15 years (2003-2017) and that the sum of the differences in return is -26.3%. The monkey would have outperformed the S&P 500 index over the period by a significant amount. However, we can also see that much of this outperformance comes in 2003 and 2009, both years where the overall market enjoyed exceptional returns after a bear market. Clearly, those were periods where the size bias of the S&P 500 index excluded it from returns that were delivered elsewhere in the market (small cap stocks, growth stocks, momentum stocks, etc.).

Presently, the S&P 500 index is providing excess returns above the benchmark represented by random portfolios. On the surface that tells us that portfolios weighted toward large cap - specifically large cap technology stocks - are outperforming the market. They will until they don’t. Investors should be aware of where their returns are coming from and where their risk is situated. The S&P 500 index is not a passive index. It is not market agnostic.

back to top

Subscriber Testimonials

  • Thank you for your excellent work and kind approach to your customers.

    Odette C., Subscriber

  • I've followed a number of Stock Trends picks, and the methodology is solid.

    Doug B., Subscriber

  • I use Stock Trends to help direct my stock picks. Also, following the advice of Stock Trends I have religiously used stop-loss orders and have avoided hanging on to losing stocks for emotional reasons.

    John B., Subscriber
  • I am fascinated with your service and methodology - it is very impressive. [...] Over the years I have concluded that there are many ways to approach stock investing, but once one has chosen a path, one is better off sticking to it.

    Bob E., Subscriber

  • I have had the good fortune to be reasonably successful and enjoy the investment process. Your process would be recommended for both experts and those who are new to investing.

    Frank I., Subscriber
  • I find your website and research very helpful in my stock trading. I have subscribed to several related services in the past and none present their work with “just the facts” as you. Please keep up the great work so that I can continue to learn! 

    Bryan E., Subscriber
  • You have created and maintained an amazing, highly educational program and I am grateful for your part in getting our retirement funds to the good place they are.

    Karin M., Subscriber
  • I very much like the systematic approach to analyzing stock data, it fits my approach.

    Subscriber
  • I am something of a momentum investor. I find Stock Trends useful as I can look at my portfolio as a “watch list” and quickly see where trends are declining in strength or reversing, so it is particularly useful as a tool in portfolio management regarding sales.

    William C., Subscriber
  • An admitted cynic, it's obviously very high praise when he says he likes StockTrends because of its "simplicity, utility, openness, [and] honesty," and in addition to having "no hidden agenda" is "understandably documented [and] historically verifiable." And, he adds, "It lets me see a lot of things without doing a lot of work." Globe and Mail

    Paul W., Subscriber

  • I've followed your recommendations since reading your columns in the Globe & Mail, and finding they published Stock Trends arrows in their financial listings. I do find them a guide to the general market and what I should be avoiding for declining chart trends.
    Has probably saved me the subscription by not rushing into hot stocks!

    Anthony D., Subscriber
  • There is a lot to be gained from comparing trends of how individual stocks are doing within a sector, as well as how the sector is performing relative to the broad market.

    Dudley R., Subscriber

  • Stock Trends information is part of the base information I review before making a trade.

    Subscriber
  • Stock Trends analysis quantifies nicely the movement of individual stocks. I’ve found that if the technicals are out of synch with fundamental analysis, it is a wake-up call to make a decision. The Stock Trends Bull/Bear Ratio is useful in identifying major market bottoms and tops. It has always presented a good buying or selling opportunity.

    Charles G., Subscriber
  • Your report is an impressive, excellent tool and I have recommmended it to friends.

    Colin E., Subscriber

  • Stock Trends Weekly Reporter is an easy way to pick up equities that represent an upward trend.

    Subscriber
  • Just thought I'd call to thank you, Skot. Stock Trends Weekly Reporter helped pay for my daughter's education!

    Peter H., Subscriber

  • Hence, anyone who had followed the "Stock Trends" line should have sold their Bre-X shares and, with the windfall, paid for a lifetime subscription to The Globe and Mail and more. Talk about return on investment!

    Muni P., Subscriber

  • I want to thank you for posting such an excellent guide to technical analysis on the web. You have provided a great service to all of us novice investors.

    Michael C., Stock Trends user
  • I am just writing to tell you of my appreciation of your service! It makes so much sense to me. You seem to be an oasis of stability and sensibility in a stockmarket jungle.

    Adrian S., Subscriber

Subscription Plans

Subscription Plans

STWR - Monthly

$19.95

Monthly subscription plan to Stock Trends Weekly Reporter - pay your monthly subscription fees by having them automatically charged (PayPal only). Free 7-day trial period. Subscribers may cancel before the end of any subscription month.

STWR - 1 Year Prepaid Subscription

$199.00

1 Year Prepaid subscription to Stock Trends Weekly Reporter. Save 16% off monthly rate!

STWR - 2 Year Prepaid Subscription

$299.00

2 Year Prepaid subscription to Stock Trends Weekly Reporter. Save 37% off monthly rate!

STWR - 3 Year Prepaid Subscription

$399.00

3 Year Prepaid subscription to Stock Trends Weekly Reporter. Save 44% off monthly rate!

Stock Trends Editorial

  • War, Inflation, and Rotation: What Stock Trends Reveals After the Middle East Shock
    War, Inflation, and Rotation: What Stock Trends Reveals After the Middle East Shock This week's market headlines have been dominated by war, oil, and inflation fears. However, the Stock Trends context indicates that this is not a broad liquidation. It is a disciplined rotation into sectors tied to scarcity, resilience, and security. Markets do not move from a blank slate. They rotate, they re-price, and they reveal where capital was already preparing to move before the headlines become obvious. This past week’s escalation in the Middle East has undeniably shaken investor confidence, but the latest Stock Trends dataset suggests that the deeper message is not indiscriminate panic. It is a reordering of leadership.
    07 March 2026 Read more...
  • Not Risk-On. Not Risk-Off. Rotation.
    Not Risk-On. Not Risk-Off. Rotation. Not Risk-On. Not Risk-Off. Rotation. In our recent editorial, The Hard Asset Regime Is Not a Trade — It’s a Structure, we examined the persistent leadership emerging in gold and materials and argued that real assets were no longer functioning as short-term hedges, but as structural participants in the market. The current Stock Trends dataset extends that thesis — but in a different direction. The 13-week ST-IM probability model is no longer pointing to a narrow leadership cluster. It is identifying a market redistributing capital across multiple durable themes simultaneously. This is not a simple “risk-on” environment. It is not a defensive “risk-off” retreat. It is rotation.
    02 March 2026 Read more...
  • The Hard-Asset Regime Is Not a Trade — It’s a Structure
    The Hard-Asset Regime Is Not a Trade — It’s a Structure Markets rarely move randomly. They rotate. They reallocate. They transition from one leadership regime to another. And when that transition is real, it shows up not in headlines — but in breadth. This week’s Stock Trends universe reveals something decisive. When we measure common stocks only (removing ETFs that duplicate underlying holdings), two sectors stand apart: Materials and Energy.
    21 February 2026 Read more...
  • Stock Trends Mid-Quarter Review: How the Year-End 2025 Themes Are Performing in Q1 2026
    Stock Trends Mid-Quarter Review: How the Year-End 2025 Themes Are Performing in Q1 2026 Halfway through Q1 2026, the question is no longer theoretical: Did the year-end institutional momentum and ST-IM Alpha themes actually guide investors effectively? With the updated February 13, 2026 Stock Trends dataset now in hand, we can measure the outcome directly — not against headlines, but against trend structure, relative strength, and momentum persistence. The short answer: the framework largely held — but leadership rotated exactly where the model suggested it might.
    14 February 2026 Read more...
View all Stock Trends Editorials


Subscription Plans

STWR - Monthly

$19.95/Month

Monthly subscription plan to Stock Trends Weekly Reporter - pay your monthly subscription fees by having them automatically charged (PayPal only). Free 7-day trial period. Subscribers may cancel before the end of any subscription month.

STWR - 1 Year Prepaid Subscription

$199/Year

1 Year Prepaid subscription to Stock Trends Weekly Reporter. Save 16% off monthly rate!

STWR - 2 Year Prepaid Subscription

$299/2 Years

2 Year Prepaid subscription to Stock Trends Weekly Reporter. Save 37% off monthly rate!

STWR - 3 Year Prepaid Subscription

$399/3 Years

3 Year Prepaid subscription to Stock Trends Weekly Reporter. Save 44% off monthly rate!