
Last week’s TSX reports (period ending July 25, 2025) highlight momentum across uranium and rare earth producers, crypto-themed companies, copper explorers, contract manufacturers, and specialty semiconductor suppliers. In this article, we focus on five standout names – Energy Fuels (EFR), Galaxy Digital (GLXY), Marimaca Copper (MARI), Celestica (CLS), and 5N Plus (VNP) – plus a discussion of the Ether (Ethereum blockchain) ETFs that dominate the TSX Top Trending list.
Understanding the Stock Trends TSX filters
The Stock Trends Weekly Reporter (STWR) service allows members to screen the Toronto Stock Exchange (TSX) universe using momentum-based filters. Two reports were used in this review:
- Bullish Crossovers (
 ) – captures stocks whose 13-week moving average has just crossed above the 40-week average, signalling the start of an uptrend. It requires a share price above $1 and at least 100k shares traded weekly.
 - Top Trending – a stricter filter requiring an above-US$5 price (for cross-listed names), weekly volume above 100k, a 13-week Relative Strength Index (RSI) above 100 versus the S&P/TSX composite, and positive 4- and 13-week price changes. Highlighted cells show stocks at 52-week highs/lows or weekly moves >10 %.
Stock Trends uses a classification system to algorithmically define price trends, price momentum, and trading volume alerts. A Bullish Crossover (![]() ) marks the start of a Bullish trend category; a strongly Bullish signal (
) marks the start of a Bullish trend category; a strongly Bullish signal (![]() ) indicates continued strength; and a Weak Bullish (
) indicates continued strength; and a Weak Bullish (![]() ) flag warns that the price has dipped below the 13-week moving-average envelope. Relative strength values above 100 mean the stock has outperformed the benchmark market index (S&P/TSX composite, S&P 500 for U.S. stocks) over the past 13 weeks. Trend counters show how many weeks a stock has been in its current indicator and in the broader bullish category.
) flag warns that the price has dipped below the 13-week moving-average envelope. Relative strength values above 100 mean the stock has outperformed the benchmark market index (S&P/TSX composite, S&P 500 for U.S. stocks) over the past 13 weeks. Trend counters show how many weeks a stock has been in its current indicator and in the broader bullish category.
Critical minerals: uranium, rare earths, and the nuclear renaissance
Energy Fuels Inc. (EFR-T)
The uranium and rare-earth producer sits atop the TSX Top Trending list with a Bullish indicator. It is only two weeks in the Bullish category, yet its 13-week return exceeds 118 %. EFR’s RSI of 196+ implies the stock is handily beating the S&P/TSX composite.
Fundamentals support the technical breakout. In its Q1 2025 report, Energy Fuels said uranium grades at its Pinyon Plain mine exceeded expectations, prompting a 22 % increase in 2025 mining production guidance and the potential to produce up to one million pounds of finished U3O8 next year. Combined ore production from the Pinyon Plain, La Sal and Pandora mines exceeded 160,000 pounds of contained U3O8 in April alone. The company also announced strategic collaborations with POSCO International and The Chemours Company to build a domestic rare-earth supply chain and produce mid- and heavy-rare-earth elements. With over $210 million of working capital and no debt, Energy Fuels is well-positioned to capitalise on rising nuclear energy demand and U.S. critical minerals policy.
Crypto and digital-asset boom
Galaxy Digital Holdings (GLXY-T)
Galaxy Digital, a diversified crypto financial-services firm, appears in the Top Trending report with a bullish indicator and 4 / 5 trend counters. The stock gained 12.7 % during the week and is up 103 % over 13 weeks, with an RSI of 183+. Despite a net loss of US$295 million in Q1 2025 due to declining digital-asset prices and a one-time impairment, Galaxy maintained equity capital of US$1.9 billion and cash and net stablecoins of US$1.1 billion. Management expects Q2-to-date operating income of US$160–170 million, highlighting the company’s resilience. Expansion of its Helios data-centre campus, including a contract with CoreWeave to deliver up to 393 MW of power for AI and high-performance computing workloads, positions Galaxy to benefit from AI-driven data-centre demand.
Ether ETFs (ETHH, ETHQ, ETHX.B, ETHH.B, ETHR)
Four Purpose Investments Ether ETFs populate the Top Trending list, reflecting the surge in Ethereum prices. Each ETF holds spot ether and thus tracks the cryptocurrency closely. In July 2025, Ethereum gained 48.73 %, driven by heavy institutional demand for spot ETFs. BlackRock’s spot Ether ETF recorded a record trading volume of 43 million shares on July 10, with net inflows of US$158 million, while the 30-day average trading volume climbed to 18.8 million shares. Major investors such as BlackRock, Fidelity, and Grayscale increased their holdings. The forthcoming Pectra upgrade—expected to improve Ethereum’s scalability by orders of magnitude—has added to bullish sentiment. Macro tailwinds, including potential U.S. rate cuts and a liquidity super-cycle, further support crypto assets. These forces explain why the Ether ETFs show strong relative strength values (around 160–170), despite modest price gains during the week.
Copper exploration boom
Marimaca Copper Corp. (MARI-T)
Marimaca’s Top Trending placement reflects a long-running rally: the stock has 8 weeks in the current indicator and 64 weeks in the broader bullish category. Over the past 13 weeks, the stock is up 103 %, although it slipped 3.7 % in the latest week. On July 3, the company reported drill results from its Pampa Medina sulphide target in Chile. Exploration intersected 6 m grading 12 % copper within 26 m at 4.1 % Cu and a broader 100 m interval averaging 1.3 % Cu. Another hole returned 40 m of 2.1 % Cu within a 132-m interval of 1.0 % Cu. These ultra-high-grade intersections suggest Pampa Medina could form a stratiform copper deposit analogous to the giant Kupferschiefer or African copper belts. Management believes the results add a new dimension to Marimaca’s development plans and could support a larger-scale operation. The stock’s strong technical momentum is thus underpinned by high-grade drill results and growing copper demand from electrification.
Manufacturing and hardware platforms
Celestica Inc. (CLS-T)
Celestica, a contract manufacturer and hardware solutions provider, appears in the Top Trending report with 12 / 137 trend counters and an RSI of 170+. The stock has risen 89 % over 13 weeks and another 6.1 % during the review week. The company’s Q2 2025 results were exceptional: revenue reached US$2.89 billion, up 21 % from a year earlier; GAAP earnings per share of US$1.82 more than doubled; and non-GAAP adjusted EPS of US$1.39 grew 54 %. Adjusted operating margin improved to 7.4 %. Management raised its 2025 revenue guidance to US$11.55 billion (from US$10.85 billion) and expects non-GAAP EPS of US$5.50. With demand from connectivity & cloud solutions (servers, storage, and AI hardware) accelerating, Celestica’s strong financial momentum reinforces its Stock Trends signal.
Specialty semiconductors and performance materials
5N Plus Inc. (VNP-T)
5N Plus, a producer of ultra-pure materials used in renewable energy, medical imaging, and space-based solar arrays, is also in the Top Trending report. Its trend counters are 6 / 7 weeks, and it shows an RSI of 168+ with a star indicating unusual trading volume. In Q1 2025, the company reported revenue of US$88.9 million, a 37 % increase from a year earlier, driven by strong demand in terrestrial renewable energy and space solar power markets. Adjusted EBITDA jumped 77 % to US$20.8 million, and net earnings rose to US$9.6 million. Management highlighted continued margin expansion (adjusted gross margin of 34.2 %) and maintained its 2025 adjusted EBITDA guidance of US$55–60 million. As supply chains seek secure sources of critical materials like gallium, germanium, and bismuth, 5N Plus’s strong order book and operational leverage bolster its technical up-trend.
TSX Stock Trends summary
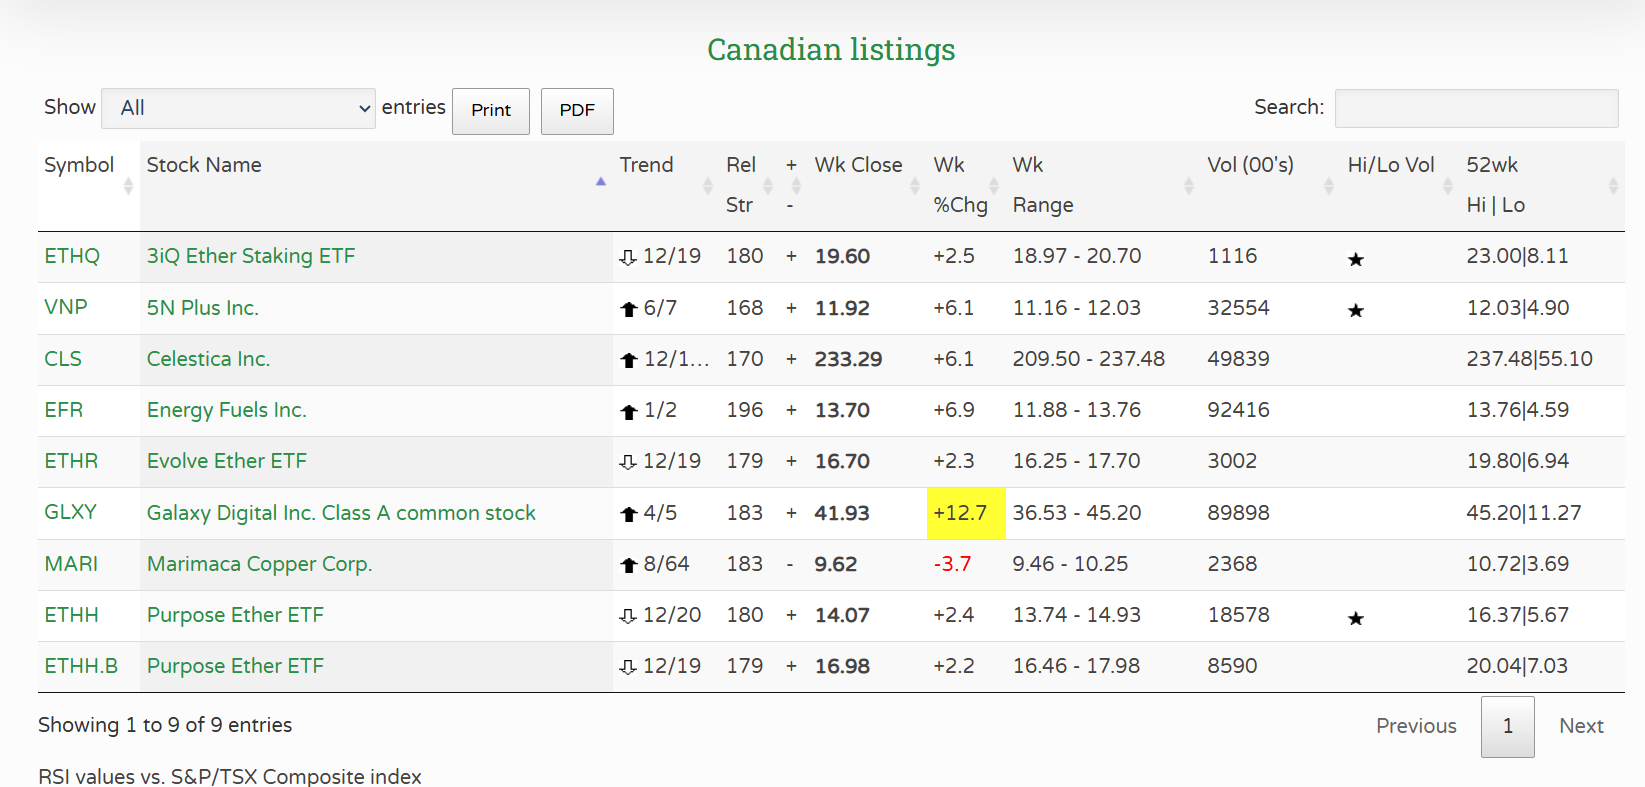
| Symbol | ST indicator | Trend counters (indicator / major) | 1-week change | 13-week change | Relative strength (13-week) | Price range | Notes |
|---|---|---|---|---|---|---|---|
| EFR | Bullish | 1 / 2 | +6.9 % | +118.5 % | 196+ | C$11.88–13.76 | Uranium & rare-earth producer boosting 2025 output guidance |
| GLXY | Bullish | 4 / 5 | +12.7 % | +103.3 % | 183+ | C$36.53–45.20 | Crypto financial services firm; strong cash; Helios data-centre expansion |
| MARI | Bullish | 8 / 64 | –3.7 % | +103.4 % | 183– | C$9.46-10.25 | High-grade copper discovery at Pampa Medina with 12 % Cu intercepts |
| CLS | Bullish | 12 / 137 | +6.1 % | +89.0 % | 170+ | US$209.50–237.48 | Contract manufacturer; revenue up 21 %, raising 2025 guidance |
| VNP | Bullish | 6 / 7 | +6.1 % | +86.8 % | 168+ | C$11.16–12.03 | Specialty semiconductors; revenue up 37 %, EBITDA up 77 % |
| ETHH, ETHQ, ETHX.B, ETHH.B, ETHR | Bullish | 12 / 19 (avg) | –1 % to +2 % | +40 % (approx) | 160–170 | — | Spot Ether ETFs benefiting from Ethereum’s 48.7 % July surge and ETF inflows |
Data source: Stock Trends Weekly Reporter – TSX Bullish Crossover and Top Trending reports for the week ending 25 Jul 2025.
Conclusion: technical signals meet thematic catalysts
The TSX Stock Trends filters spotlight a diverse mix of companies riding strong thematic tailwinds. Energy Fuels exemplifies the nuclear and critical-minerals renaissance; its bullish crossover is backed by increasing uranium production guidance and strategic rare-earth partnerships. Galaxy Digital and the Ether ETFs capture the crypto rebound spurred by massive ETF inflows, the upcoming Pectra upgrade, and supportive macro conditions. Marimaca Copper offers exposure to the electrification boom through high-grade drill results at Pampa Medina. Celestica benefits from robust server, storage, and AI hardware demand, delivering record margins and raising its outlook, while 5N Plus supplies specialty semiconductors and performance materials to renewable-energy and space industries, translating into strong revenue growth.
Investors should remember that momentum can reverse quickly; stocks like Galaxy Digital are still tied to volatile digital-asset prices, and juniors like Marimaca rely on exploration success. Nevertheless, by combining Stock Trends’ disciplined technical framework with fundamental research, market participants can identify where momentum aligns with powerful secular trends across the Canadian market.
Related items
- Stocks Highlighted in Fall 2025 Trends
- Stock Trends: The Human Side of Market Trends
- Money management and trading psychology: building a resilient trading plan that integrates with the Stock Trends decision-tree framework
- Stock Trends Insights: Market Breadth Across Sectors and Exchanges
- Stock Trends Insights: Bullish Momentum in Consumer Discretionary and Healthcare
 Your report is an impressive, excellent tool and I have recommmended it to friends.


