The uncertain interest rate environment is evident in a number of sectors, and the stock market is always reflecting both the trend of the cost of capital and the anticipation of changes in it. The technology sector is especially sensitive to interest rates and generally feeds off the risk-on investor appetite supported by lower interest rates or expectations of relatively lower rates. But all technology stocks are not the same. The Stock Trends data shows how the hardware and software segments of the sector are showing distinct trend and momentum indicators, ST-IM forward return estimates, as well as relative valuation measures.
Macro and valuation context
The rally in global equities since the end of 2022 has been powered by mega-cap technology names, with the Nasdaq 100 index up 105% during the period. Growth stocks have benefited from easing inflation, resilient GDP growth, and expectations of Federal Reserve rate cuts. Yet, the continued overhang of elevated interest rates (the U.S. Fed funds rate remains at 4.2%–4.5%) and rising long-dated yields create headwinds for companies with high valuations. Examining price-to-earnings ratios illustrates how expectations are baked into technology names: Apple’s P/E ratio stands at 35.2 in August 2025, Microsoft at 37.1, Amazon at 34.2, while Nvidia – the poster child for artificial-intelligence hardware – trades on a P/E of 53.15. Mature software vendors such as Oracle (P/E 51.3) and Salesforce (P/E 40.7) command similarly high multiples. High valuations are the rule rather than the exception across tech; what differentiates stocks today is momentum.
Evidence from the Stock Trends dataset
Stock Trends tags every security with a weekly trend indicator. Within the technology sector there are three primary industry groups: Hardware & Equipment, Semiconductors & Equipment, and Software & IT Services. The table below summarises key statistics for these groups, based on the August 29, 2025 dataset (14,429 instruments total). Average trend durations, momentum counts, and RSI values are derived from Stock Trends indicators. Example P/E ratios come from leading companies in each group.
| Tech sub-sector | Total stocks | Strong Bull | Strong Bear | Avg trend (weeks) | Avg primary trend (weeks) | Avg RSI | Avg price (USD) | Example P/E ratio (TTM) | Note |
|---|---|---|---|---|---|---|---|---|---|
| Hardware & Equipment | 214 | 89 | 57 | 7.5 | 28.5 | 116 | 48.02 | Apple 35.2 | Uptrend breadth and solid fundamentals. |
| Semiconductors & Equipment | 101 | 38 | 21 | 4.3 | 21.5 | 112 | 82.51 | Nvidia 53.15 | Rising crossovers, strong price momentum. |
| Software & IT Services | 502 | 134 | 183 | 6.3 | 27.8 | 98 | 62.04 | Oracle 51.3 / Salesforce 40.7 | Bearish skew despite high valuations. |
Average trend metrics are rounded. Example P/E ratios come from Companies' Market Cap (TTM as of Aug 2025).
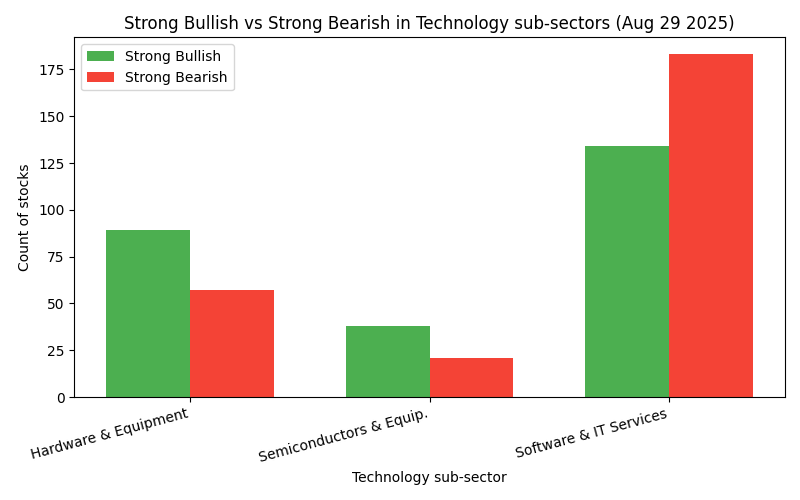
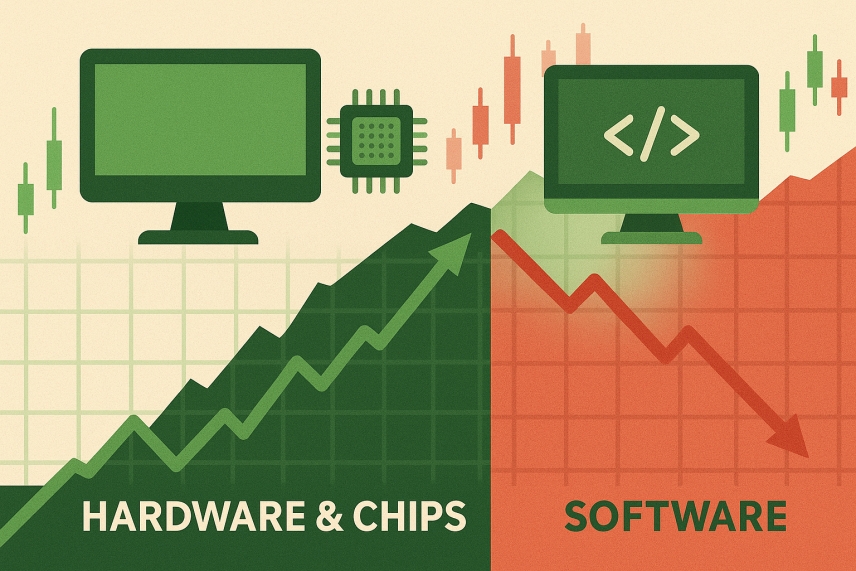
The contrast is clear: hardware and semiconductor stocks have more Strong Bullish ratings than Strong Bearish, while software & IT services have the reverse. This split is visualised in the following chart:
Forward return outlook (ST-IM)
Stock Trends Inference Model (ST-IM) produces forward-return estimates based on historical price patterns. In the technology sector, these variables reinforce the bifurcation: strong Bullish names in hardware and chips are expected to outperform their strong Bearish counterparts, while software’s advantage is more muted. The table below summarises the mean predicted returns for 4-, 13-, and 40-week horizons. Values represent the percentage price change over the period.
| Sub-sector | Strong bulls (4wk/13wk/40wk) return estimates (%) | Strong bears (4wk/13wk/40wk) return estimates (%) | Insight |
|---|---|---|---|
| Hardware & Equipment | 1.01 / 3.16 / 8.61 | 0.31 / 1.46 / 6.13 | Bulls expected to outperform bears by ~2× across horizons; predicted returns remain positive even for bears. |
| Semiconductors & Equipment | 0.99 / 3.36 / 10.05 | –0.01 / 1.05 / 8.22 | Strong bulls have consistently positive forecasts; bears start flat at 4 weeks and lag across longer horizons. |
| Software & IT Services | 0.83 / 2.53 / 8.30 | 0.58 / 1.68 / 5.70 | Bulls still lead, but the gap is smaller, reflecting softer momentum; both cohorts have modest forward returns. |
These forward-return estimates suggest that investors who align with the prevailing trend – especially within hardware and semiconductor names – stand to gain more over the coming weeks and months. Software stocks, on the other hand, offer positive but more modest expected returns even when strong bullish signals are present. Probability estimates from the model further indicate that the likelihood of a positive 13-week return outperformance sits around 52 %–53 % for strong-bullish technology stocks, underscoring that the signal is directional rather than a guarantee.
Subscribers to Stock Trends Weekly Reporter can use the Map of Stocks Trends for the individual exchanges to isolate the top stocks in an industry group by trend indicator. These have the best probability of outperforming the market in the coming 4-week, 13-week, and 40-week periods (by exchange). This interactive hierarchical chart allows users to drill down on these estimates based on sector, industry group, and trend variables. Below is a snapshot of the breakdown of Semiconductors & Equipment strong Bullish (![]() ) stocks and how their forward ST-IM return estimates rank.
) stocks and how their forward ST-IM return estimates rank.
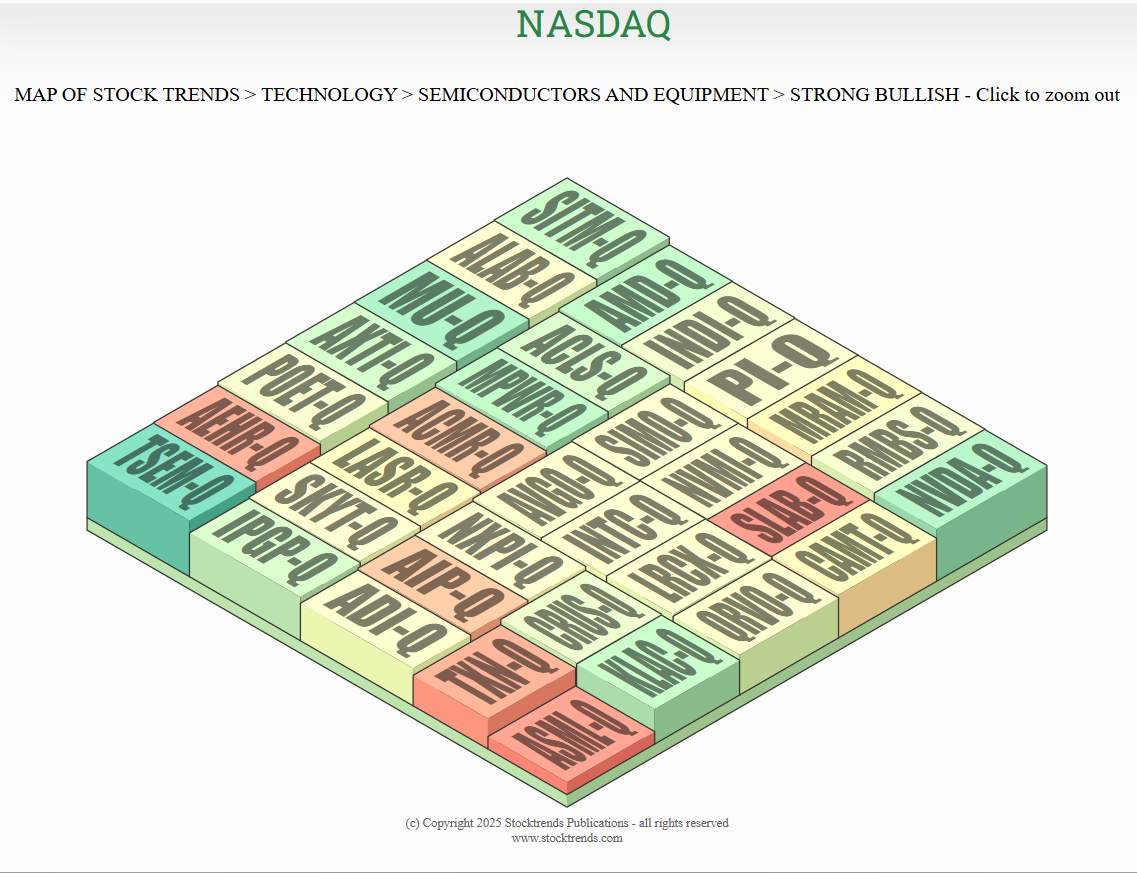
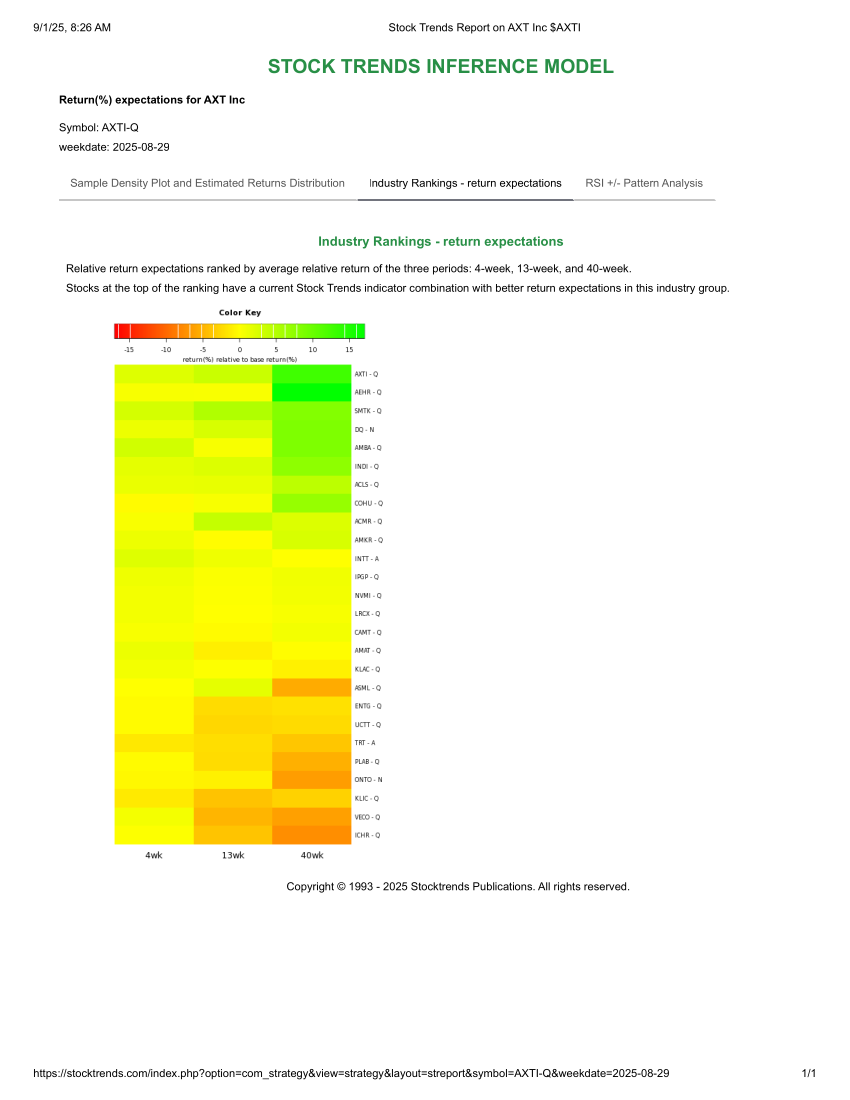
While SiTime Corp (SITM) is showing the best forward estimates of the strong Bullish Nasdaq stocks in the industry (the stock was featured in a recent editorial), users can also refer to the Industry rankings of all stocks, bullish or bearish, in the Trend Profile tab of any stock in the group. For instance, the ranking below is for the Semiconductor Parts & Equipment Group, found under AXT Inc. (AXTI) Trend Profile, Industry Rankings of return expectations:
Profitability trends: fundamental divergence
Beyond price momentum and forward returns, the Profitability Trends chart under the Fundamentals tab in each Stock Trends report provides insight into whether profits are keeping pace with revenue growth. Reviewing these charts for representative stocks illustrates how fundamentals differ across the technology split:
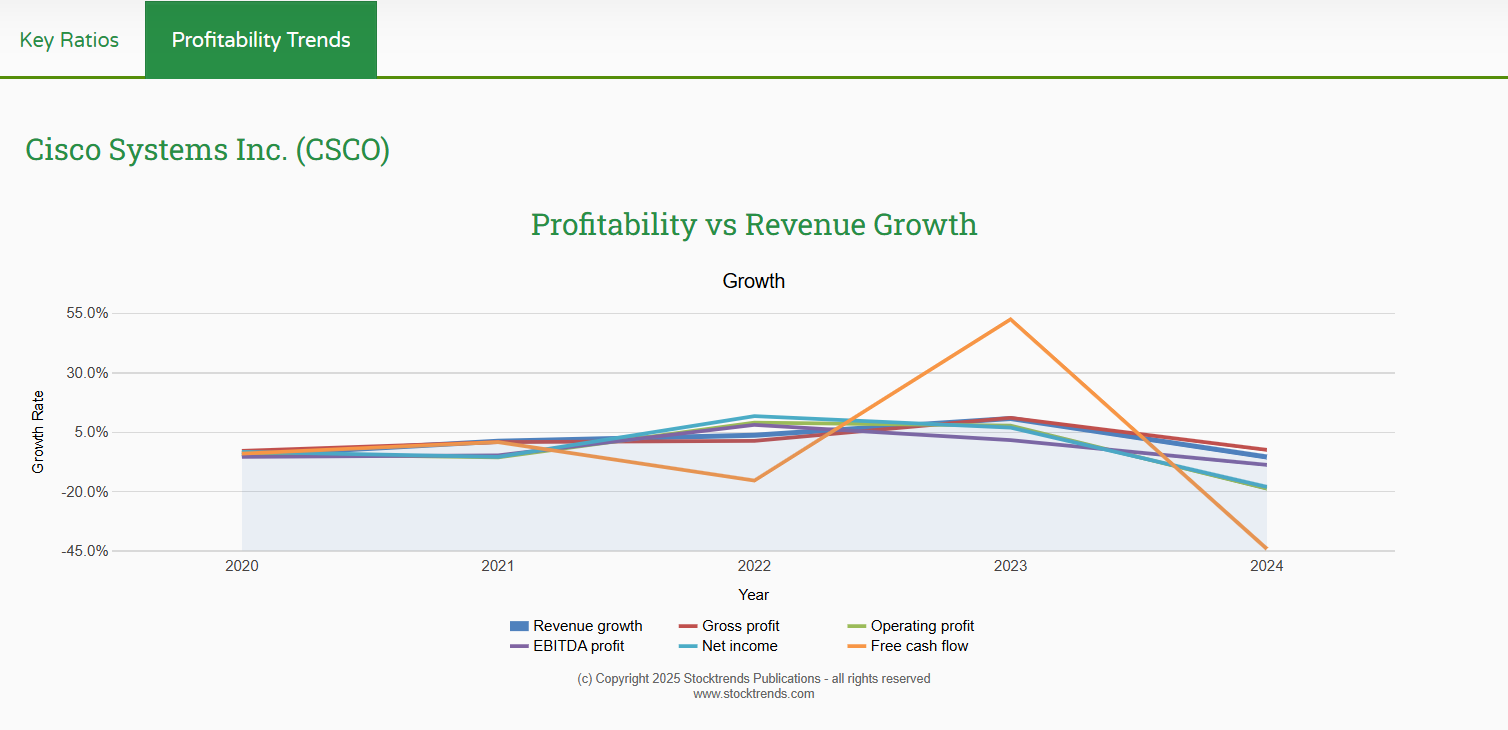
- Hardware & Equipment: In Cisco Systems (CSCO), revenue and profit growth have slowed since 2023; free cash-flow growth spiked during 2023 but turned negative in 2024, yet overall margins remain positive. Jabil (JBL) exhibits a one-off revenue surge in 2021 followed by steady, positive revenue and profit growth in 2022-2024. Broadcom (AVGO) shows a similar pattern: explosive 2021 growth, then a pullback, but profit metrics such as gross margin and operating profit stay positive through 2024. These patterns suggest that hardware and chip leaders continue to generate healthy profits despite cyclical revenue swings.
- Software & IT services: Oracle (ORCL) and Salesforce (CRM) display much more volatile profitability. Oracle’s revenue and profit growth bottomed in 2022 but rebounded sharply in 2023 and 2024; free cash-flow growth oscillates widely, signalling inconsistent earnings leverage. Salesforce’s chart is even more erratic: enormous spikes in revenue growth (likely reflecting large acquisitions) are followed by collapses, while operating-profit growth drifts lower. Such volatility helps explain why many software stocks carry strong bearish ratings despite lofty valuations.
Subscribers can access these Profitability Trends charts directly from each Stock Trends Report page to cross-check whether price momentum is supported by improving margins. Stocks with stable or rising EBITDA, operating profit, and free cash-flow lines are more likely to sustain bullish trends. Conversely, erratic or declining profitability should prompt caution, even when the ST-IM forward return variables point to modest gains. For example, here are the current Profitability charts for Cisco Systems (CSCO) found under the Fundamentals - Profitability Trends.
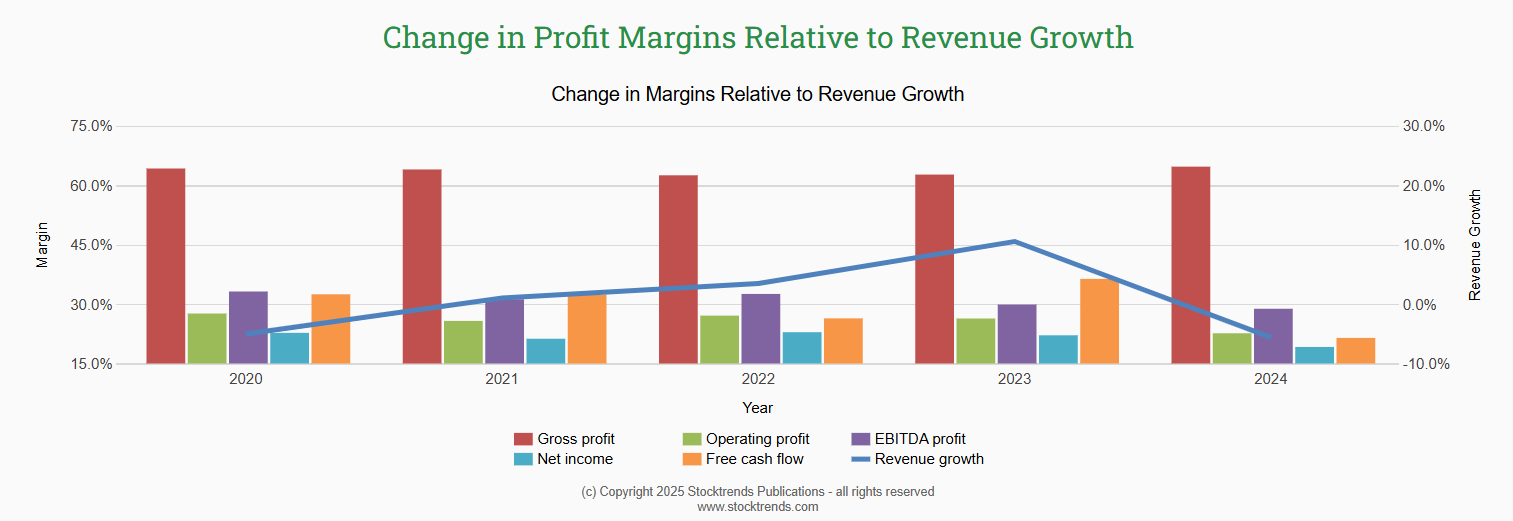
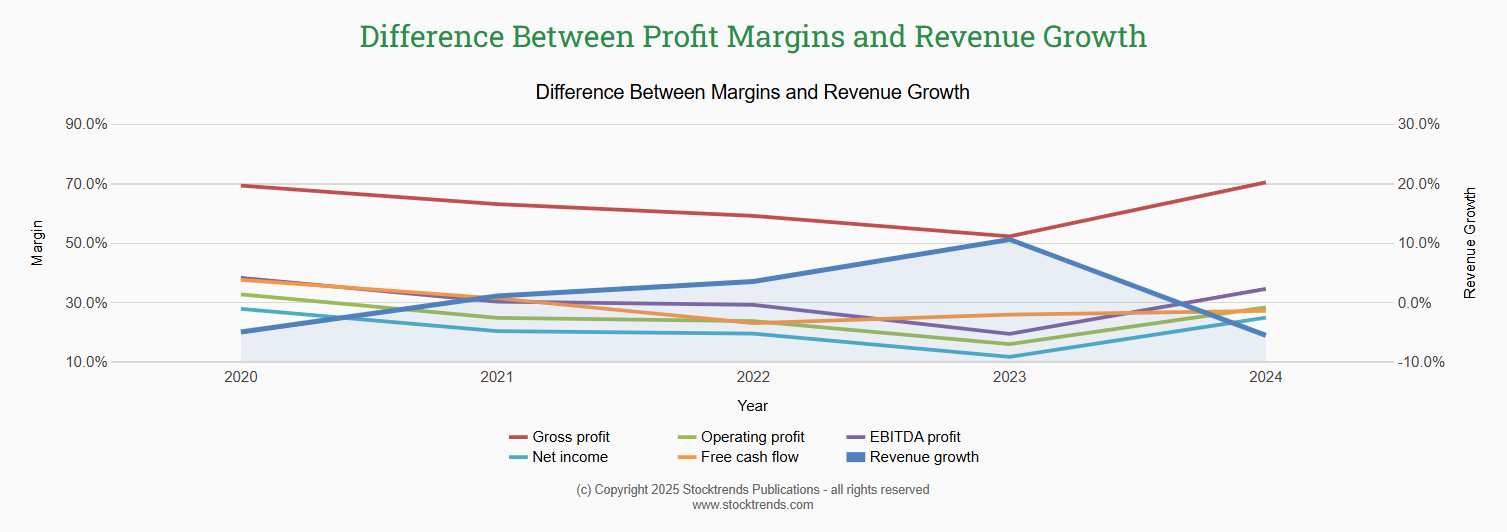
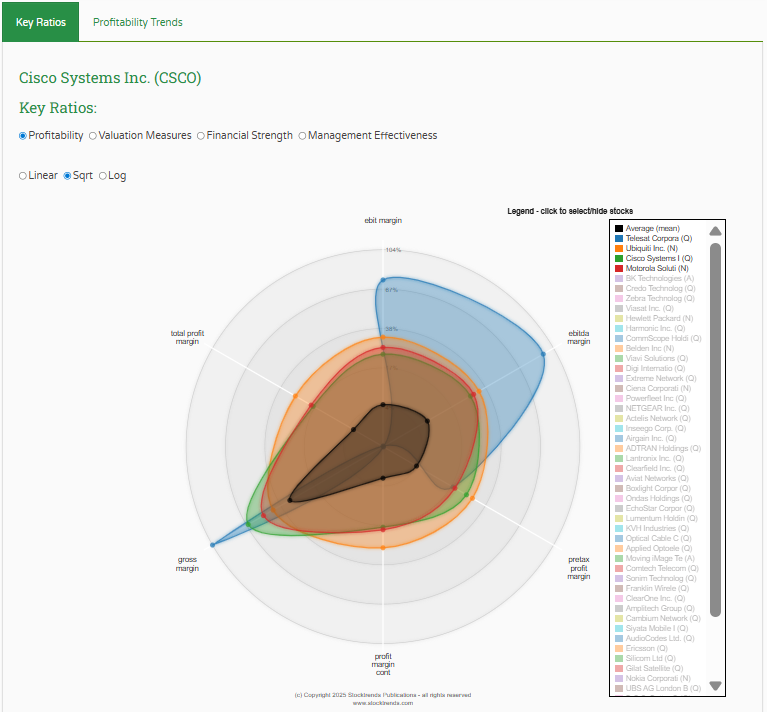
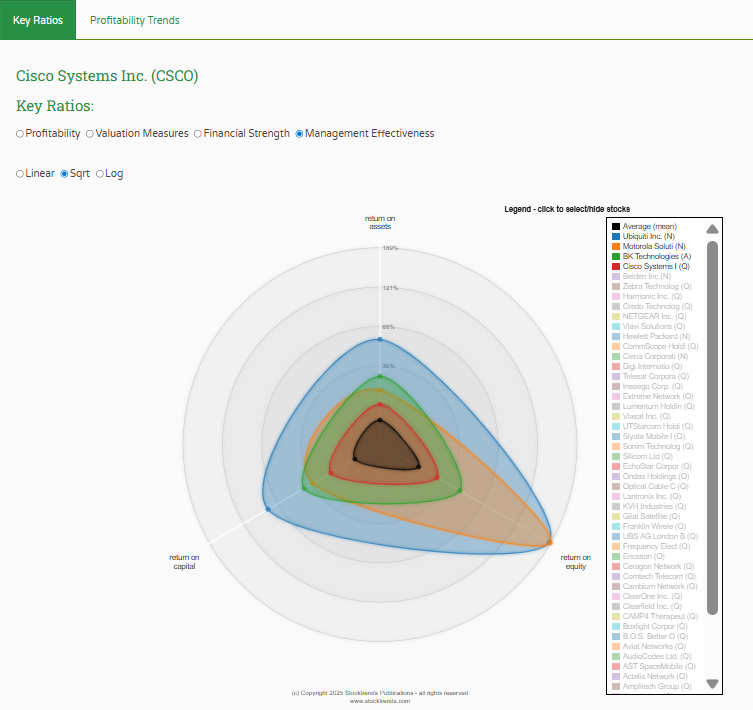
Similarly, the Key Ratios radar graphs provide an excellent visual comparison to industry valuation measures. It is also available under the Fundamentals tab of each Stock Trends Report page (STWR subscribers only). For example, here are the profitability and management effectiveness comparisons of Cisco with its peers.
Hardware & Equipment – consistent momentum
Stock Trends flags 89 hardware stocks as Strong Bullish (![]() ) (42 % of the group) versus 57 Strong Bearish (
) (42 % of the group) versus 57 Strong Bearish (![]() ) (27 %). The average secondary trend lasts 8 weeks with a primary trend count of 29 weeks, indicating sustained strength. Well-known names such as Cisco Systems (CSCO), Jabil (JBL) and Amphenol (APH) appear on the strong-bullish list with trend durations between 15–21 weeks. Celestica (CLS) and Ubiquiti (UI) show unusually high momentum readings, while Teledyne Technologies (TDY) and Esco Technologies (ESE) have more unremarkable RSI metrics.
) (27 %). The average secondary trend lasts 8 weeks with a primary trend count of 29 weeks, indicating sustained strength. Well-known names such as Cisco Systems (CSCO), Jabil (JBL) and Amphenol (APH) appear on the strong-bullish list with trend durations between 15–21 weeks. Celestica (CLS) and Ubiquiti (UI) show unusually high momentum readings, while Teledyne Technologies (TDY) and Esco Technologies (ESE) have more unremarkable RSI metrics.
Hardware stocks benefit from secular growth in cloud infrastructure and networking equipment, but they also offer steadier earnings relative to many software firms. Apple’s P/E ratio, around 35, is elevated yet lower than that of many software peers, suggesting that investors still demand earnings support.
Semiconductors – chips still in the driver’s seat
Semiconductor and equipment stocks show an even greater skew: 38 strong Bullish (![]() ) versus 21 strong Bearish (
) versus 21 strong Bearish (![]() ). New uptrends are emerging – there are 7 Bullish Crossovers (
). New uptrends are emerging – there are 7 Bullish Crossovers (![]() ) in the current week's data and no Bearish Crossovers (
) in the current week's data and no Bearish Crossovers (![]() ). Major players such as Broadcom (AVGO), KLA Corp. (KLAC), Taiwan Semiconductor (TSM), Lam Research (LRCX), and Monolithic Power (MPWR) maintain multi-week bullish trends with high RSI values. Nvidia (NVDA), despite its lofty 53.15 P/E ratio, remains in a strong bullish phase in the Stock Trends model. Average momentum counts (~21 weeks) suggest some trends are still maturing; investors should watch for changes in the Stock Trends indicators to confirm sustained strength.
). Major players such as Broadcom (AVGO), KLA Corp. (KLAC), Taiwan Semiconductor (TSM), Lam Research (LRCX), and Monolithic Power (MPWR) maintain multi-week bullish trends with high RSI values. Nvidia (NVDA), despite its lofty 53.15 P/E ratio, remains in a strong bullish phase in the Stock Trends model. Average momentum counts (~21 weeks) suggest some trends are still maturing; investors should watch for changes in the Stock Trends indicators to confirm sustained strength.
Semiconductor valuations vary widely, but the group’s earnings momentum has accelerated thanks to AI and data-center demand. Long-dated yield concerns affect the sector – many chip stocks sold off during the spring when 10-year yields approached 4.5 % – however, the current industry trend profile signals renewed accumulation.
Software & IT services – weak breadth despite premium valuations
By contrast, the Software & IT Services group is dominated by 183 strong Bearish versus 134 strong Bullish. Trend durations average 6.3 weeks, and there are slightly more Bearish Crossovers than bullish ones (7 vs. 5). Even established software giants have not been immune: while Microsoft (MSFT) retains a strong bullish signal in the Stock Trends universe, other enterprise names such as Oracle (ORCL) and Salesforce (CRM) have wavered despite maintaining rich valuations (P/E 51.3 and 40.7 respectively). Many investors are reassessing the sustainability of recurring revenue growth in a high-rate environment.
The divergence in momentum reflects two forces. First, hardware and semiconductor companies are delivering tangible earnings and benefiting from AI-driven capital expenditure. Second, richly valued software firms are more sensitive to discount-rate expectations; when long-term yields drift higher, valuations compress. BNP Paribas warns that 4.5% on the U.S. 10-year Treasury is a critical threshold for highly valued stocks. It is now at 4.22%. Until interest-rate volatility subsides or software earnings growth accelerates, the Stock Trends models suggest patience.
Using Stock Trends to navigate the split
- Screen by industry group. Subscribers can filter the STWR to show only Hardware & Equipment, Semiconductors or Software & IT Services. This immediately reveals where breadth is strongest. For example, semiconductors showed 7 Bullish Crossovers, signalling nascent uptrends, while software showed more bearish shifts.
- Identify early entries. Look for
 (Bullish Crossover) tags accompanied by rising RSI and unusual volume indicators. In semiconductors, mid-cap names such as Silicon Motion (SIMO) and Rambus (RMBS) triggered Bullish Crossovers in the early summer and have improving momentum.
 - Watch valuations. High P/E ratios signal elevated expectations. Stock Trends does not incorporate fundamentals into its signals, but combining its trend information with valuation metrics from credible sources can help investors avoid overpaying. For instance, Nvidia’s P/E of 53.15 may limit upside if growth disappoints, whereas hardware firms with lower multiples like Cisco or Apple may offer better risk-reward.
- Gauge risk via crossovers. In software, Bearish Crossovers (
 ) warn that the primary trend is not your friend. Subscribers holding popular cloud names should monitor these signals closely and adjust positions when downtrends persist beyond a few weeks.
Conclusions and actionables
- Hardware and chips remain the sweet spot. The Stock Trends data show superior breadth and momentum in hardware and semiconductor stocks, supported by secular tailwinds and resilient earnings. Investors seeking technology exposure may tilt towards this side of the sector while monitoring for yield-driven volatility.
- Be selective with software. High valuations across enterprise software names require robust growth to sustain them. The prevalence of strong bearish signals in the Stock Trends models suggests waiting for clear bullish crossovers or evidence of improving fundamentals before increasing exposure.
- Combine technical and fundamental lenses. Stock Trends indicators provide objective trend direction and duration; overlaying this with fundamental metrics—such as P/E ratios from trusted sources—can help investors calibrate expectations and avoid momentum traps.
- Stay attuned to macro triggers. A break above 4.5% on the U.S. 10-year yield or a significant shift in inflation trends could quickly alter technology leadership. Use the STWR’s weekly updates to respond promptly to changing conditions.
By drilling into sub-sector detail and pairing trend indicators with valuation awareness, investors can harness the Stock Trends dataset to navigate the technology sector’s bifurcation effectively.
Related items
- Understanding Our Assumptions — A Decade Later
- Navigating Market Turmoil in December 2025 – How Stock Trends Guides Investors
- TJX at New Highs — A Case Study in Long-Run Trend Persistence and Momentum Rotation
- When the “Big Short” Turned Its Eye on Tech: Interpreting the Burry Shock Through Stock Trends Indicators
- Positioning for Opportunity: Trade Detente and Stock Trends Momentum

 I very much like the systematic approach to analyzing stock data, it fits my approach.


