
The summer season is coming to a close. It is sometimes a sleepy market season because investor attention is elsewhere. However, the market has provided us with some definite messaging over the past few months. The themes of rotation and building strength in resources and energy stocks, notably fueled by an AI transformation across the broader economy, are key highlights that investors should pay attention to and adjust their portfolio exposure accordingly to these opportunities.
Over the past two months Stock Trends has pointed to a market that was broadening beyond big-cap technology. In the August 16 Market Breadth Across Sectors and Exchanges article, we noted that the Stock Trends ML Project’s epoch research signaled a maturing bull cycle, with breadth expanding into Technology, Industrials, and Energy. At the same time, the same article highlighted Materials and mining resilience and presented names such as Coeur Mining (CDE) and Ramaco Resources (METC) as early leaders. Our July 31 weekly review, which focused on Canadian momentum in critical minerals, crypto and manufacturing, emphasized stocks like Energy Fuels (EFR), 5N Plus (VNP), and copper explorer Marimaca Copper, which were already trending. Subsequent commentary on August 18, however, reminded readers that some bullish stocks were losing momentum and flagged CME Group and Stratasys as at risk. Against this backdrop, the current Stock Trends Weekly Reporter update shows that leadership has rotated decisively toward resource producers and energy-transition enablers. This article builds on those earlier insights, ties in macro research on metals and energy demand, and uses the Stock Trends indicators to spotlight where momentum remains strongest.
Data-driven rotation into resources
The current Stock Trends data shows that Materials and Energy sectors now dominate the bullish category. Of the 980 materials stocks in the universe, 265 were strongly bullish (![]() ) and only 85 were strongly bearish (
) and only 85 were strongly bearish (![]() ), resulting in a net bullish differential of +180. Energy exhibited a similar tilt with 213 strong bulls versus 139 strong bears. These figures echo the August 16 market breadth analysis, where the ML Project’s epoch research flagged rising counts in weak bullish trends as evidence of rotation into Energy and Materials.
), resulting in a net bullish differential of +180. Energy exhibited a similar tilt with 213 strong bulls versus 139 strong bears. These figures echo the August 16 market breadth analysis, where the ML Project’s epoch research flagged rising counts in weak bullish trends as evidence of rotation into Energy and Materials.
This broadening is not just a statistical artefact. Macro research corroborates the shift: the International Energy Agency projects that copper supply will fall 30 % short of demand by 2035, while the World Gold Council notes that gold has already advanced 26 % year-to-date in 2025 and could rise another 10–15 % if economic conditions deteriorate. A Reuters report underscores a “step change” in demand for uranium as countries extend reactor lifespans and build new plants, and it forecasts record U.S. electricity consumption in 2025-26 thanks to AI-powered data centres. These supply/demand imbalances anchor the bullish signals in the Stock Trends data.
Copper: following up on early signals
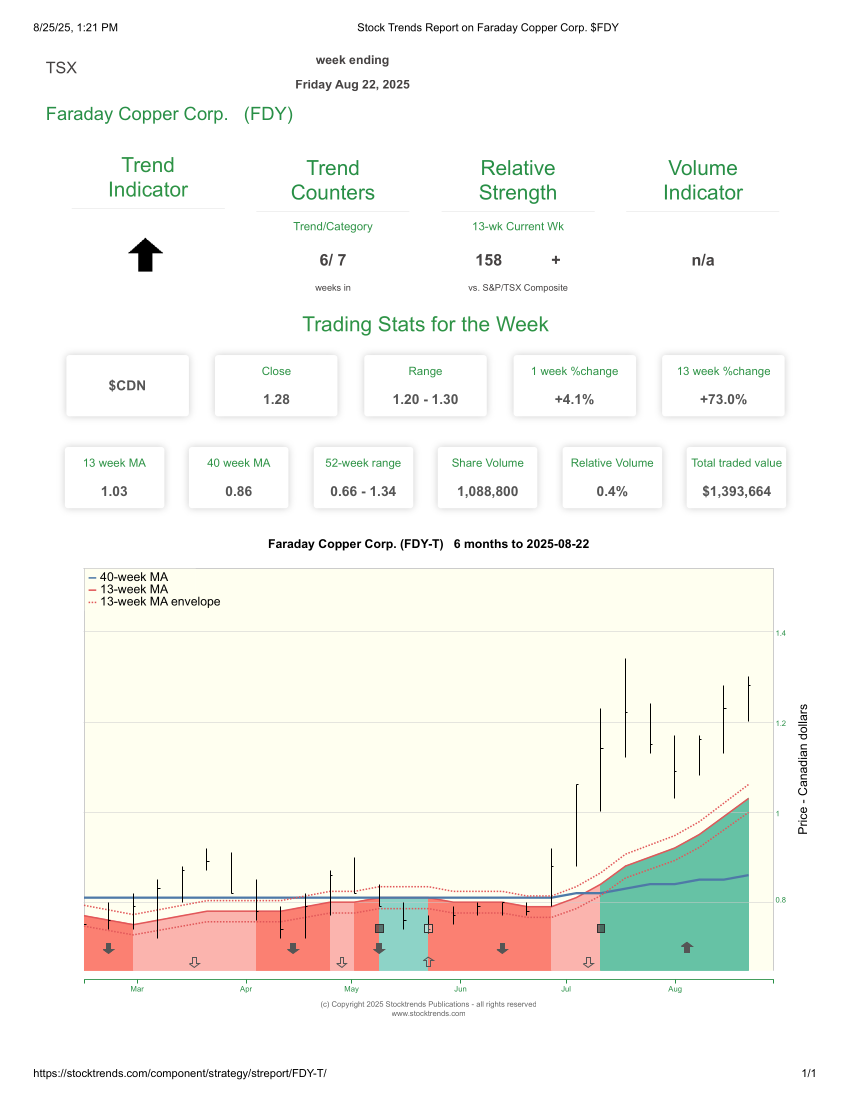
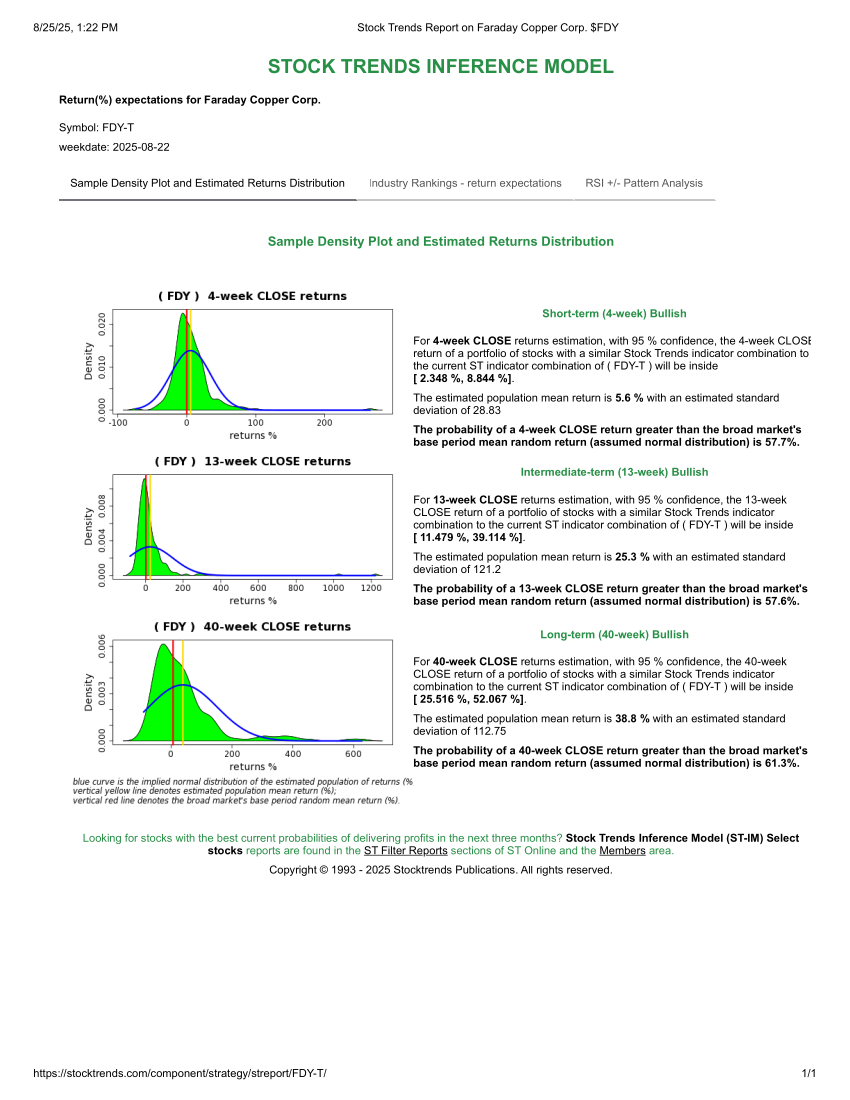
The July 31 article spotlighted Marimaca Copper for its triple-digit returns and strong momentum. In the latest data, junior explorer Faraday Copper (FDY-T) has taken the baton among the small cap group. Its Stock Trends report shows a strong bullish (![]() ) trend with trend counters 6/7 weeks and a 13-week price gain of +73 %. The relative-strength score (158) means it has outperformed the S&P/TSX Composite by 58 % over the past quarter. Faraday controls the Copper Creek project in Arizona and offers leveraged exposure to the electrification deficit. The volatile price profile of junior mining stocks delivers very bullish ST-IM forward price estimates for FDY - 25% return estimate for the coming 13-week period, 39% for the 40-week period ahead. Other copper names maintaining bullish profiles include Arizona Sonoran Copper (ASCU-T) and Alta Copper, suggesting the sector-wide momentum we observed in mid-August persists.
) trend with trend counters 6/7 weeks and a 13-week price gain of +73 %. The relative-strength score (158) means it has outperformed the S&P/TSX Composite by 58 % over the past quarter. Faraday controls the Copper Creek project in Arizona and offers leveraged exposure to the electrification deficit. The volatile price profile of junior mining stocks delivers very bullish ST-IM forward price estimates for FDY - 25% return estimate for the coming 13-week period, 39% for the 40-week period ahead. Other copper names maintaining bullish profiles include Arizona Sonoran Copper (ASCU-T) and Alta Copper, suggesting the sector-wide momentum we observed in mid-August persists.
Gold: resilience amid uncertainty
Our August 16 article emphasised the appeal of precious-metal miners like Coeur Mining during a period of rising rates and geopolitical tension. The latest dataset brings Fury Gold Mines (FURY-T) into focus. Fury has nine out of ten weeks in its current bullish trend and a 13-week price increase of +33.3 %. The relative-strength reading of 122 signals sustained outperformance. Its projects in Quebec’s James Bay region position it for potential resource upgrades as exploration continues. For investors who heeded July’s call to diversify into gold plays, these signals provide reinforcement. However, the Aug 18 Spotlight on Risk reminds us that momentum can fade quickly—stocks like CME Group (CME) and Stratasys (SSYS) maintained bullish trend codes but exhibited deteriorating trend-age and negative ST-IM projections. As with those names, gold equities should be monitored for weakening indicators or declining relative-strength scores.
Uranium revival: a continued narrative
The nuclear renaissance has been a recurring theme in our coverage. In the July 31 weekly review, we noted that Energy Fuels delivered a 118 % 13-week return and boasted an RSI of 196+. This week's data confirm that momentum: Energy Fuels still shows a strong bullish (![]() ) trend, with 5/6 trend counters and a 13-week price gain of +98.2 %. Its relative-strength value of 181 reinforces the stock’s leadership. Another star is Ur-Energy (URG-A); it has been bullish for three of the last four weeks and produced a 13-week return of +54 %, while the 1-week gain of +13.6 % indicates renewed buying interest. These names extend the narrative from July, when we also highlighted rare-earth producer 5N Plus, underscoring the broad momentum across the nuclear fuel cycle and critical-minerals value chain.
) trend, with 5/6 trend counters and a 13-week price gain of +98.2 %. Its relative-strength value of 181 reinforces the stock’s leadership. Another star is Ur-Energy (URG-A); it has been bullish for three of the last four weeks and produced a 13-week return of +54 %, while the 1-week gain of +13.6 % indicates renewed buying interest. These names extend the narrative from July, when we also highlighted rare-earth producer 5N Plus, underscoring the broad momentum across the nuclear fuel cycle and critical-minerals value chain.
Renewable-energy equipment: playing the demand surge
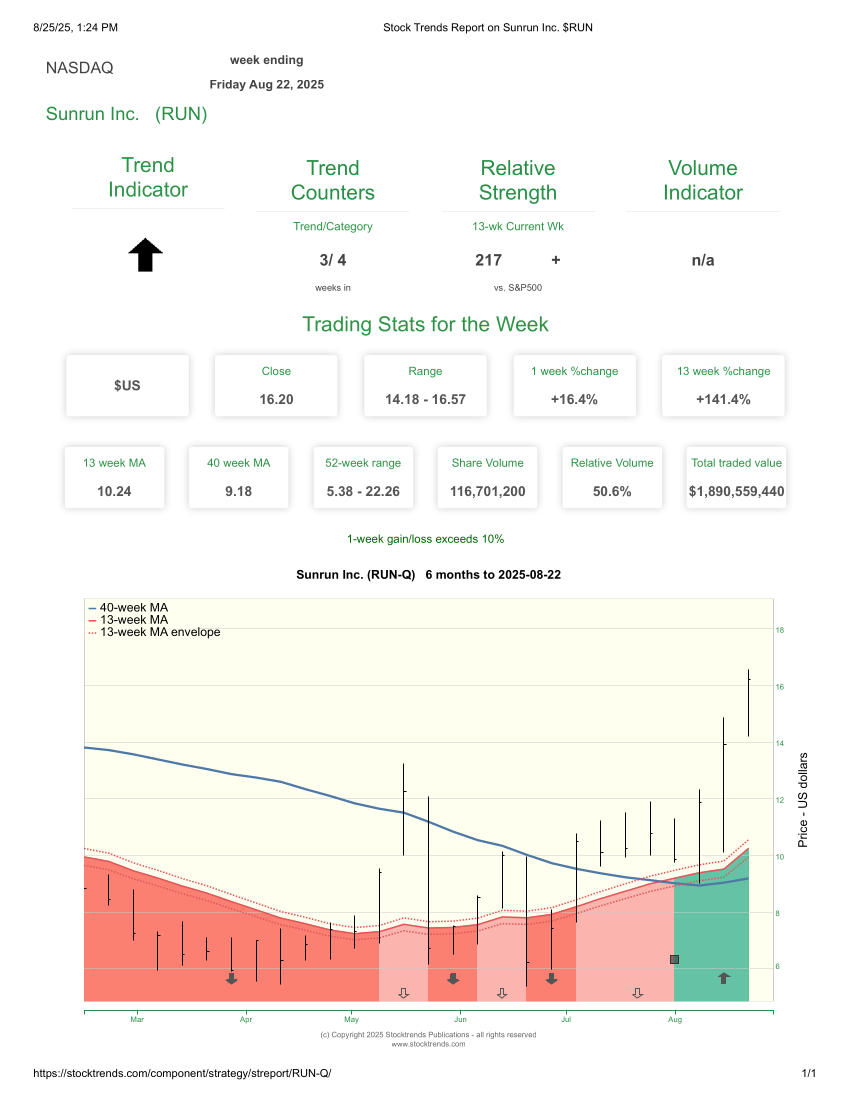
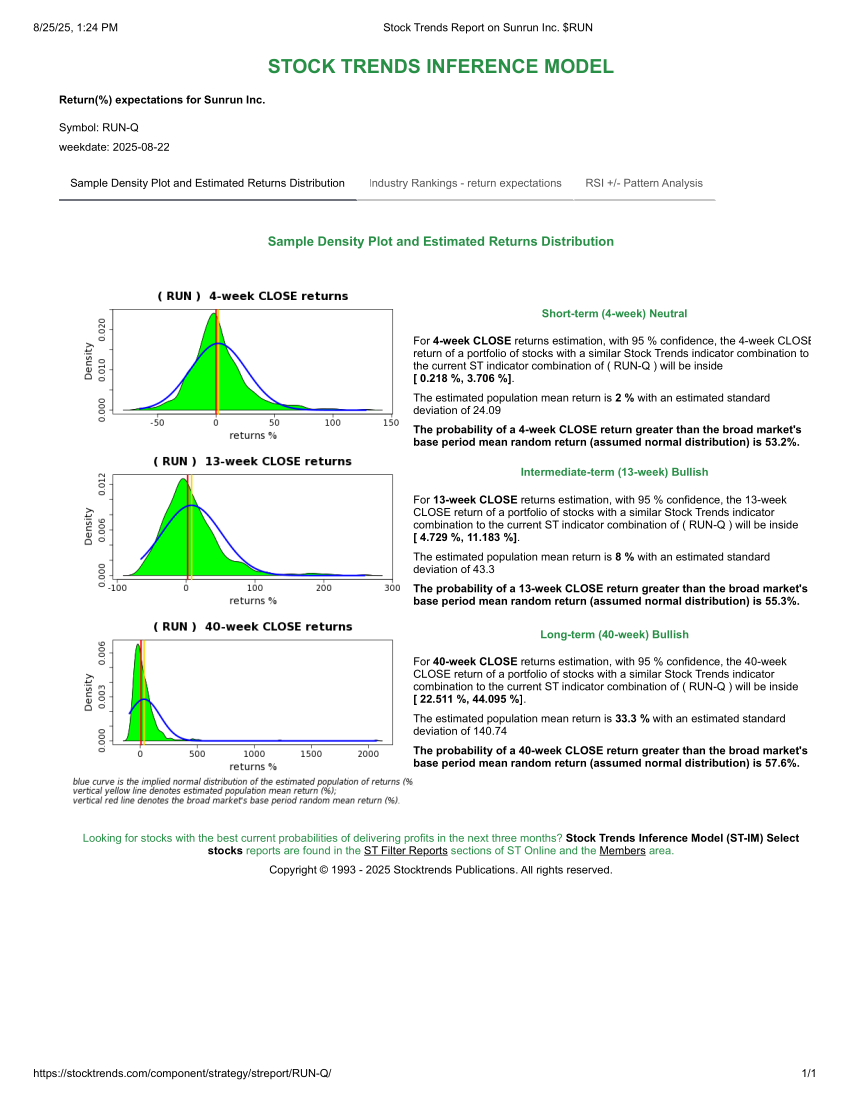
Our Aug 16 breadth piece discussed the dual energy regime, noting that both fossil-fuel suppliers and green-power developers were attracting capital. The Aug 22 dataset provides concrete examples on the renewable side. Sunrun (RUN-Q), the largest residential solar installer in the U.S., shows a bullish trend that commenced 4 weeks ago, fueled by aggressive price momentum (13-week price gain of +141.4 %). Last week's surge of +16.4 % suggests momentum is still building. Investors should also take note of the ST-IM estimates of price outperformance ahead - the 13-week and 40-week outlook is Bullish. SolarEdge Technologies (SEDG-Q), a provider of solar inverters, has been bullish for the last 11 weeks and returned +129.4 % over 13 weeks. FTC Solar (FTCI-Q) and Nextracker (NXT-Q) also register strong bullish trends and double-digit weekly gains. These names illustrate how the electrification narrative we first emphasised in mid-August is translating into persistent price leadership.
Balanced perspective and follow-up commentary
While the current Stock Trends data showcases compelling upside, we echo the cautionary tone from our August 18 editorial, Spotlight on Risk. That article filtered for stocks that were still in bullish categories but exhibited negative ST-IM 13- and 40-week projections and weakening RSI. CME Group and Stratasys were flagged because their trend ages were long, and momentum had decayed. By contrast, the resource and renewable names featured here generally combine shorter trend durations, rising relative-strength scores, and positive ST-IM estimates. Nevertheless, investors should monitor volume tags and trend counters for any sign of exhaustion. A weakening bullish (![]() ), bearish crossover (
), bearish crossover (![]() ), or declining relative-strength reading can precede price reversals.
), or declining relative-strength reading can precede price reversals.
Investors can learn to use the Trend Profile tab of Stock Trends Report pages, as well as the STWR filters focused on estimated returns over the coming 4-week, 13-week, and 40-week periods. The Trend Profile tab displays results of the Stock Trends Inference Model (ST-IM) for each stock and presents its RSI ± Pattern Analysis. These charts and the STWR filter reports quantify the probabilities that a stock will outperform its benchmark over the next 4 weeks, 13 weeks, and 40 weeks - offering valuable statistical context for interpreting the trend indicators. By reviewing the Trend Profile alongside price-based metrics of the Stock Trends indicators, investors gain insight into the likelihood of future returns and the confidence intervals around them.
Commodity comfort
Stock Trends Weekly Reporter extends the rotational themes identified in our recent articles. The Materials and Energy sectors have not only maintained their bullish breadth but have strengthened it, consistent with the Stock Trends view that we remain in an advanced yet broad bull epoch. Copper explorers like Faraday Copper build on the momentum first seen in Marimaca, while gold miners like Fury complement earlier discussions of Coeur and Ramaco. Uranium producers Energy Fuels and Ur-Energy continue to benefit from a global nuclear revival, and renewable-energy equipment firms Sunrun, SolarEdge, FTC Solar, and Nextracker are capitalising on AI-driven electricity demand. By comparing these stocks against the risk filters used on August 18 and the early breakout names spotlighted on August 11, investors can better contextualise where the strongest risk-adjusted opportunities lie. As always, Stock Trends’ objective trend indicators, relative-strength metrics, and the ST-IM probabilities serve as indispensable tools for evaluating whether momentum is accelerating or fading. We encourage readers to review the detailed STWR reports and the Stock Trends Handbook to deepen their understanding of these signals. Armed with this framework, investors can position for the next leg of the market’s rotation while staying alert to signs of weakness.
 I use Stock Trends to help direct my stock picks. Also, following the advice of Stock Trends I have religiously used stop-loss orders and have avoided hanging on to losing stocks for emotional reasons.


