Stock Trends Inference Model: A Statistical Foundation for Smarter Investing

  • 02 September 2025 |
  • Written by  Skot Kortje, Stock Trends Analyst
  • font size
  • Print

At the heart of Stock Trends is a conviction: market data is not noise, but information. For more than three decades, the Stock Trends framework has given investors a disciplined way to interpret market cycles, trend signals, and momentum patterns. The Stock Trends Inference Model (ST-IM) is the natural extension of this approach, embedding rigorous statistical reasoning into the reports available for every listed stock and ETF.

As outlined in Chapter 6 of the Stock Trends Handbook, ST-IM is designed to answer a key question investors continually face: What is the probability that a stock or ETF will outperform the market benchmark over the coming weeks? The answer is never certain—but it can be inferred systematically.

Why the Central Limit Theorem matters

One of the most powerful results in statistics, the Central Limit Theorem (CLT), tells us that when we take averages of sufficiently large samples—even if the underlying data is skewed—the distribution of those averages approaches a normal (bell-curve) distribution. The ST-IM analysis takes samples of composite Stock Trends indicator groupings, matching trends, relative momentum, and volume statistics to measure subsequent returns (price changes). 

Investment returns are well known to be skewed and fat-tailed. A few dramatic gains or losses can distort short-term distributions. Yet, as the Stock Trends database demonstrates, when returns are aggregated over time, they begin to approximate normal distributions. This is precisely why ST-IM employs the normal distribution: it is a statistically sound approximation for inferring probabilities of outperformance over multi-week horizons.

Here is a current example of the ST-IM analysis - the Bullish interpretation of future return estimates for DataDog Inc. (DDOG-Q). This analysis is presented under the Trend Profile section of every Stock Trends Report page.

Stock Trends Report on Datadog Inc. DDOG STIM

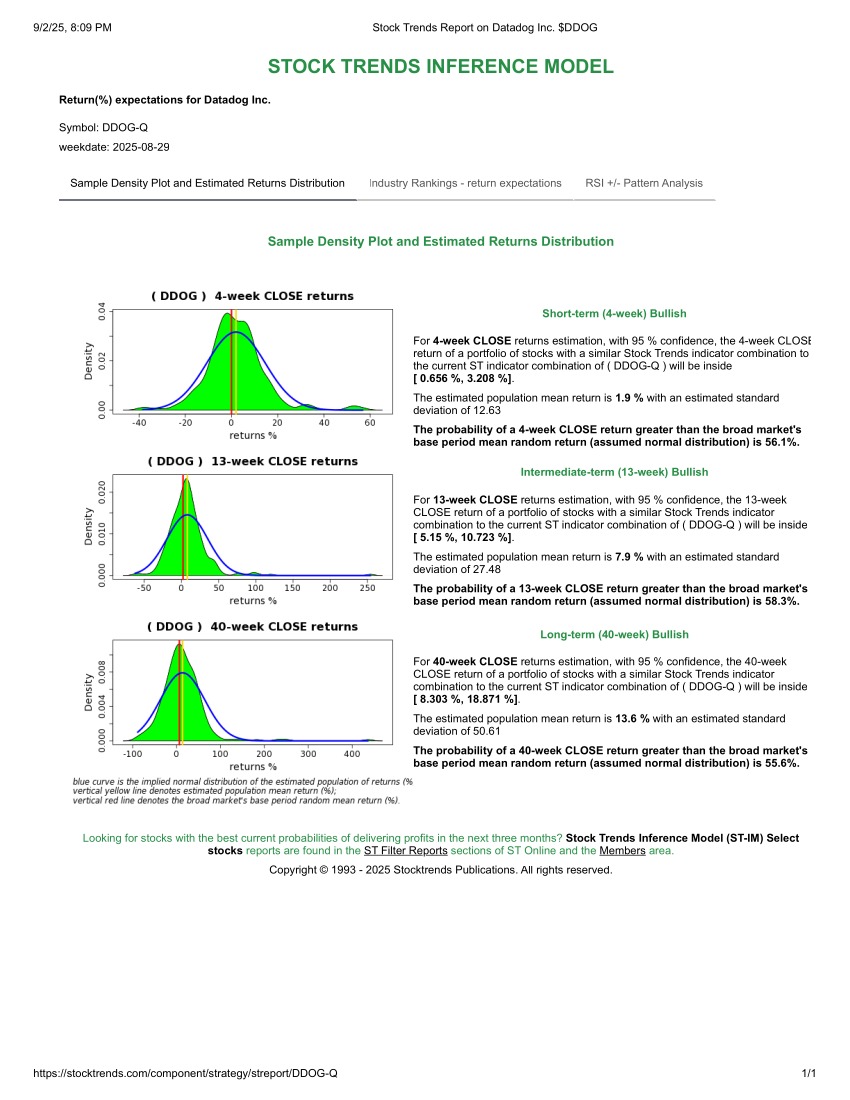
Stock Trends Weekly Reporter also helps investors filter for the best and worst returns expectations over the 4-week/13-week/40-week horizons, and find the stocks with the best probabilities of outperforming the market over the periods.

From Modern Portfolio Theory to Stock Trends

Modern Portfolio Theory (MPT) rests on the same statistical foundation. By modeling returns with a finite mean and variance, MPT makes the risk–reward trade-off (mean vs. variance) actionable. ST-IM does not replicate MPT, but it leverages the same principle: normal-based inference makes probabilities actionable. Where MPT produces an efficient frontier for portfolios, ST-IM applies inference directly to the Stock Trends trend indicators, yielding probabilistic estimates of future performance for individual stocks and ETFs.

Key idea: ST-IM uses a normal distribution as a practical, transparent approximation to translate weekly trend and momentum signals into probabilities of outperformance over 4-week, 13-week and 40-week horizons.

Beyond normality: acknowledging market realities

No investor should mistake the population of returns as truly normal. Markets exhibit volatility clustering, regime shifts, skewness, and fat tails. Post-modern finance tools—such as t-distributions, GARCH models, and extreme value theory—address these realities.

The strength of ST-IM is its practicality and clarity: a consistent, transparent, and interpretable probability measure for thousands of securities, week after week. For many investment decisions, this clarity is more useful than model complexity.

The unique value of Stock Trends Inference Reports

  • Coverage: Probability-based interpretation for every listed stock and ETF.
  • Discipline: A systematic bridge from trend indicators to forward-looking probabilities.
  • Perspective: A framework grounded in empirical observation and well-established statistical theory.

No other site presents this breadth of statistical trend analysis with an inference model integrated across the full North American stock market universe. ST-IM translates the Stock Trends methodology—trend categories, RSI +/- patterns, and momentum context—into actionable probabilities that fit directly into weekly decision-making.

Conclusion

The Stock Trends Inference Model, first introduced over a decade ago, is more than an added feature—it is the statistical backbone that elevates the Stock Trends service. By linking the principles of the CLT and MPT to the weekly signals in the Stock Trends database, ST-IM gives investors something rare: a systematic, probabilistic view of market opportunity.

That is why ST-IM Reports deserve a central place in every Stock Trends user’s toolkit. They embody the core mission of Stock Trends—to help investors navigate market cycles with discipline, probability, and perspective that no other service provides

back to top

Subscriber Testimonials

  • I have had the good fortune to be reasonably successful and enjoy the investment process. Your process would be recommended for both experts and those who are new to investing.

    Frank I., Subscriber
  • Stock Trends information is part of the base information I review before making a trade.

    Subscriber
  • Stock Trends Weekly Reporter is an easy way to pick up equities that represent an upward trend.

    Subscriber
  • You have created and maintained an amazing, highly educational program and I am grateful for your part in getting our retirement funds to the good place they are.

    Karin M., Subscriber
  • There is a lot to be gained from comparing trends of how individual stocks are doing within a sector, as well as how the sector is performing relative to the broad market.

    Dudley R., Subscriber

  • Your report is an impressive, excellent tool and I have recommmended it to friends.

    Colin E., Subscriber

  • I am something of a momentum investor. I find Stock Trends useful as I can look at my portfolio as a “watch list” and quickly see where trends are declining in strength or reversing, so it is particularly useful as a tool in portfolio management regarding sales.

    William C., Subscriber
  • Stock Trends analysis quantifies nicely the movement of individual stocks. I’ve found that if the technicals are out of synch with fundamental analysis, it is a wake-up call to make a decision. The Stock Trends Bull/Bear Ratio is useful in identifying major market bottoms and tops. It has always presented a good buying or selling opportunity.

    Charles G., Subscriber
  • I am just writing to tell you of my appreciation of your service! It makes so much sense to me. You seem to be an oasis of stability and sensibility in a stockmarket jungle.

    Adrian S., Subscriber

  • I am fascinated with your service and methodology - it is very impressive. [...] Over the years I have concluded that there are many ways to approach stock investing, but once one has chosen a path, one is better off sticking to it.

    Bob E., Subscriber

  • Hence, anyone who had followed the "Stock Trends" line should have sold their Bre-X shares and, with the windfall, paid for a lifetime subscription to The Globe and Mail and more. Talk about return on investment!

    Muni P., Subscriber

  • Thank you for your excellent work and kind approach to your customers.

    Odette C., Subscriber

  • Just thought I'd call to thank you, Skot. Stock Trends Weekly Reporter helped pay for my daughter's education!

    Peter H., Subscriber

  • I very much like the systematic approach to analyzing stock data, it fits my approach.

    Subscriber
  • I use Stock Trends to help direct my stock picks. Also, following the advice of Stock Trends I have religiously used stop-loss orders and have avoided hanging on to losing stocks for emotional reasons.

    John B., Subscriber
  • I want to thank you for posting such an excellent guide to technical analysis on the web. You have provided a great service to all of us novice investors.

    Michael C., Stock Trends user
  • I've followed a number of Stock Trends picks, and the methodology is solid.

    Doug B., Subscriber

  • I find your website and research very helpful in my stock trading. I have subscribed to several related services in the past and none present their work with “just the facts” as you. Please keep up the great work so that I can continue to learn! 

    Bryan E., Subscriber
  • I've followed your recommendations since reading your columns in the Globe & Mail, and finding they published Stock Trends arrows in their financial listings. I do find them a guide to the general market and what I should be avoiding for declining chart trends.
    Has probably saved me the subscription by not rushing into hot stocks!

    Anthony D., Subscriber
  • An admitted cynic, it's obviously very high praise when he says he likes StockTrends because of its "simplicity, utility, openness, [and] honesty," and in addition to having "no hidden agenda" is "understandably documented [and] historically verifiable." And, he adds, "It lets me see a lot of things without doing a lot of work." Globe and Mail

    Paul W., Subscriber

Subscription Plans

Subscription Plans

STWR - Monthly

$19.95

Monthly subscription plan to Stock Trends Weekly Reporter - pay your monthly subscription fees by having them automatically charged (PayPal only). Free 7-day trial period. Subscribers may cancel before the end of any subscription month.

STWR - 1 Year Prepaid Subscription

$199.00

1 Year Prepaid subscription to Stock Trends Weekly Reporter. Save 16% off monthly rate!

STWR - 2 Year Prepaid Subscription

$299.00

2 Year Prepaid subscription to Stock Trends Weekly Reporter. Save 37% off monthly rate!

STWR - 3 Year Prepaid Subscription

$399.00

3 Year Prepaid subscription to Stock Trends Weekly Reporter. Save 44% off monthly rate!

Stock Trends Editorial

  • High-Volume Leaders: A Closer Look at the Heaviest-Traded Stocks
    High-Volume Leaders: A Closer Look at the Heaviest-Traded Stocks Stock Trends’ Unusually High Volume () indicator flags stocks whose weekly trading volume is at least 200% of their 13-week average. In the October 31 weekly reports, only a small slice of the universe qualifies—making these signals rare and valuable. When high volume coincides with a bullish trend state (or a new Bullish Crossover), it can mark institutional footprints at the start of a multi-week advance.
    Read more...
  • Positioning for Opportunity: Trade Detente and Stock Trends Momentum
    Positioning for Opportunity: Trade Detente and Stock Trends Momentum The easing of tensions between the world’s two largest economies has given markets a fresh narrative. By stepping back from new export restrictions and cutting key tariffs, the United States and China have removed some of the most disruptive threats hanging over global supply chains. For investors, this détente creates a backdrop of relative stability in which powerful price trends can resume and new trend…
    Read more...
  • From Flash Crash to Rotation: The Probability–Payoff Map of a Rebuilding Market
    From Flash Crash to Rotation: The Probability–Payoff Map of a Rebuilding Market The market’s October tremor—an abrupt but short-lived flash crash—has given way to a familiar pattern in the Stock Trends framework: the rapid repair of breadth and the birth of new trends. Where panic once pressed prices indiscriminately, order is returning through a disciplined sequence of new bullish signals, rebuilding sectors, and the subtle reorganization of leadership beneath the surface.
    Read more...
  • Random Portfolios as a Benchmark: A Smarter Yardstick for Performance
    Random Portfolios as a Benchmark: A Smarter Yardstick for Performance Investors often compare performance to market indexes like the S&P 500, but traditional benchmarks have built-in biases. The S&P 500, for example, is heavily skewed toward large-cap stocks and “is not a good benchmark for measuring alpha” – it reflects a size-factor bias rather than pure manager skill. All major indexes systematically tilt toward certain factors (size, sector, value/growth, etc.), meaning they’re not truly passive…
    Read more...
View all Stock Trends Editorials


Subscription Plans

STWR - Monthly

$19.95/Month

Monthly subscription plan to Stock Trends Weekly Reporter - pay your monthly subscription fees by having them automatically charged (PayPal only). Free 7-day trial period. Subscribers may cancel before the end of any subscription month.

STWR - 1 Year Prepaid Subscription

$199/Year

1 Year Prepaid subscription to Stock Trends Weekly Reporter. Save 16% off monthly rate!

STWR - 2 Year Prepaid Subscription

$299/2 Years

2 Year Prepaid subscription to Stock Trends Weekly Reporter. Save 37% off monthly rate!

STWR - 3 Year Prepaid Subscription

$399/3 Years

3 Year Prepaid subscription to Stock Trends Weekly Reporter. Save 44% off monthly rate!