Investors must navigate uncertainty more than they understand, and much more than they want. Behind the curtain always lurks chance, no matter how smart you are.
Whether the market is bountiful and surging to new highs, or is in its current hazardous state, a wise investor must come to terms with its untamed and unknown nature. If its nature were known, if the correlations between past metrics and future trading profits were truly identified and understood, the reward associated with asset risk would dwindle. Investors live and die by market uncertainty.
We cannot truly know if the analytics peddled by the investment industry are a blueprint for the market machinations or whether they are merely constructs that attempt to put an orderly framework around chaos. That’s a hard pill to swallow for traders. We think we’re smart enough to tame the market, but maybe it just toys with us. Maybe any success traders and investors experience - and all the failure - is just plain luck.
"The investor wants to rest well on his pillow. But if he truly understands the risks implied by chaos and randomness, how can he?"
You start to give thought to this when you’re an algorithmic trader because the data jumps right back at you and nips at your ego until you are humbled. But all experienced investors who have weathered the typical ups and down of the market must also see the shadow of this bogeyman. His name is Chance. The holy divide between those that acknowledge the evidence of Chance in all aspects of our lives and those who carry on with a master delusion of rational dominance is most often the wisdom of experience.
If you have not read Leonard Mlodinow’s 2008 popular book The Drunkard’s Walk: How Randomness Rules our Lives, I’d certainly recommend it to investors. It’s easy to fall under the spell of obviously intelligent market gurus who impress upon us their mastery of the market. However, if you dare look past the smoke and mirrors, the business of the markets is pure Oz, as in the wonderful wizard. Bedtime stories told by sages and talking heads - all aimed at placating our need for certainty and understanding in a complex and dynamic market. The investor wants to rest well on his pillow. But if he truly understands the risks implied by chaos and randomness, how can he?
Everyone wants to invest with confidence. Most investors, big and small, simply want confidence that they will not lose. Unfortunately, guarantees of such a result are misinformed and misguided. History is littered with evidence of this. Long Term Capital Management’s collapse in the 1990s is just one large and public example of many cases where “genius has failed”. Indeed, the whole investment business is built on the idea of “security” as an achievable result and a marketable ideal, if not product. After all, even trading instruments are called securities.
"Now the path to growing investment capital necessarily involves markets, leverage, synthetic securities, and a whole lot more risk than your grandfather took with his hard-earned savings."
This marketing nomenclature of financial institutions is built on foundations of trust, so it’s easy to see the incompatibility of randomness with the investment business as most investors know it. Instead randomness is a dark secret that is only whispered in the papers of academic market theorists and, quite often, pragmatic heretic traders who have abandoned 'The Street’ and taken to the investment wilderness.
Some reconcile their conflict but insisting there are only “aspects of randomness” in the market, and that orderly relationships guide market valuations. There are frameworks that attempt to meld the Efficient Market Hypothesis with behavioral economics and variations of the Random Walk Theory (Mukul Pal has presented a helpful paper that elaborates on this Adaptive Market Hypothesis), but taming chaos is a fool’s game. Sure, sometimes the fool is brilliant, witty beyond repair, but every fool ultimately discovers the shallowness of his sage wisdom - that he is but knee deep in a vast, dark and deep ocean of reality.
On that sombre note we return to the task at hand: financial survival. Most investors can’t be bothered to contemplate randomness in the markets any more than we can contemplate the vastness of our physical universe. We are not all physicists (although maybe you are!). Investors are simply trying to grow their savings. Unfortunately, in the current world of ZIRP (zero interest rate policy) and NIRP (negative interest rate policy!) savers are, essentially, persona non grata.
"There might be chaos and lurking catastrophe, but until the game is up investors must take measurable risks - risks larger, in truth, than we calculate - and come out winning."
There’s no easy investment route to the victory line now. No deposit account, no guaranteed investment certificates, no Government bond, no fixed income instrument that will take you from point A (a hard working middle-aged, middle class saver) to point B ( a retired middle class spender) in the comfort of compound interest any longer. Now the path to growing investment capital necessarily involves markets, leverage, synthetic securities, and a whole lot more risk than your grandfather took with his hard-earned savings.
Whether you are entirely invested in a large public pension or scrambling between trades with your online brokerage account your financial future is now dependent on the returns you or your financial institution can extract from equity, commodity and derivative markets. Modern monetary policy - guided by the doctrine of fiat money, and the public abuse of those institutions built on the framework of fiat money - has hijacked the saver. Modern portfolio theory drives the investment framework, but the rules of the game are set on the monetary foundation. That’s why markets are suchs pigs for the Fed’s spiggots.
If you understand these references, you will know that the markets are now more tenuous than many investors realize. The mother of all debt crisis is not real, until it is. Everyday investors cannot really prepare for it anyway. As such, investors have no choice but to wake up every morning and face the markets with determined faith. There might be chaos and lurking catastrophe, but until the game is up investors must take measurable risks - risks larger, in truth, than we calculate - and come out winning.
"You will find that the returns expectations for most stocks match the expectations we would have if we randomly chose a stock at a random time. This implicitly reflects the random bogeyman, or Mr. Chance as we might call him."
The investor has to pick an analysis framework and go with it. Whether gilded guidance from high-priced institutional analysts or your own back-of-the napkin calculations and hunches, most investors look to master the market because they believe they can. While this editorial is apostate to the investment industry narrative, there’s no sense in dissing an investment faith, especially if that faith results in a positive outcome. If it works - great! Just don’t put more faith in your analysis framework and sources than it deserves, which is very little.
You’re here because the systematic approach of Stock Trends agrees with you. Certainly, you’re not here because of the bedtime stories. Stock Trends offers no inside information, no scalpels to dissect the financials or marketing plans of Apple, nor the petroleum reserves of Chevron. It offers no cogent analysis of macroeconomic and geopolitical factors weighing on the stock market. All those fundamental nuggets of information make for weighty chapters of market bedtime stories, but must be found elsewhere.
If you are expecting a massive tool chest of technical indicators, Stock Trends will also disappoint. No multiple moving averages of daily and intraday periods or gymnastic technical indicators are found on the Stock Trends website. Of course, there are a myriad of other trend following technical sites offering trading signals for day traders, swing traders and position traders. And all hugely profitable! At least that is what they claim. But most of these sources offer very little in the way of true statistical evidence supporting their claims. Without that evidence you can’t be too sure of any solicitation. And even if a trading system delivered in the past - will it deliver for you now?
This is why I developed a statistical model for the Stock Trends indicators. The Stock Trends Inference Model and the Stock Trends RSI +/- Pattern model are attempts at find trading guidance directly from the data presented here weekly. These weekly statistical reports tell us whether a particular stock or ETF currently exhibits trend and price momentum characteristics that have a better statistical probability of rising or falling in the immediate 1-week, 4-week, 13-week and 40-week periods ahead than our base expectation for any stock or ETF.
You will find that the returns expectations for most stocks match the expectations we would have if we randomly chose a stock at a random time. This implicitly reflects the random bogeyman, or Mr. Chance as we might call him. However, sometimes the needle moves and indicates a result that deviates from the expected return of a random outcome. Sometimes the distribution of returns indicate a possible future return that is either better than the benchmark random return (a bullish signal) or worse (a bearish signal). In either case, the needle generally does not move considerably - certainly not enough to give anything near certainty. But it does move enough to improve the probability of an outcome in a statistically significant measure.
"There might be all kinds of reasons to be bullish on AAPL right now. However, this analysis tells you that if your reasons for being bullish on AAPL are misguided, mis-timed, or meaningless (in the way that all analysis would be meaningless in a world of randomness), your chances of success are statistically impaired - at least as far as the framework of the Stock Trends Inference Model can describe."
Let’s look at this week’s analysis as an example. The Stock Trends Report for Apple Inc. (AAPL) shows us that the stock of millennials' favourite company rallied a bit last week, but is still in a Stock Trends Bearish trend category. The share price has moved above the secondary trend line, but shares have still underperformed the S&P 500 index by about 9% measured over the past three months. What does this Stock Trends Inference Model have to say about future return expectations?
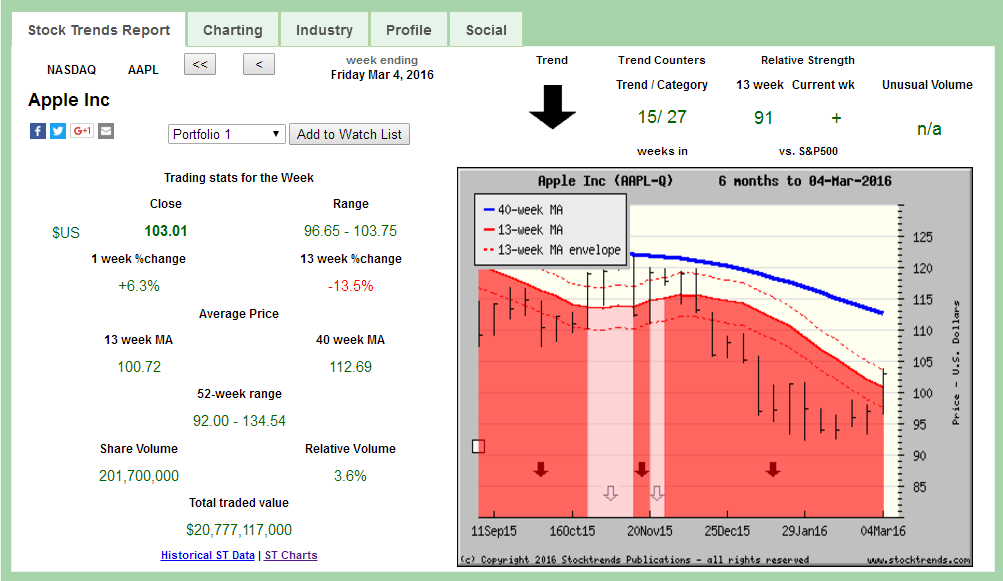
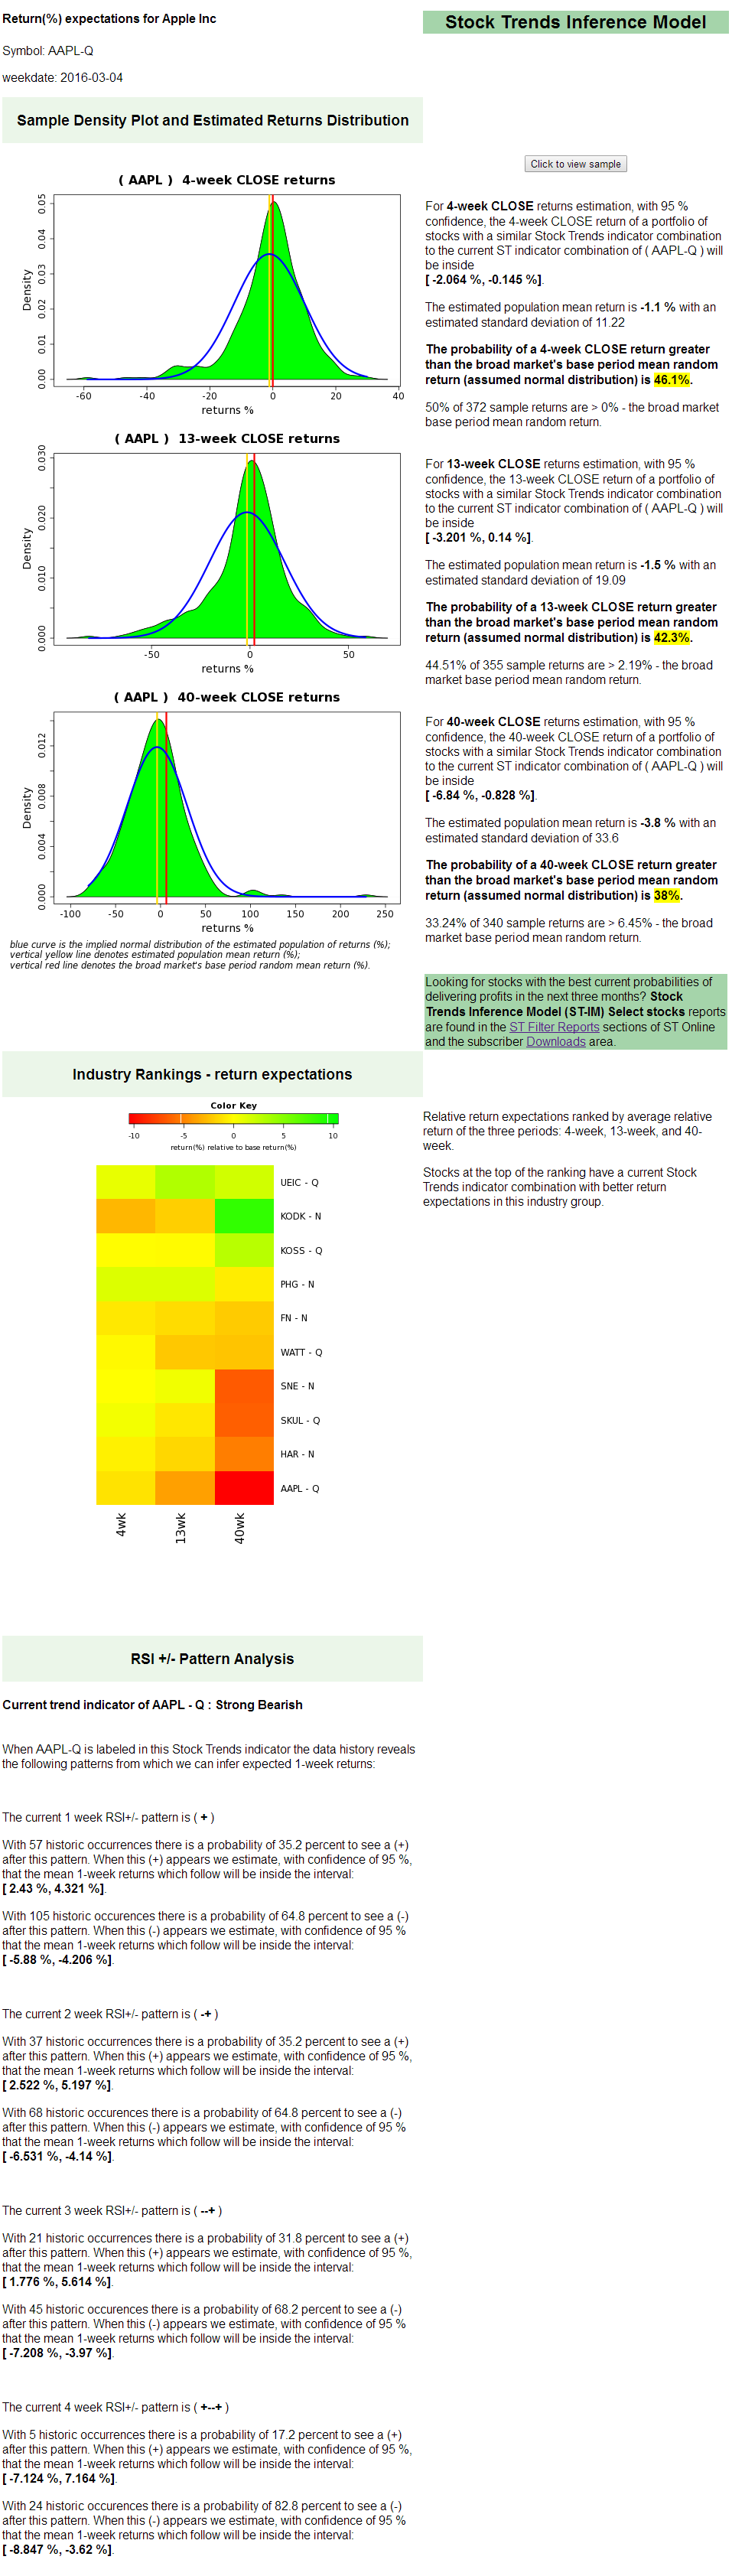
Presently, the market condition described by the Stock Trends indicators confirms a further bearish move by AAPL. Short term (1-week, and 4-week) return expectations are lower than the mean random return expectations. Longer-term expectations (13-week and 40-week) are also bearish - lower than an expected return of a randomly selected stock.
Of course, this hardly excludes the converse possibility that AAPL rallies and reverses trend. There might be all kinds of reasons to be bullish on AAPL right now. However, this analysis tells you that if your reasons for being bullish on AAPL are misguided, mis-timed, or meaningless (in the way that all analysis would be meaningless in a world of randomness), your chances of success are statistically impaired - at least as far as the framework of the Stock Trends Inference Model can describe.
 I have had the good fortune to be reasonably successful and enjoy the investment process. Your process would be recommended for both experts and those who are new to investing.


