There may be a swell in stocks categorized as Stock Trends Bullish in the coming weeks, but the moment is not yet here for investors to consider the current bearish sentiment left for dead.
North American benchmark indices have been labeled Stock Trends Weak Bearish for more than a month now, an encouraging sign that the markets might rally enough to set course for another crack at a bull market. But trend following investors should not get ahead of the market signals - there is good reason to remain uneasy with signs of a reversal yet. Although there are sector momentum trading opportunities - as investors in mining stocks are most happily enjoying - the broad market sentiment remains categorically bearish.
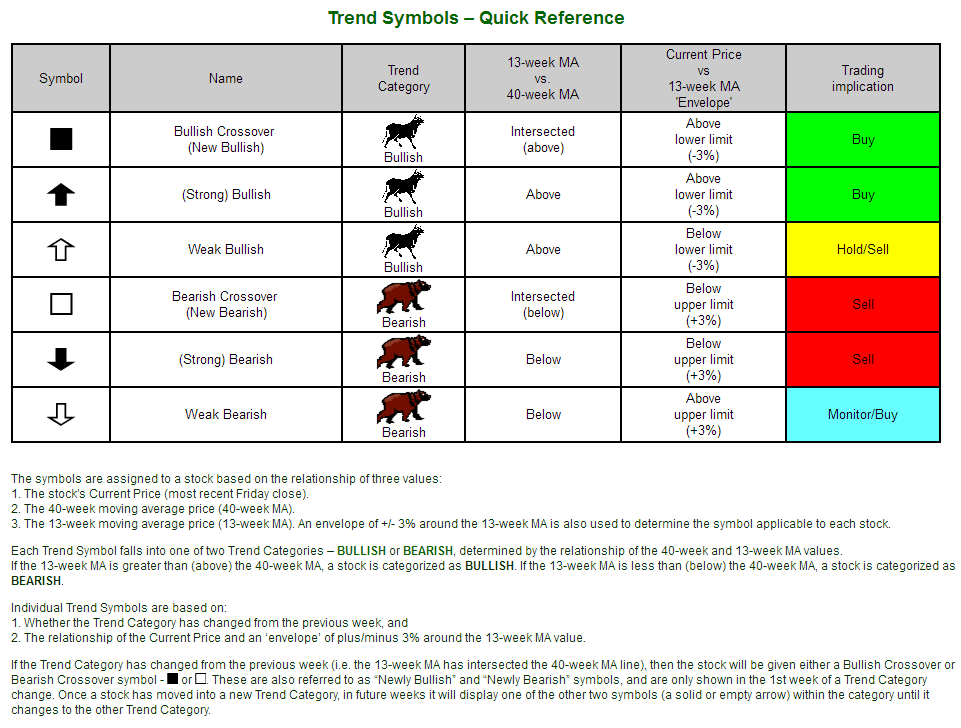
When we label a market as categorically bearish or bullish by necessity we must define each trend category. It is only when one category’s defined parameters are transgressed that that we can say that the market has shifted from bullish to bearish, or vice versa. So what are those parameters?
Stock Trends categorizes market price trends using simple moving averages to smooth out price patterns. Whether indicating a market is bullish or bearish will depend on long-term price trends. Changes in trends don’t come quick or easy. Fundamentally, a trend following device is always looking to confirm a particular trend or change in trend.
The primary trend line employed here is the 40-week moving average, which very nearly equates to the 200-day (trading days) moving average. The 40-week average price gives us a statistical valuation of a market over a sufficiently long-term period for swing traders or longer-term market timers. It gives a base from which we can measure shorter term price movement.
The relative short-term prices Stock Trends measures is the 13-week average price (equating to a 65 trading day period). In Stock Trends categorical system markets with a short-term average price that is greater than the long-term average price is categorized as a bullish market. Markets where the short-term average price is below its long-term average price is bearish.
These bullish and bearish trend categories are simple designations based on historical average prices. But the current price has something to say about these price trend categories. In the Stock Trends framework the current price of a market qualifies a prevailing long-term trend. For a Bullish trend category a current price that is above the short-term average price confirms the Bullish trend category and is called a strong Bullish indicator.
However, if the current price is below the short-term average price, the Bullish trend category is compromised and is called a Weak Bullish indicator. For Bearish trend categories, current prices below the short-term average price confirms the Bearish trend (strong Bearish indicator), while a current price above the short-term average price compromises the Bearish trend category and is called a Weak Bearish indicator. Along with the markers of changes in trend category (the Bullish Crossover and the Bearish Crossover) this is the basic trend apparatus used by Stock Trends.
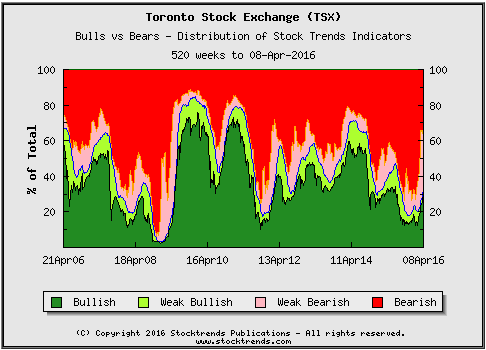
So how does the North American stock market now break down in terms of these categories? First we’ll look at the Toronto market, which is naturally highly concentrated in commodity stocks and deserving of its own interpretation. Below is the current distribution of these six trend indicators on the TSX, a graphical look at the changes in distribution over recent months, and a graph depicting the changes in trend distribution over the past 10-years.
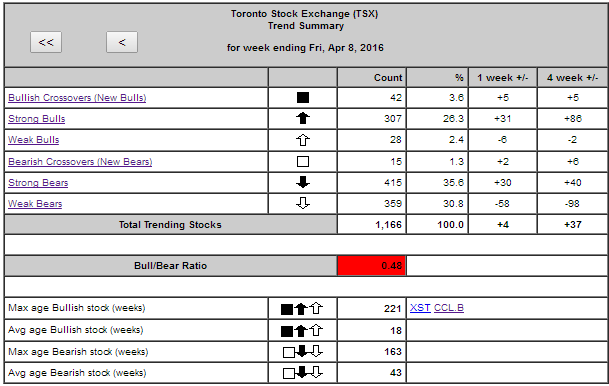
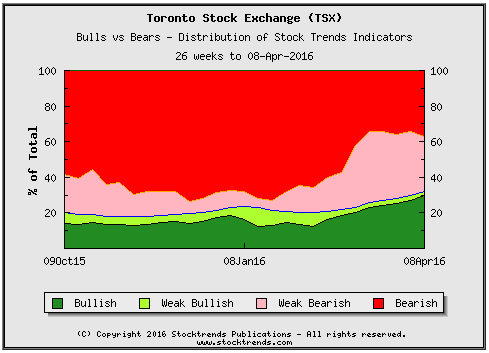
Since the beginning of the year the changing distribution has been positive - a growing proportion of Weak Bearish stocks that should feed a steady improvement in the number of strong Bullish stocks. However, only 32.4% of stocks are now categorized as Bullish. Indeed, with a Stock Trends Bull/Bear Ratio of just 0.48 we can be assured that despite the robust turn in certain important sectors, the broad market is still rooted in a bearish sentiment that will not shake off easily.
The Canadian market is unquestionably resource driven, and the current outperformance of the materials and energy sectors stands as a welcome marker for investors long suffering a bear market in these breadbasket commodity groups. It’s no secret that Canadian broad market index investors inherently place trifecta bets of win, place, and show on commodities. That’s just the nature of the Canadian stock market.
A look at the comparative performance of materials and energy stocks over the last quarter seems an enthusiastic foundation for future returns heading into the summer months. Materials stocks are outperforming the broad market by 13 per cent in the past three months, while energy stocks have logged a 7 per cent premium over broad market returns.
Given the relative size of these two sectors in the Toronto market, this price momentum shows also shows up in the distribution changes of the trend categories on the TSX. However, a longer term perspective informs us that we are a ways off from a more positive ‘rising tide’ bullish breadth. And that, of course, is the investor comfort zone. When there is broad-based bullish sentiment positive investment returns are almost self-fulfilling. When the bullish sentiment is stifled or muted the markets are tough on market timers: the stockpicker rides the market like a cowboy at a rodeo - sometimes looking good, but mostly tasting dirt.
How do broad market price movements correlate with broad bullish market sentiment on the TSX? The graph below answers that question.
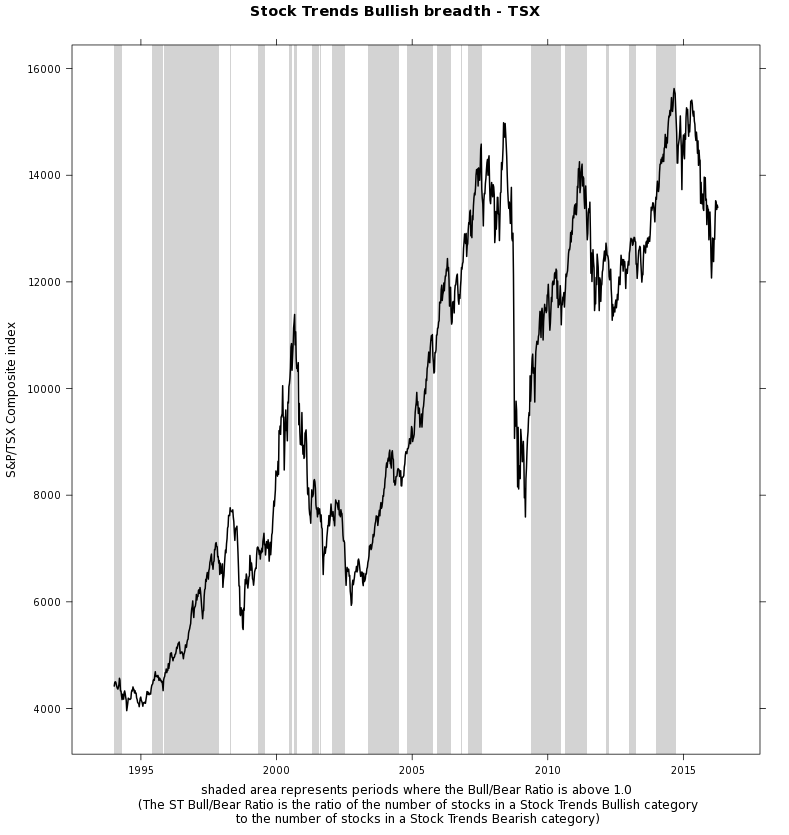
The price level line is the value of the S&P/TSX Composite over the period from the beginning of 1994. First, investors should know that the S&P/TSX Composite is and always has been a bit of a strange beast as far as a price level indicator for the broad market. Reflecting the resource base of the Canadian economy, materials and energy sector stocks account for about 30% of the weighting of the S&P/TSX Composite Index. By comparison the S&P 500 index only alots about a 10% weighting for materials and energy sector stocks. Clearly, the price level of the S&P/TSX Composite more generally reflects the valuations of the resource sector stocks - a suitable reflection of the Canadian economy, but not representative of global sector weightings.
However, there have been times that the benchmark Canadian index has been hijacked by a large market cap flyer. Think Nortel Networks Corp. back in the late 1990s when its valuation soared to such an extent that it accounted for about 45% of the benchmark TSX index. That aberration is reflected in the graph below around the period of 1998-2000. In any case, whether the index is equal weighted or not the S&P/TSX Composite price level is proportionally representative of commodity stocks, just as the broader listings of the TSX are proportionally populated by stocks from these sectors - 35% of TSX common stock listings are in resource sectors. It is not a typical definition of a broad market index, but that is the nature of the Canadian economy and the TSX.
Understanding that aspect of the S&P/TSX Composite Index, the graph above shows how periods of bullish market sentiment (the shaded areas representing periods where the total number of stocks in a Stock Trends Bullish category outnumber those in a Stock Trends Bearish category) correspond to price level changes in the S&P/TSX Composite Index.
Some things we notice:
- The sweet spot for market returns is when broad market price level advances are supported by bullish trend breadth.
- When the breadth of bullish trends diminishes the broad market price level is at risk of falling.
- Sometimes the broad market price level advances are not supported by breadth of bullish trends or sentiment. The 1998-2000 divergence period is related to the disproportionate influence of Nortel Networks in the benchmark index. The 2006-2007 period is another example of when the breadth of bullish trends did not correspond to the price level advances of the S&P/TSX Composite index.
- The current situation remains notably short on bullish breadth and indicates vulnerability to more downside weakness of the broad market price level.
The message here for Canadian investors in the domestic market: stand at attention. There are opportunities to trade volatility and capture sector strength, but that is for the active, engaged trader. For more passive market timing investors the Canadian market is not yet inviting.
How does the U.S. market compare? The NYSE has the following trend category statistics:
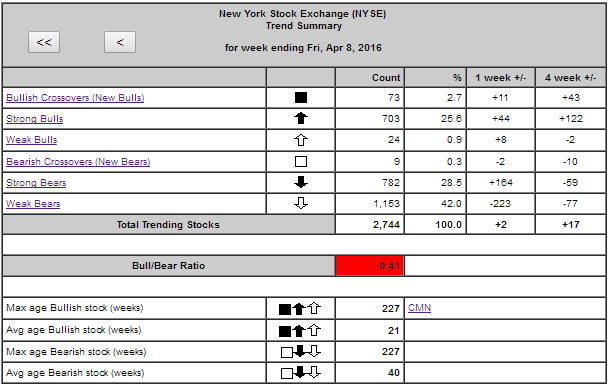
Notably the percentage of stocks with a Stock Trends Weak Bearish indicator is significantly greater on the NYSE than on the TSX. Currently, 42 per cent of common stocks listed on the NYSE are Stock Trends Weak Bearish. We can see how the Weak Bearish indicators have grown in recent months, although the current NYSE Bull/Bear Ratio, at 0.41, is showing that most stocks are still in a Bearish category:
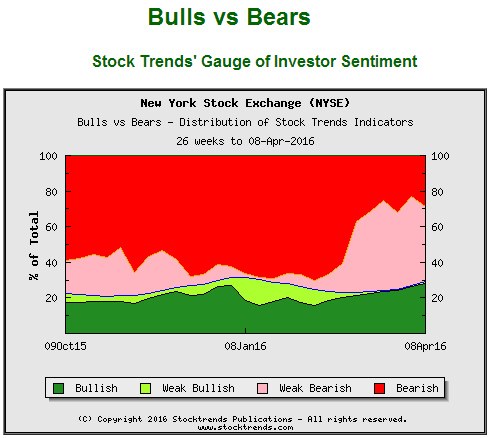
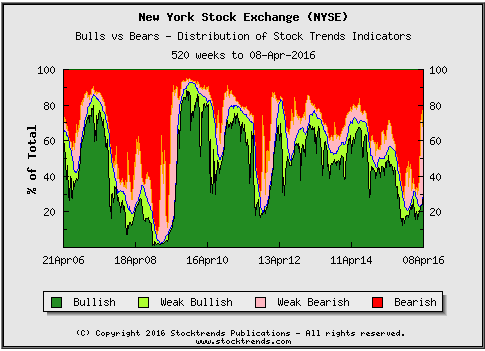
Below the 10-year area graph of the Stock Trends indicator distribution on the NYSE shows that when the number of Weak Bearish stocks reaches this level a period of Bullish sentiment generally follows. That is the nature of the Stock Trends Weak Bearish indicator: it usually alerts to an impending change in trend category from Bearish to Bullish. As such, failing a swift market collapse we should expect a steady stream of Bullish Crossover in this second quarter of 2016.
Let’s look at the way the S&P 500 index price level has moved over the past decade when the bullish breadth is positive - which still awaits that pending stream of Bullish Crossovers. Below the shaded areas represent periods when the aggregate number of stocks on the NYSE and the Nasdaq in a Bullish category outnumber those in a Bearish Stock Trends category.
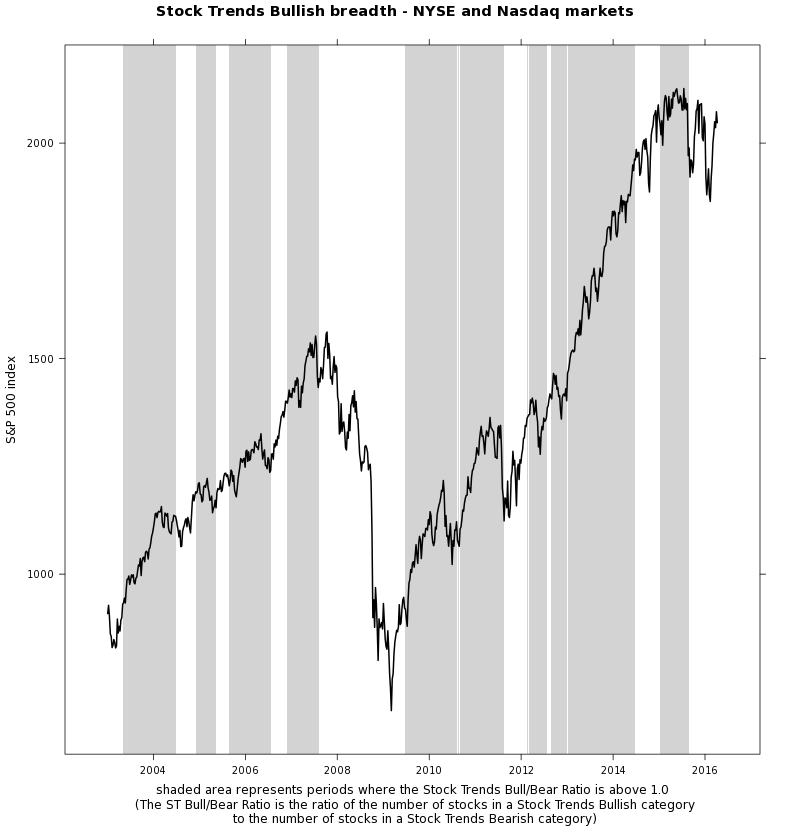
Here we see a more obvious correlation between aggregate Bullish trends and changes in the benchmark index price level. Trend followers typically surrender early bull trend rallies and the trading profits that go with them. However, the graph shows periods where investors have the benefit of a bullish market trend in their corner. Those shaded areas represent the rising tide that lifts all boats.
There may be a swell in stocks categorized as Stock Trends Bullish in the coming weeks, but the moment is not yet here for investors to consider the current bearish sentiment left for dead. It’s still a stock picker’s period - sector and stock specific trading that requires both nimbleness and luck for an investor to succeed in long-term. Investors can’t expect much until the markets again are buoyed by a categorical change to broad bullish trends.
 Stock Trends Weekly Reporter is an easy way to pick up equities that represent an upward trend.


