Understanding our assumptions

  • 04 March 2014 |
  • Written by  Skot Kortje, Stock Trends Analyst
  • font size
  • Print

The Stock Trends Inference Model is built around two central premises. These assumptions are crucial legs on which technical analysis stands.

The Stock Trends Inference Model is built around two central premises: (1) market conditions are non-specific to a particular security, and (2) market responses to market conditions are specific. These assumptions are crucial legs on which technical analysis stands. They state that price and volume patterns are homogeneous across markets – that a bull trend in one instrument is comparable to a bull trend in another, for instance – and that future price movements can be inferred or extrapolated from these patterns. Let’s better understand this analysis departure point.

The first premise might strike you as more of a theoretical foundation than an empirical one. How can we really say that market conditions – however defined – are structurally consistent among all stocks? How can the market conditions, at one point in time, of a highly liquid financial stock like Bank of America (BAC-N), for instance, compare to that of a technology stock like EchoStar Corp. (SATS-Q) or an industrial stock like Illinois Tool Works (ITW-N) at other points in time?
 
Average daily trading volume of BAC is over 100 million shares, while average daily trading volume of ITW is about 2.1-million shares and SATS only trades about 250,000 shares a day. The market cap of BAC is $175-billion. The market cap of ITW and SATS is $35-billion and $4.5-billion, respectively. There are significant differences in the size of the market for these stocks, and even bigger differences if we looked at small cap stocks that could be grouped with BAC based on our definition of equivalent market conditions – that is, similar Stock Trends indicator combinations. And certainly these stocks are different beasts in terms of their industry categories. Are price trends and price momentum in these various markets comparable?
 
"?It matters less that the market for the security is the size of BAC or the size of SATS – the same relative responses determine the change in price. "
 
When we say that market conditions are non-specific to a particular security we mean that the price mechanism balancing demand and supply is analogous, even if the range and scope of factors influencing that balance differs. Technical analysis places priority on price and volume change factors as inputs influencing a market equilibrium. Investors respond to the market through various signals of price, market breadth, and trading intensity. These market conditions are dynamic, constantly shifting the balance of supply and demand to a new equilibrium.
 
So, if the shares of Bank of America have been trending positively for two years but the relative price momentum over the most recent three month period is market-neutral – as the current BAC Stock Trends Report infers - we can say something qualitative about the return expectations of investors in BAC. Investors key on past returns - their stability as well as trajectory. As the character of returns change – increased volatility and trading volume, or diminished price momentum, for example – the relative demand for and supply of a security changes. It matters less that the market for the security is the size of BAC or the size of SATS – the same relative responses determine the change in price. Shareowners who want to capture returns or limit losses sell. Investors who see more value buy.
 
Because the Stock Trends indicator combinations codify a market condition (by categorizing trend, quantifying the length of trend and relative price momentum) we can apply our assumption about the non-specificity of market conditions and group indicator combinations. It is from these samples of ‘like’ indicator combinations that we can apply statistical inference methods.
 
However, we are applying these inference methods on a statistic of the sample – that is, subsequent returns (changes in price).  Here we are invoking our second premise – that market responses to market conditions are specific. The qualitative conditions of a market are assumed to be an input variable. The subsequent change in price is said to be a response variable. The measurement of that response is the key component of the Stock Trends Inference Model. We want to know which market conditions result in the best response – the best probabilities of higher returns.
 
This approach is quite different from the typical technical analysis you will find. Much of technical analysis has to do with time series analysis. In its most generic, simplest form you will recognize this as classical charting techniques. Indeed, trend and price support lines are tools used to extrapolate price trajectory. This is the form of technical analysis that presents opinions about price objectives. It is the technical analysis that prognosticates about where the market is headed.
 
 
The Stock Trends inference Model departs from this kind of conjecture. Instead, it is a quantitative apparatus that suggests responses to market conditions are random, but centered around categorized populations. The model employs the trend categories and market metrics (RSI, volume indicators, etc.) as inputs, but its output is a probability statement. Elements of charting go in…but what comes out is a probability distribution. A stock is ranked highly not because its chart characteristics suggest it will rally. It is ranked highly because its probabilities of beating the market are favourable.
 
Previous editorials have emphasized the randomness of results. Also highlighted is the generalized assumption of a normal distribution of returns, which is the inherent distribution of random data. Evidence of randomness seems to challenge our second premise. How can we infer future price movements with such evidence? Much of technical analysis does not address this question. Indeed, the answer to it has to come from a quantitative science. The Stock Trends Inference Model attempts to reconcile with randomness by assuming it implicitly. It does that by inferring a normal population distribution. From this distribution we can calculate statements of probability.
 
Ultimately, the goal of this analysis is to provide a new ranking system. The system will allow us to evaluate existing Stock Trends reports like the Picks of the Week, or the Newly Weak Bearish reports. New reports can also be generated. These will highlight select stocks and ETFs with the highest probability of generating returns that are better than those expected for randomly chosen stocks.
 
Below is a heatmap and associated table of the current top 30 ‘select’ stocks based on this ranking system. The colour coding shows us which have higher mean returns relative to the expected returns of randomly selected stocks for 4-week, 13-week, and 40-week periods. The scale of green intensifies as the mean return exceeds the period base return (4-week: 0%, 13-week: 2.19%, 40-week: 6.45%). Mean returns in the immediate area around the period base return are yellow, while mean returns below the period base returns intensify in redness as they sub-perform (this group is comprised of superior performers, so red codes will be largely absent).
 
To qualify for this select list the lower band of the 95% confidence interval of the population mean must exceed the mean returns of randomly selected stocks. Statistically this tells us that we are confident that there is only a 2.5% chance that the mean return of the inferred population is below the period base return. From this group we derive the normal probability distribution using the population mean and standard deviation, and then calculate the probability that a return will exceed the period base return. Stocks are ranked in descending order of the probability they will out-perform the 13-week base period return.


Stock Trends Inference Model

Current Select stocks


Trend

Issue

Price($)

% chg

Vol(00s)


Computer Modelling Group (CMG)
30.04
2.0
2111
 
Caesar Stone Sdot Yam (CSTE)
59.12
9.9
13290
 
GAMCO Global Gold, Nat. Res. (GGN)
10.11
0.3
25165
 
Energy Transfer Partners LP (ETP)
55.53
3.3
52522
 
KapStone Paper and Packaging (KS)
31.79
2.5
30209
 
Lydall Inc. (LDL)
20.26
1.2
2441
 
Tahoe Resources (THO)
25.98
5.7
8695
 
ITC Holdings (ITC)
102.60
-1.2
17922
 
ECA Marcellus Trust I (ECT)
8.85
-2.4
4351
 
Aluminum Corporation of China (ACH)
8.93
-5.7
4646
 
iShares MSCI Canada E.T.F. (EWC)
29.18
0.7
48455
 
HomeAway, Inc. (AWAY)
45.87
-3.9
116454
 
Discovery Laboratories (DSCO)
2.64
3.5
45282
 
Universal Electronics (UEIC)
41.79
4.2
6093
 
CVS Caremark (CVS)
73.14
2.7
276007
 
Resolute Forest Products (RFP)
22.78
-4.6
103
REX American Resources (REX)
47.68
13.2
2776
 
Guggenheim 500 Pure Growth ETF (RPG)
74.91
1.5
9223
 
Investors Bancorp (ISBC)
26.52
3.8
13827
 
j2 Global (JCOM)
51.40
5.0
18158
 
Credit Suisse Group (CS)
31.37
-0.3
49564
 
Old National Bancorp (ONB)
14.03
4.7
36613
 
Covance Inc. (CVD)
103.56
0.8
15274
 
Goodyear Tire (GT)
26.87
1.2
201723
 
Noble Energy Inc. (NBL)
68.76
2.8
129630
 
EPAM Systems (EPAM)
41.93
0.1
14279
 
NTS Realty Holdings LP (NLP)
8.43
0.6
564
 
Guidewire Software (GWRE)
53.61
4.2
15058
 
Targa Resources Corp. (TRGP)
96.76
0.8
13167
 
Synergy Resources (SYRG)
10.59
5.2
30837


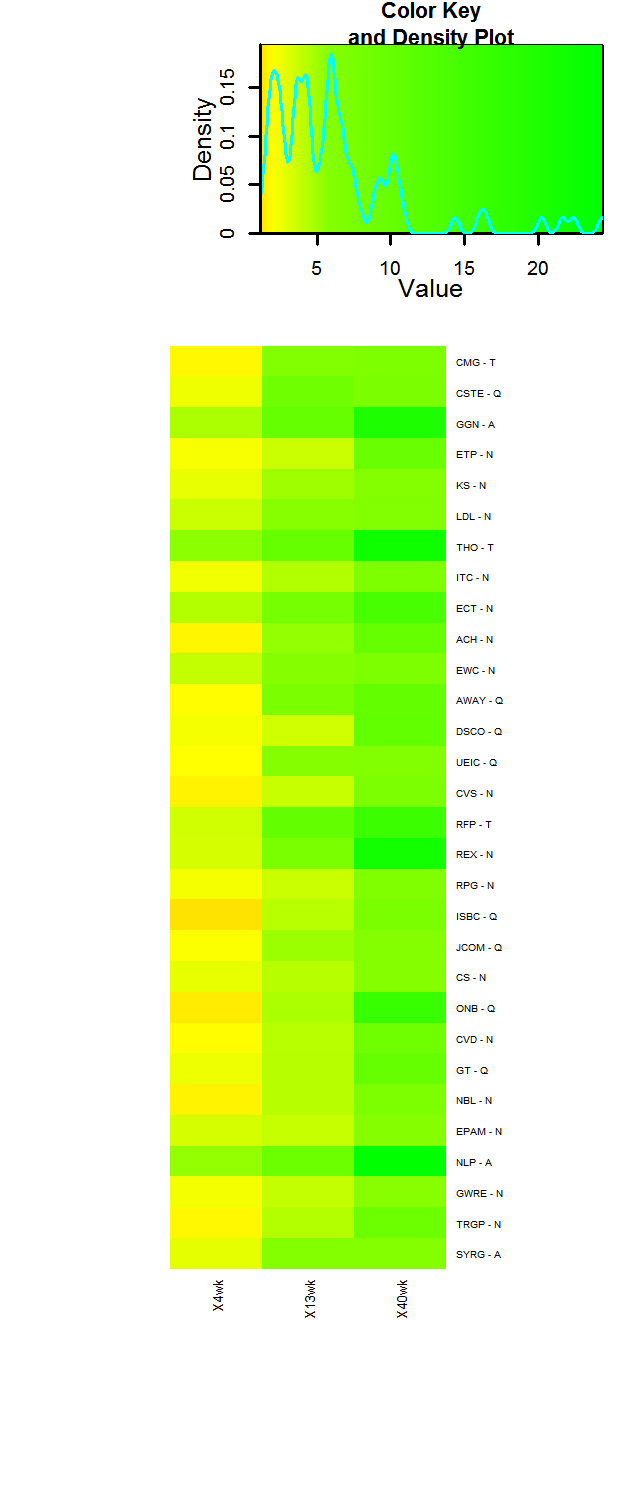
Below is the distribution curve of 13-week returns of stocks with similar Stock Trends indicator combinations to the current Stock Trends Report on Computer Modeling Group (CMG-T), the top stock in this select list.  We can see how favourable the probabilities are for CMG to return above the base 13-week random return of 2.19%, represented by the red vertical line. 


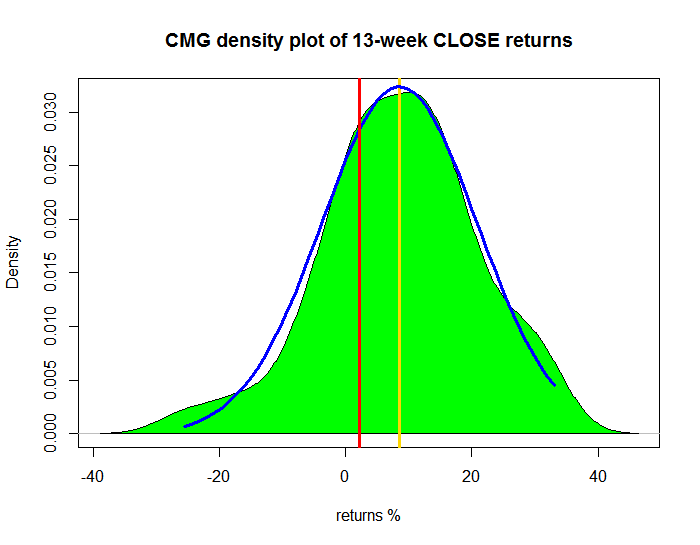
For 13-week returns distribution estimation, with 95 % confidence, the 13-wk mean return of the population of stocks with a similar Stock Trends indicator combination to CMG-T will be inside [ 5.59 %, 11.492 %].

Mean return 8.54% and standard deviation of 12.58

Assumed Normal Distribution:
For 13wk CLOSE P(Return > 2.19%)= 69.32% chance CMG will outperform the base return of a randomly selected stock. In the estimated population distribution (blue normal curve), all values to the right of the vertical red line at 2.19% are positve outcomes.

68.63% of sample returns are > 2.19%


back to top

Subscriber Testimonials

  • You have created and maintained an amazing, highly educational program and I am grateful for your part in getting our retirement funds to the good place they are.

    Karin M., Subscriber
  • Stock Trends analysis quantifies nicely the movement of individual stocks. I’ve found that if the technicals are out of synch with fundamental analysis, it is a wake-up call to make a decision. The Stock Trends Bull/Bear Ratio is useful in identifying major market bottoms and tops. It has always presented a good buying or selling opportunity.

    Charles G., Subscriber
  • Just thought I'd call to thank you, Skot. Stock Trends Weekly Reporter helped pay for my daughter's education!

    Peter H., Subscriber

  • I am something of a momentum investor. I find Stock Trends useful as I can look at my portfolio as a “watch list” and quickly see where trends are declining in strength or reversing, so it is particularly useful as a tool in portfolio management regarding sales.

    William C., Subscriber
  • I've followed a number of Stock Trends picks, and the methodology is solid.

    Doug B., Subscriber

  • Hence, anyone who had followed the "Stock Trends" line should have sold their Bre-X shares and, with the windfall, paid for a lifetime subscription to The Globe and Mail and more. Talk about return on investment!

    Muni P., Subscriber

  • Your report is an impressive, excellent tool and I have recommmended it to friends.

    Colin E., Subscriber

  • There is a lot to be gained from comparing trends of how individual stocks are doing within a sector, as well as how the sector is performing relative to the broad market.

    Dudley R., Subscriber

  • Thank you for your excellent work and kind approach to your customers.

    Odette C., Subscriber

  • Stock Trends information is part of the base information I review before making a trade.

    Subscriber
  • I want to thank you for posting such an excellent guide to technical analysis on the web. You have provided a great service to all of us novice investors.

    Michael C., Stock Trends user
  • I very much like the systematic approach to analyzing stock data, it fits my approach.

    Subscriber
  • I have had the good fortune to be reasonably successful and enjoy the investment process. Your process would be recommended for both experts and those who are new to investing.

    Frank I., Subscriber
  • Stock Trends Weekly Reporter is an easy way to pick up equities that represent an upward trend.

    Subscriber
  • I am just writing to tell you of my appreciation of your service! It makes so much sense to me. You seem to be an oasis of stability and sensibility in a stockmarket jungle.

    Adrian S., Subscriber

  • An admitted cynic, it's obviously very high praise when he says he likes StockTrends because of its "simplicity, utility, openness, [and] honesty," and in addition to having "no hidden agenda" is "understandably documented [and] historically verifiable." And, he adds, "It lets me see a lot of things without doing a lot of work." Globe and Mail

    Paul W., Subscriber

  • I use Stock Trends to help direct my stock picks. Also, following the advice of Stock Trends I have religiously used stop-loss orders and have avoided hanging on to losing stocks for emotional reasons.

    John B., Subscriber
  • I find your website and research very helpful in my stock trading. I have subscribed to several related services in the past and none present their work with “just the facts” as you. Please keep up the great work so that I can continue to learn! 

    Bryan E., Subscriber
  • I've followed your recommendations since reading your columns in the Globe & Mail, and finding they published Stock Trends arrows in their financial listings. I do find them a guide to the general market and what I should be avoiding for declining chart trends.
    Has probably saved me the subscription by not rushing into hot stocks!

    Anthony D., Subscriber
  • I am fascinated with your service and methodology - it is very impressive. [...] Over the years I have concluded that there are many ways to approach stock investing, but once one has chosen a path, one is better off sticking to it.

    Bob E., Subscriber

Subscription Plans

Subscription Plans

STWR - Monthly

$19.95

Monthly subscription plan to Stock Trends Weekly Reporter - pay your monthly subscription fees by having them automatically charged (PayPal only). Free 7-day trial period. Subscribers may cancel before the end of any subscription month.

STWR - 1 Year Prepaid Subscription

$199.00

1 Year Prepaid subscription to Stock Trends Weekly Reporter. Save 16% off monthly rate!

STWR - 2 Year Prepaid Subscription

$299.00

2 Year Prepaid subscription to Stock Trends Weekly Reporter. Save 37% off monthly rate!

STWR - 3 Year Prepaid Subscription

$399.00

3 Year Prepaid subscription to Stock Trends Weekly Reporter. Save 44% off monthly rate!

Stock Trends Editorial

  • Long and strong - Bullish trends in specialized retailers
    Long and strong - Bullish trends in specialized retailers Amidst a market still digesting the Federal Reserve’s first rate cut in nine months, one theme stands out in the latest Stock Trends dataset: the remarkable resilience of retail leaders. While thousands of common stocks across NYSE, Nasdaq, and TSX are posting Strong Bullish signals, three consumer-facing companies — TJX Companies, O’Reilly Automotive, and Dollarama — hold the longest uninterrupted Bullish runs on their exchanges.…
    Read more...
  • From Banks to Bytes to Uranium: Strong Bulls Align with ST-IM Signals
    From Banks to Bytes to Uranium: Strong Bulls Align with ST-IM Signals On September 17, 2025, the U.S. Federal Reserve delivered its first interest rate cut in nine months, lowering the federal funds rate by 25 basis points to a new target range of 4.00%–4.25%. This was a response to clear signs of a cooling labor market—slower job growth, shorter workweeks, and rising unemployment in several cohorts. Although inflation remains above the Fed’s 2% target, policymakers signaled…
    Read more...
  • Money management and trading psychology: building a resilient trading plan that integrates with the Stock Trends decision-tree framework
    Money management and trading psychology: building a resilient trading plan that integrates with the Stock Trends decision-tree framework Financial markets are unpredictable. Even when a trading strategy has a positive expectancy, a few bad trades can wipe out an account if position sizes are too large or emotions override discipline. Academic studies show that how much capital is allocated per trade is more influential on long‑term returns than the specific trading system used. For example, research cited by position‑sizing specialist Van Tharp found that…
    Read more...
  • Stock Trends: The Human Side of Market Trends
    Stock Trends: The Human Side of Market Trends Markets don’t move on math alone—they move on people. The screens light up because millions of humans react to news, stories, and each other. Behavioral economics is the field that studies those reactions. This article introduces the big ideas, then brings the story up to date with automated bots and AI trading—and explains how the Stock Trends framework helps you navigate it all.
    Read more...
View all Stock Trends Editorials


Subscription Plans

STWR - Monthly

$19.95/Month

Monthly subscription plan to Stock Trends Weekly Reporter - pay your monthly subscription fees by having them automatically charged (PayPal only). Free 7-day trial period. Subscribers may cancel before the end of any subscription month.

STWR - 1 Year Prepaid Subscription

$199/Year

1 Year Prepaid subscription to Stock Trends Weekly Reporter. Save 16% off monthly rate!

STWR - 2 Year Prepaid Subscription

$299/2 Years

2 Year Prepaid subscription to Stock Trends Weekly Reporter. Save 37% off monthly rate!

STWR - 3 Year Prepaid Subscription

$399/3 Years

3 Year Prepaid subscription to Stock Trends Weekly Reporter. Save 44% off monthly rate!