This week's Stock Trends 'Select' stocks and statistical inference model rankings of current Picks of the Week, S&P 100 stocks, and S&P/TSX 60 stocks.
|
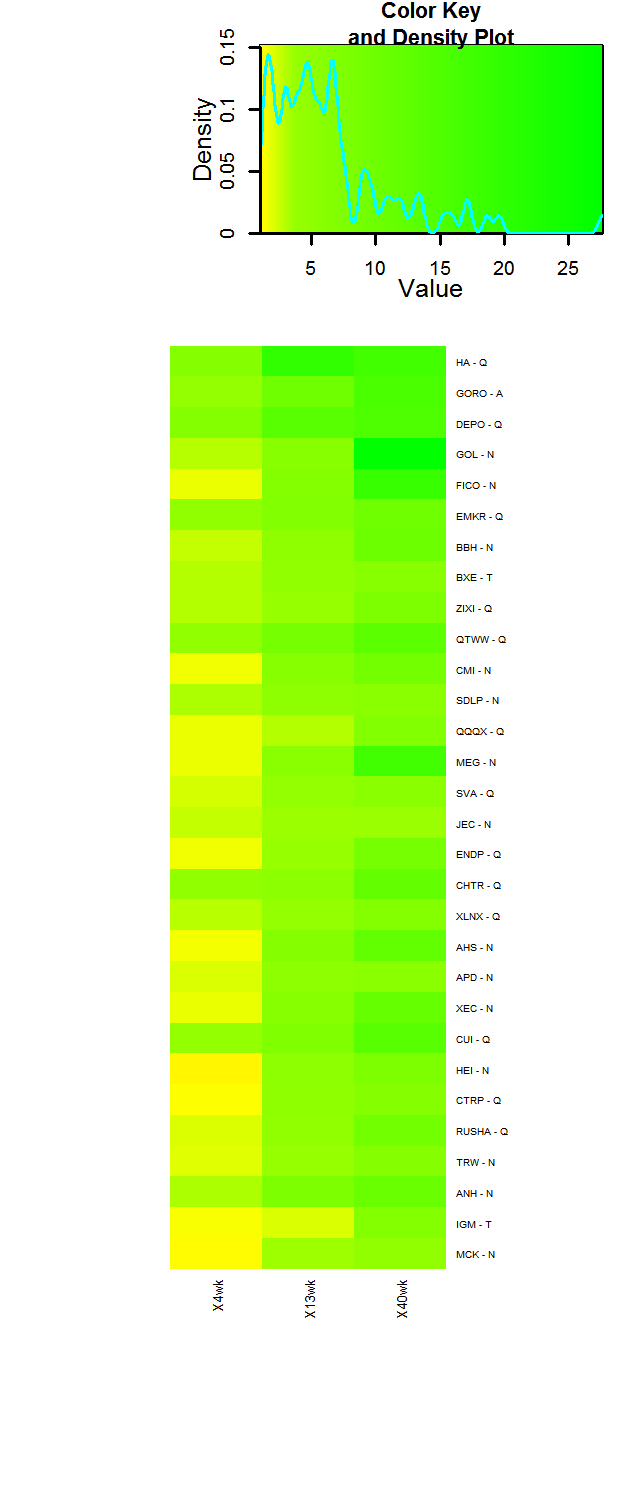
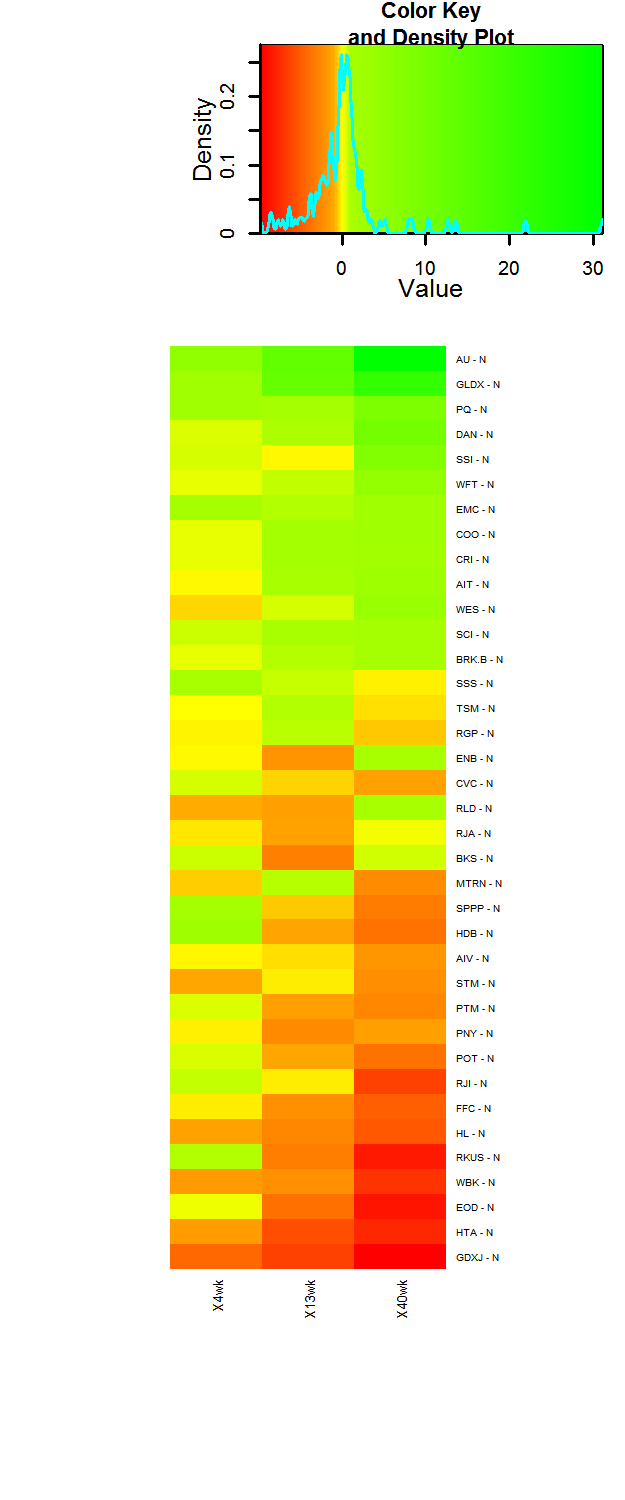
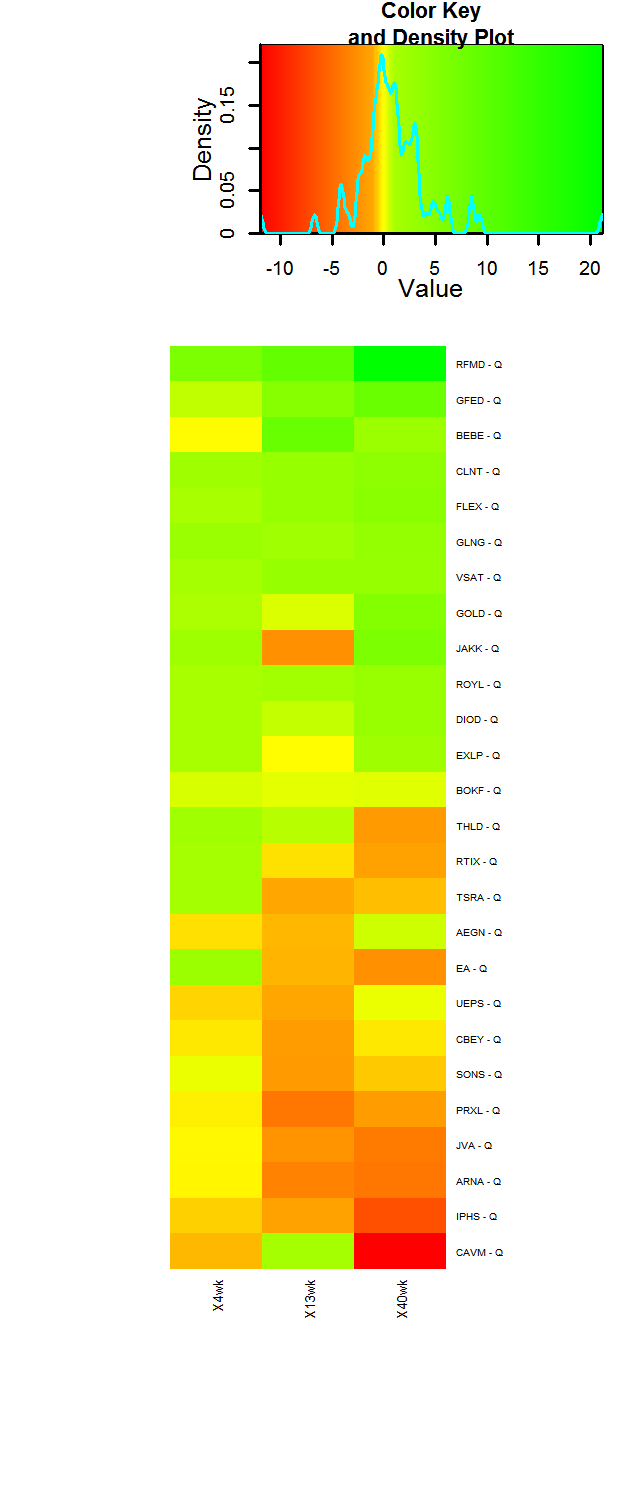
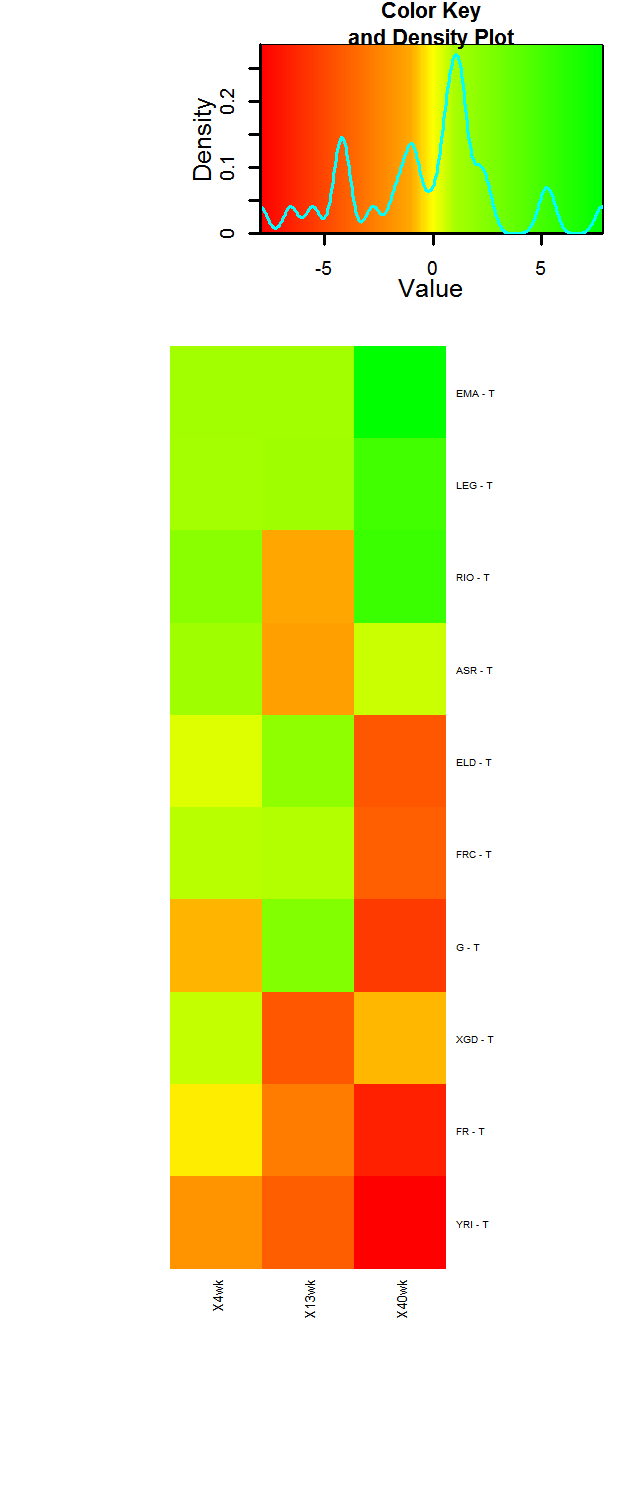
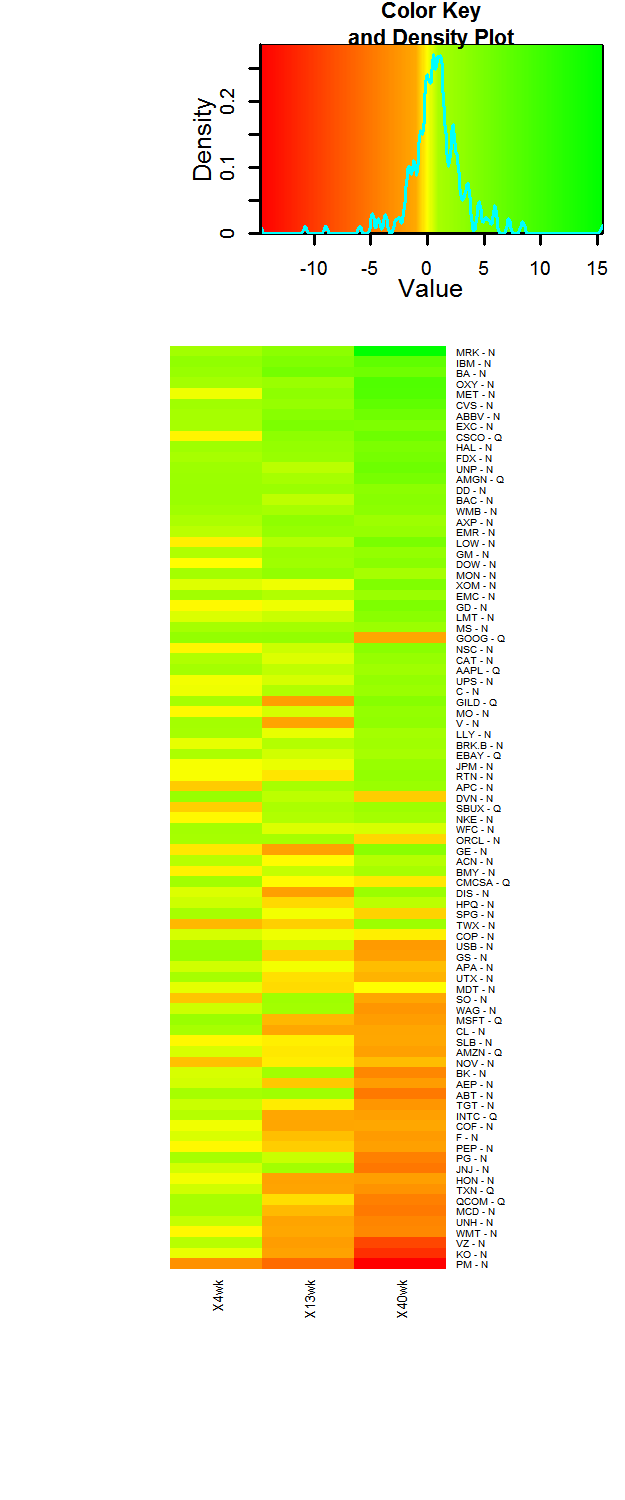
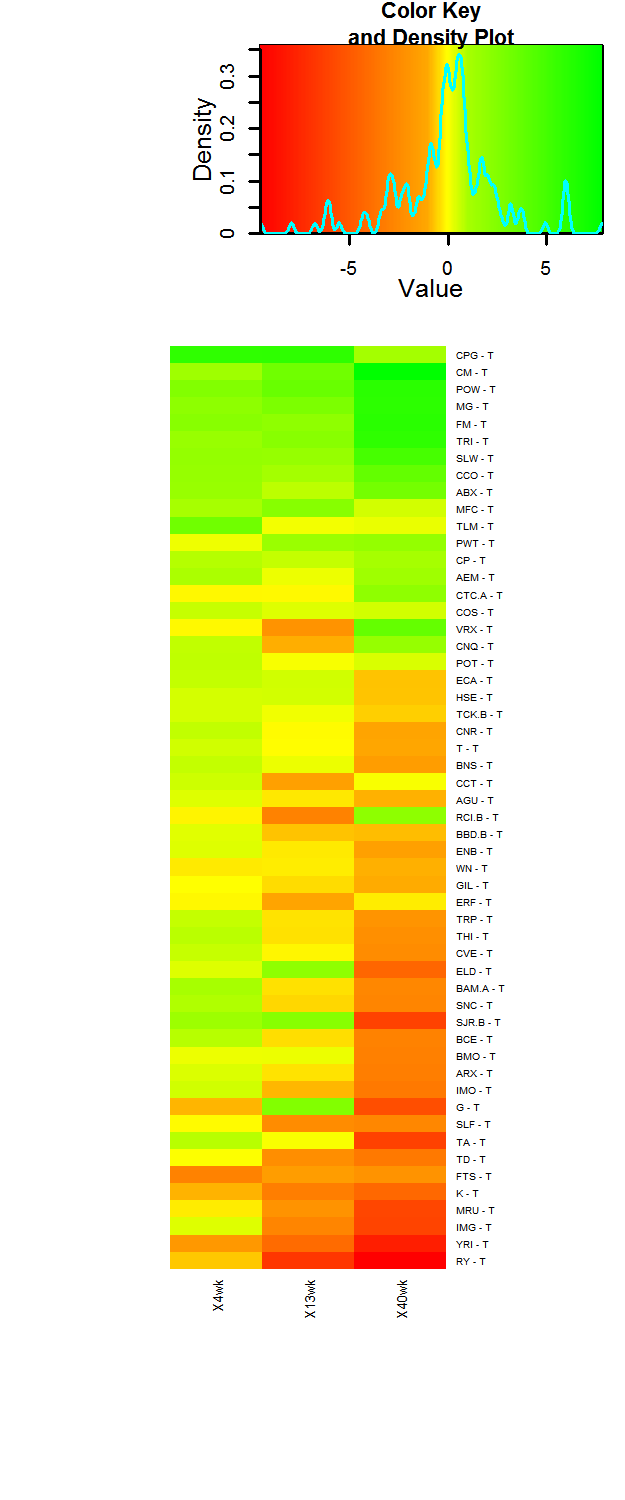
While Stock Trends reports are designed to highlight stocks that have triggered some aspect of traditional charting, the new inference model introduced in recent editorials is fundamentally a more data driven approach to the Stock Trends indicators. It is an apparatus that looks at statistically measured responses to a market condition defined by price trend and momentum. If a stock has certain market conditions, is there a statistical probability of future returns? Now that we’ve been introduced to the elements of the model (see recent editorials), let’s look at what the current Stock Trends indicators say. Below are a series of heatmap images that show various rankings of the probable returns in the upcoming 13-week period. Those at the top of the heatmap have the highest probability of exceeding the base period random returns.
The colour coding indicates the relative returns above the base period returns (4-week: 0%, 13-week: 2.19%, 40-week: 6.45%). As the statistical mean of the returns generated by the Stock Trends indicator combinations out-perform the base returns the green colour is progressively darker. As the statistical mean of the returns generated by the Stock Trends indicator combinations under-perform the base returns the red colour is progressively darker. Returns centered around the period base returns are colour-coded yellow. The included Color Key illustrates the coding.
First we will look at the top 30 ranked ‘Select’ North American stocks. Select stocks must have Stock Trends indicator combinations that have a lower limit of its mean return confidence interval above the base period mean return for all three periods – 4-week, 13-week, and 40-week. These select stocks are then ranked by descending order of their probability of outperforming the base period mean random return. The assumed probability distribution is a normal curve.
In short, these stocks exhibit the Stock Trends indicator combinations with the highest probability of beating the mean return of randomly selected stocks. Future editorials will elaborate on the portfolio management implications of this ranking system. For now, let’s look at some analysis results:
|
Stock Trends inference model |
Select Stocks - Top 30 |
 Current Trend Listings of Select Top 30 stocks
Subscribers to Stock Trends Weekly Reporter will find a new report listed under the header 'ST-IM Select stocks of the week' in the ST Filter Listings section.
Below are the distributions of returns generated by the Stock Trends indicator combination now sported by Hawaiian Holdings (HA-Q), the top ranked Select stock.
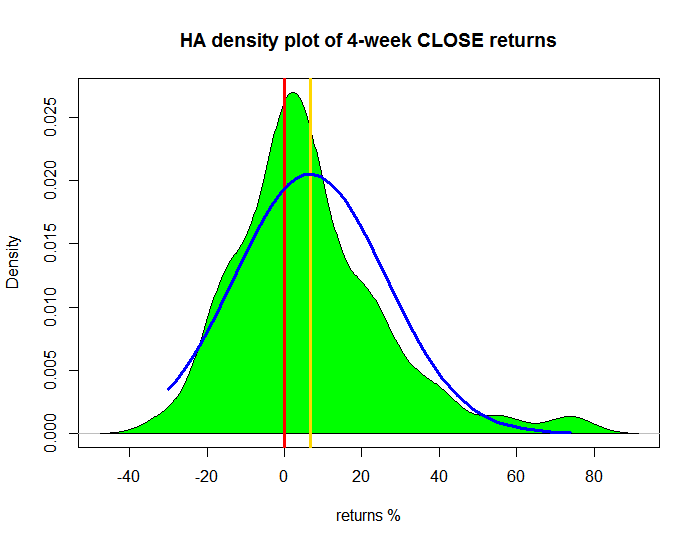 Note: the sample density distribution is outlined in green. The assumed population distribution - a normal distribution - is outlined in blue. The vertical yellow line indicates the estimated population mean return. The vertical red line indicates the base return of a randomly selected stock.
For 4-week CLOSE returns distribution estimation, with 95 % confidence, the 4-week CLOSE mean return of the population of stocks
with a similar Stock Trends indicator combination to HA will be inside [ 1.978 %, 11.294 %]
[1] "With probability of 2.5% we will have a mean return below 1.978%"
Estimated population mean return 6.64% and standard deviation of 19.85
Normal Distribution
For 4wk CLOSE P(R> 0)=63.09% probability of a return greater than the 4-week mean return of a randomly selected stock.
62.75% of sample returns are >0%
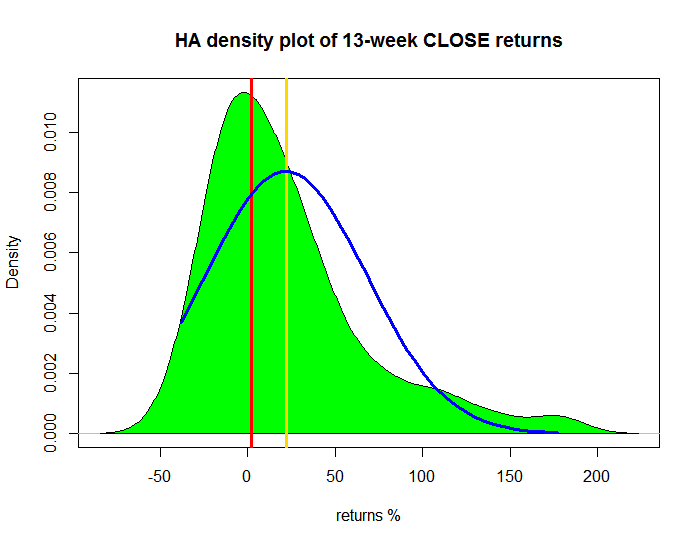 Note: the sample density distribution is outlined in green. The assumed population distribution - a normal distribution - is outlined in blue. The vertical yellow line indicates the estimated population mean return. The vertical red line indicates the base return of a randomly selected stock.
For 13-week CLOSE returns distribution estimation, with 95 % confidence, the 13-week CLOSE mean return of the population of stocks
with a similar Stock Trends indicator combination to HA will be inside [ 10.276 %, 33.502 %]
[1] "With probability of 2.5 % we will have a mean return below 10.276%"
Estimated population mean return 21.89% and standard deviation of 46.9
Normal Distribution
For 13wk CLOSE P(R> 2.19)=66.28% probability of a return greater than the 13-week mean return of a randomly selected stock.
63.04% of sample returns are >2.19%
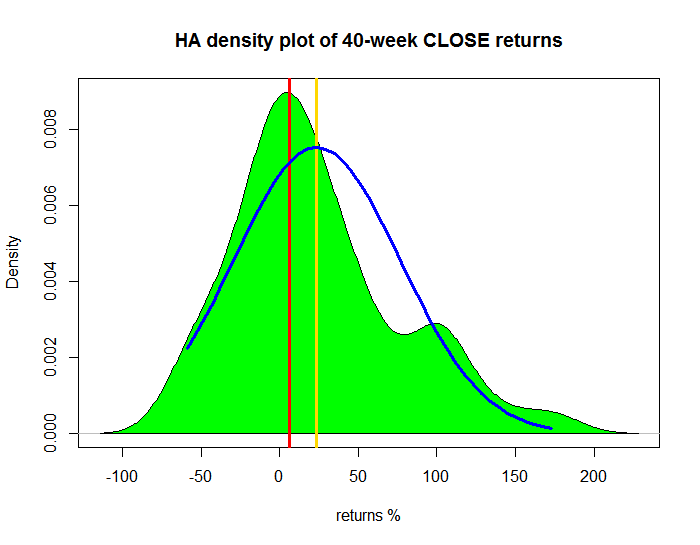 Note: the sample density distribution is outlined in green. The assumed population distribution - a normal distribution - is outlined in blue. The vertical yellow line indicates the estimated population mean return. The vertical red line indicates the base return of a randomly selected stock.
For 40-week CLOSE returns distribution estimation, with 95 % confidence, the 40-week CLOSE mean return of the population of stocks
with a similar Stock Trends indicator combination to HA will be inside [ 9.773 %, 37.583 %]
[1] "With probability of 2.5 % we will have a mean return below 9.773%"
Estimated mean return 23.68% and standard deviation of 54.21
Normal Distribution
For 40wk CLOSE P(R> 6.45)=62.47% probability of a return greater than the 40-week mean return of a randomly selected stock.
55.81% of sample returns are >6.45%
Next we'll survey the mean return expectations of the current Picks of the Week, S&P 100 stocks, and S&P/TSX stocks. Here the stocks are ranked by their mean average returns across all three periods (4-week, 13-week, and 40-week).
|
Picks of the Week |
Current NYSE Picks |
 It should be noted that not all current Picks of the Week, or index components listed below have statistical inference ratings. Some Stock Trends indicator combinations do not provide a large enough sample size to make inferences about their population. The heatmap images displayed here are great for viewing relative performance expectations, but not the best to provide links to the Stock Trends Reports on the individual stocks. Below is a ranked table that provides the current trend listing of these Picks of the Week, with links to their Stock Trends Report pages.
Current Trend Listings of NYSE Picks of the week stocks
|
Current Nasdaq Picks |
 |
Current TSX Picks |
 |
S & P 100 index stocks |
 |
S & P/TSX 60 index stocks |
 |


Published in Stock Trends
 Hence, anyone who had followed the "Stock Trends" line should have sold their Bre-X shares and, with the windfall, paid for a lifetime subscription to The Globe and Mail and more. Talk about return on investment!


