|
The new Stock Trends Inference Model (ST-IM) Select stocks report has been published for a few weeks now, and reports for previous weeks are also being populated gradually. Subscribers can monitor the current selections to see how they perform. The inference model is an application that translates the Stock Trends data into a unique actionable tool for investors. Let’s review the methodology again.
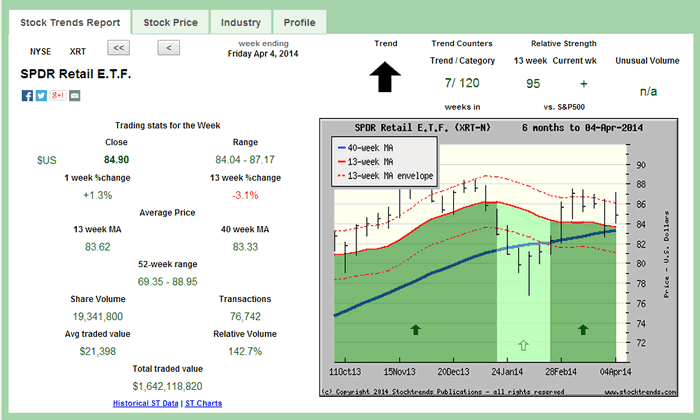
The ST-IM Select stocks report includes all stocks with a Stock Trends indicator combination that show statistical evidence of predicting future performance better than base period random returns (see The random outcome benchmark). For instance, last week’s ST-IM report for the New York Stock Exchange includes the SPDR Retail exchange traded fund (XRT). The current Stock Trends Report for XRT shows that the ETF has been in a Bullish category for 120 weeks and has sported a strong Bullish indicator for the past 7 weeks. It is under-performing the S&P 500 by 5% over the past 13-weeks (RSI 95), but out-performed the benchmark market index last week (RSI +/- shows a +). There is no unusual volume indicator.
This Stock Trends indicator combination is matched by 63 similar combinations in the 30+ year Stock Trends data history. When these groupings are applied stocks with a share price lower than $2 are not included with stocks with a share price $2 and higher. Also, indicator combinations with weekly volume of trading below 100,000 are grouped separately. The resultant sample that fits the current Stock Trends indicator combination of XRT is shown below:
     weekdate exchange symbol  X4wk  X13wk  X40wk
1  1983-05-20        N    CEG -6.41  -2.43  -1.55
2  1986-07-11        N     DF -4.26 -13.03  -8.78
3  1986-11-07        N    CNL  0.69   1.38  -1.50
4  1987-09-11        N    TIN  0.00 -29.41 -18.49
5  1992-12-25        N    PPL -1.36   7.60   7.17
6  1993-04-16        N    CCK -6.72 -11.54  -2.23
7  1993-05-21        N    DSM  1.16   3.56  -6.07
8  1994-01-21        N     SO -5.50  -8.09  -7.54
9  1995-05-26        N    SWY  6.26   5.93  58.72
10 1995-07-14        N    HMA 12.67   9.93  73.97
11 1995-07-21        Q   ABCW  6.18  28.96  27.30
12 1996-05-03        N    IVC -0.95  16.19  -1.90
13 1996-06-28        N    BDX -6.68   9.67  13.41
14 1997-04-04        N    RDN 12.51  43.51  67.53
15 1997-05-30        N    WBS  9.94  31.35  58.02
16 1997-05-30        T    NDN  9.54   3.49  22.02
17 1997-05-30        N    NWL  3.42   3.27  28.76
18 1997-06-06        N    BAC  7.49 -10.09   9.36
19 1997-06-06        N    MTB  2.69  10.45  43.28
20 1997-06-13        N    BBT  6.26  20.98  49.68
21 1997-06-27        N    PDE  9.53  51.13  12.37
22 1997-07-04        N     BA  6.00  -5.78   0.00
23 1997-07-18        N    CLI 11.30  17.01   9.82
24 1997-07-25        N    ESS -3.44   4.17   2.07
25 1997-08-15        N    UVV -1.39   4.52  -1.59
26 1997-10-17        N    BCE -2.41   9.22  36.60
27 1998-02-13        N    TJX 16.49  25.91  31.26
28 1999-07-30        N     GD -7.34 -17.65 -15.33
29 2002-12-06        N    BKT  0.13   3.17  -8.24
30 2003-05-23        Q   PVTB  4.91  40.30  94.47
31 2004-12-24        Q   PMTI  9.68  17.77  12.33
32 2005-03-25        Q   CHRW -8.19   8.19  42.42
33 2005-06-17        N    ATR  0.84  -2.41   9.36
34 2005-07-08        T    BXE 20.99  28.48  15.99
35 2005-07-08        N    MEE 12.93  17.83 -11.68
36 2005-07-22        Q   ESLR -9.35  25.80 109.35
37 2005-08-26        T    CNR -1.63  13.66  21.82
38 2005-12-02        Q   LUFK  7.04  15.45  26.05
39 2006-01-06        N    CVD 10.73  13.87  30.61
40 2006-01-06        N    FTO 11.58  43.94  42.36
41 2006-01-27        N     GD  2.87  10.75  19.04
42 2006-02-24        T FDG.UN -4.29 -17.25 -48.02
43 2006-09-29        N    KSU  8.68   6.11  42.11
44 2006-11-24        Q   GOLD -1.01   6.61   5.46
45 2007-02-23        N    EME -0.75   3.15 -13.42
46 2007-05-04        N    AFG  0.56 -21.43 -23.83
47 2011-03-11        N    TSI -0.18  -1.85  -4.07
48 2011-06-03        Q   AAPL -0.05   8.91  58.74
49 2011-11-18        N    KED  3.96  20.22  26.69
50 2012-01-13        N   PRGO -3.82   7.34  21.39
51 2012-02-03        N    WCN -4.10  -4.40  -4.49
52 2012-02-03        T     CU  9.45  14.68   5.26
53 2012-02-17        N    MJN  5.63   7.27 -10.74
54 2012-02-24        T    THI  1.65   4.11 -12.52
55 2014-01-03        N    STC -1.07   1.83     NA
56 2014-01-24        Q   CHTR -4.82     NA     NA
57 2014-02-07        T    RCH  8.38     NA     NA
58 2014-03-21        N    AIG    NA     NA     NA
59 2014-03-21        N    MMM    NA     NA     NA
60 2014-03-28        N    DDM    NA     NA     NA
61 2014-03-28        N   UDOW    NA     NA     NA
62 2014-03-28        T    MSI    NA     NA     NA
63 2014-04-04        N    XRT    NA     NA     NA
64 2014-04-04        Q   FELE    NA     NA     NA
|
The table shows the week of the matching combination with subsequent (post-observation) returns for 4-week, 13-week, and 40-week periods. Some of the records at the bottom of the table are too recent to have generated returns for the subsequent periods and are denoted with a “NA”.
The sample reveals that although there are similar records throughout the data history, they cluster around certain market environments or moments in time. These clusters are important aspects of the samples that we can evaluate in another model, but for the purposes of this inference model they are not significant. We are looking to define a population – all stocks that have a similar quality of trend and price momentum as defined by the Stock Trends indicator combination. From the sample above we can estimate the relevant parameters of this population.
The sample subsequent returns (4-week, 13-week, 40-week) are the statistics we measure. Here is the summary for the three periods:
For 4-week CLOSE* returns distribution estimation, with 95 % confidence, the 4wk CLOSE mean return of the population of stocks with a similar Stock Trends indicator combination to XRT will be inside [ 1.206 %, 4.282 %]
[1] "With probability of 2.5 % we will have a mean return below 1.206"
Mean return 2.74% and standard deviation of 6.94
Normal Distribution
For 4wk CLOSE P(R> 0)=65.37% probability that the 4-week return will be above the base 4-week return (0%).
57.89% of 57 sample returns are >0%
For 13-week CLOSE returns distribution estimation, with 95 % confidence, the 13wk CLOSE mean return of the population of stocks with a similar Stock Trends indicator combination to XRT will be inside [ 5.044 %, 12.495 %]
[1] "With probability of 2.5 % we will have a mean return below 5.044"
Mean return 8.77% and standard deviation of 16.51
Normal Distribution
For 13wk CLOSE P(R> 2.19)=65.49% probability that the 13-week return will be above the base 13-week return (2.19%).
72.73% of 55 sample returns are >2.19%
For 40-week CLOSE returns distribution estimation, with 95 % confidence, the 40wk CLOSE mean return of the population of stocks with a similar Stock Trends indicator combination to XRT will be inside [ 10.272 %, 24.276 %]
[1] "With probability of 2.5 % we will have a mean return below 10.272"
Mean return 17.27% and standard deviation of 30.73
Normal Distribution
For 40wk CLOSE P(R> 6.45)=63.76% prbability that the 40-week return will be above the base 40-week return (6.45%).
57.41% of 54 sample returns are >6.45%
* Note: The Stock Trends Inference Model uses end-of-period closing price returns. See Variability of returns
What does this tells us? First, it is understood that generally we cannot precisely know the true population. We can only estimate it’s characteristics from a given sample. Equipped with two sample statistics – the sample mean (average) return and sample standard deviation (a standardized measure of variance of the returns) – we can estimate the population mean return and standard deviation (both known in statistical parlance as parameters). This magical property you can investigate further in many statistical books that introduce concepts of statistical inference.
In this example we can see that the lowest value of the interval estimate of the population mean is above the mean return of random returns in each of the three periods. This implies that we are pretty certain that the mean return of this population is higher than the random return benchmarks. If we assume a normal distribution of returns for the population – which we do because our assumption is that returns are random – then we can use another statistical method to give the probabilities that XRT will return above the random mean return.
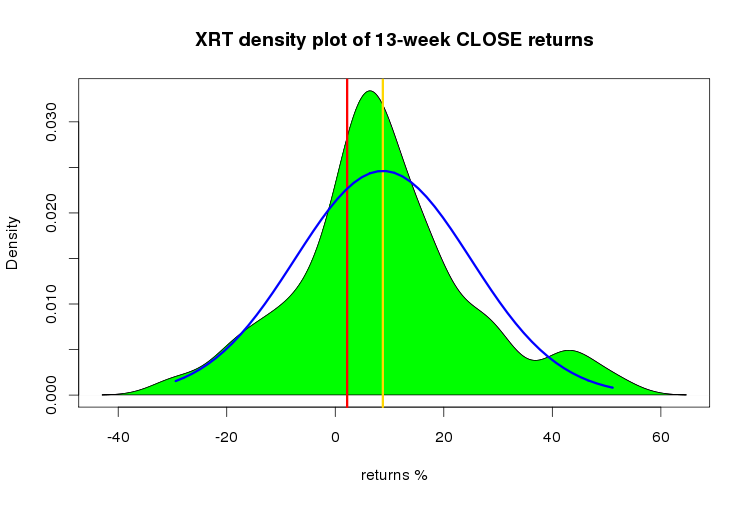
The sample density distribution is filled in green. The assumed population distribution - a normal distribution - is outlined in blue. The vertical yellow line indicates the estimated population mean return. The vertical red line indicates the base return of a randomly selected stock.
In the case of the 13-week period ahead, the Stock Trends inference model posits that there is a 65.5% chance that XRT will return above 2.19%. That is better than the 50% chance a random return will generate a 13-week return better than 2.19%, but we should always remember that unless a probability is 1 (100%) there is no certainty. You can always roll a negative outcome even if the probability of a positive outcome is 99%. However, a 65.5% chance is an edge a trader can use.
The ST-IM report gives us a weekly round-up of stocks that have at least a 55% probability of generating a 13-week return better than 2.19%. There are other indicator combinations that also share this property, but these are the ones that meet the criteria of having a confidence interval above the base mean return of each period (others may have lower estimates in the interval that fall below the base mean return). These are the ones that we are most certain will have a population mean return above the base return of every period.
Another important aspect of the Stock Trends Inference Model demands more attention. Each ST-IM report represents a sample of a new population, namely all stocks that fit the model criteria. The Central Limit Theorem states that the mean return of random samples from this population will be normally distributed (bell-shaped). We can also estimate that a portfolio of stocks randomly selected from the ST-IM reports will return above the base market return.
Let’s experiment. We can construct many randomly selected sample portfolios from the ST-IM Select stocks reports, with equal amounts invested in each stock or ETF. What kind of 13-week returns were generated?
There have been 5,905 ST-IM Select stocks in the past year that generated subsequent 13-week returns (ST-IM Select reports from April 4, 2013 to January 3, 2014). This sample can be summarized as follows:
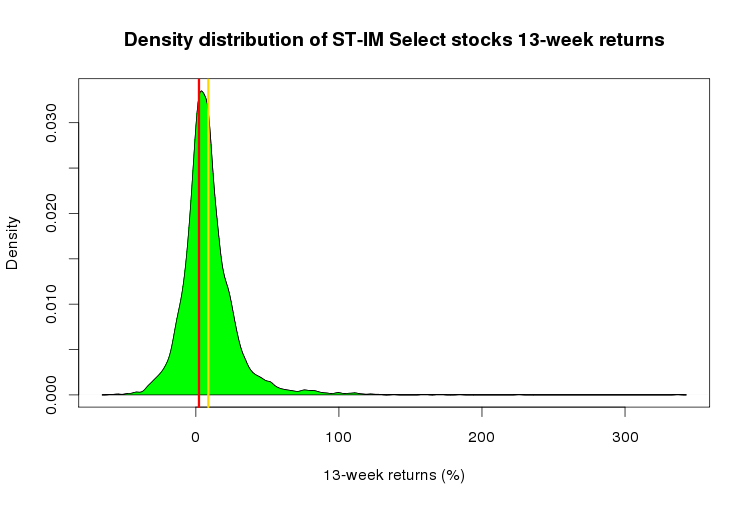
The sample density distribution is filled in green. The vertical yellow line indicates the sample mean return. The vertical red line indicates the base return of a randomly selected stock.
  vars    n mean    sd median trimmed  mad   min   max range skew kurtosis   se
1    1 5905 8.75 19.89    6.4    7.11 12.6 -59.5 336.8 396.3 2.67    22.65 0.26
|
| |
| |
The mean (average)13-week return of these ST-IM Select stocks is 8.8%. The maximum 13-week return was 396%, the biggest loss 60%. Our inference model directs us toward stocks that have a higher probability of returns greater than the mean 13-week return of randomly selected stocks – 2.19%. The results confirm that – 64% of ST-IM Select stocks had a return greater than 2.19%. But how did these ST-IM Select stocks do in comparison to the benchmark market indexes? The following gives a summary of the Stock Trends RSI values of the select stocks 13-weeks after the selections:
  vars    n   mean    sd median trimmed   mad min max range skew kurtosis   se
1    1 5905 104.06 18.91    101  102.49 11.86  37 417   380 2.72    23.44 0.25
|
| |
| |
The mean Stock Trends RSI is 104. This tells us that had we invested in all of these ST-IM Select stocks our performance would have exceeded the market outcomes – we would have done better than trading simultaneously in a benchmark exchange traded fund like the SPDR S&P 500 ETF (SPY).
Obviously, it is not practical to look at the total of these numerous selections. We would have had to trade a much smaller number of ST-IM Select stocks. It’s difficult to isolate which subset of ST-IM Select stocks would have generated the best returns in this distribution (although I will try to do this in the future using data mining analysis techniques), but we can estimate the average or likely return attainable by random sampling.
How would have investor done if he randomly selected small portfolios of stocks from the ST-IM reports? For example, what results would have been attainable if we randomly selected five (5) stocks from the ST-IM reports and measured subsequent 13-week returns of these portfolios? Does the ST-IM model deliver superior returns for a retail trader?
If we take 1,000 random portfolios of 5 stocks from our sample, the following distributions of portfolio returns and RSI values is evident after the 13-week period for each portfolio:
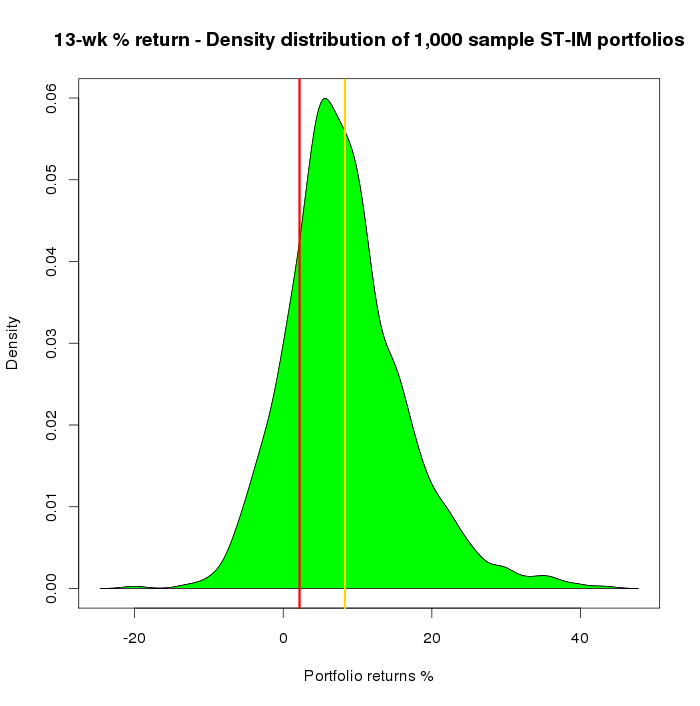
The sample portfolio returns density distribution is filled in green. The vertical yellow line indicates the portfolio mean return. The vertical red line indicates the base return of a randomly selected stock.
  vars    n mean   sd median trimmed  mad    min   max range skew kurtosis   se
1    1 1000 8.53 7.72   7.72    8.11 7.03 -13.64 46.08 59.72 0.71     1.48 0.24
|
| |
| |
The mean 13-week return of these portfolios is 8.5%. That translates to an annualized return of 34%. Of these 1,000 random portfolios, 79% generated a 13-week return greater than the base period return of 2.19%.
Below is a summary of how these portfolios did relative to the benchmark indexes over these 13-week periods.
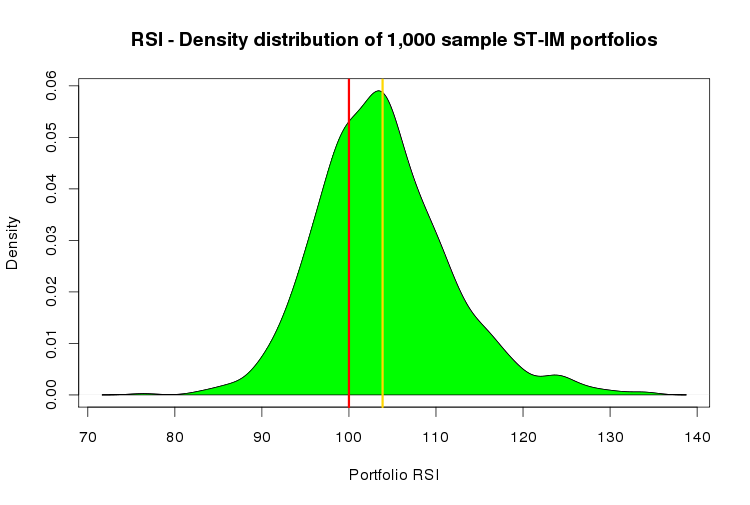
The sample portfolio post-trade 13-week RSI density distribution is filled in green. The vertical yellow line indicates the portfolio mean post-trade RSI. The vertical red line indicates the base benchmark index.
  vars    n   mean   sd median trimmed  mad  min   max range skew kurtosis   se
1    1 1000 103.83 7.49  103.2  103.44 6.82 82.4 140.2  57.8 0.66     1.31 0.24
|
| |
| |
The mean 13-week RSI is 104. This tells us that the random portfolios are outperforming the market, on average, by about 4% in these13-week trades. Take note that although transaction costs are not discounted here, we are comparing against an active trading of a market index, not a buy-and-hold strategy. A buy-and-hold strategy can be compared against the ST-IM portfolio annualized mean return of 34%. The S&P 500 index is up 20% in the past 12-months; the S&P/TSX Composite Index is up 17%. In this comparison the ST-IM annualized return should be discounted for transaction costs.
Subscribers to Stock Trends Weekly Reporter should feel quite confident in actively trading the highlighted stocks in the weekly ST-IM Select stocks report.
|
 Stock Trends analysis quantifies nicely the movement of individual stocks. I’ve found that if the technicals are out of synch with fundamental analysis, it is a wake-up call to make a decision. The Stock Trends Bull/Bear Ratio is useful in identifying major market bottoms and tops. It has always presented a good buying or selling opportunity.


