|
The stock market is a great laboratory. Considering the immense scope of data fueling asset valuations and ultimately influencing market price behaviour, it's not surprising that quantitative models are increasingly used to harness this data. Where analysis frameworks formerly tended to be doctrinaire - whether fundamental or technical - data science is now interjecting a new standard. Data-driven analysis is a booming business.
For technical analysts the rigours of data science present a challenge. The foundation of technical analysis is clearly stated in its primary tenets: the market is transparent, prices trend, and move in identifiable patterns that repeat themselves. The chartist is a practitioner of pattern recognition. But how well do these patterns hold up to data science methods? Does the data support the chart patterns and indicators that are the bread and butter of market technicians?
Although many very successful traders have made their fortunes and fame out of technical analysis, skeptics of the profession have always weighed in. And rightly so. Even market technicians self-proclaim their craft as equal parts science and art. However, those two endeavours don't often mingle well. Science is far too precise to indulge anecdote or flourishes of doctrine unsupported by the cold currency of hard evidence. Art is often too subjective or personal to codify. But quantitative analysis demands codification and measurement of variables.
There is no shortage of technical analysts peddling doctrinaire assertions. Typically, almost every chart pattern presented lacks supporting quantitative evidence of predicative value. The language of the market technician largely fixates on what amounts to textbook, anecdotal guidelines. When assertions about probable outcomes are ventured, seldom do statistical measures accompany them. A recent article published by a technical analyst, for instance, said the following:
"The highest probability setups are the ones that have all the key moving averages on the right side of them. That doesn't mean that other setups will not work, it just means that the odds are slightly higher when this does occur." See 'I like pullbacks on Vipshop'
Here the use of the word 'probability' implies some kind of definition of a sample space and its measurement. Unfortunately, most technicians offer neither. Statements like the above are bandied about as doctrine, but have no data to back them up. For the data scientist this is verboten.
We now live in a world where data can give us the answers we need, and whether we like the answers or not we must let the data confirm or refute our hypothesis about relationships between variables - or even prove causation if necessary. If you are serious about technical analysis it is important to learn the language and process of data science.
In an effort to address these higher standards I have started to model Stock Trends in the garb of quantitative data analysis. The Stock Trends indicators translate weekly market data into categories, giving the investor a quick and effective way to put current North American stock prices into a trend context. This categorical data fits into a number of data science approaches that transform the Stock Trends indicators into simple statistical models.
This is now an important departure point for any technical methodology - how does the data support an analysis framework? In this case, do the Stock Trends indicators tell us something meaningful about future share price movement? For instance, how meaningful is a Stock Trends Bullish Crossover, alternatively referred to as a Golden Crossover in the lexicon of technical analysts?
The Stock Trends indicator combinations provide an effective data foundation for a statistical inference model. Every week traded issues on the major North American exchanges are codified by these indicator combinations. As an example, last week the Stock Trends indicator combination for Fedex (FDX-N) was represented in the Stock Trends Report:
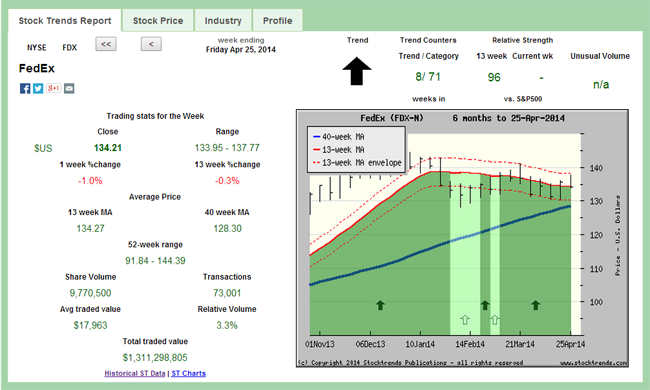
Fedex's stock is labeled as Stock Trends (strong) Bullish (  ). It has been a (strong) Bullish stock for 8-weeks, and has been categorized in a Bullish trend for 71-weeks (see trend counters). The stock has under-performed the S&P 500 index by 4% in the past 13-weeks, as indicated by the Stock Trends Relative Strength indicator (96). Last week it also underperformed the benchmark index, as indicated by the RSI (-) sign. Finally, there is no unusual volume indicator, as defined by Stock Trends. This combination of Stock Trends indicators codifies price trend and momentum market characteristics of Fedex's stock at this moment. ). It has been a (strong) Bullish stock for 8-weeks, and has been categorized in a Bullish trend for 71-weeks (see trend counters). The stock has under-performed the S&P 500 index by 4% in the past 13-weeks, as indicated by the Stock Trends Relative Strength indicator (96). Last week it also underperformed the benchmark index, as indicated by the RSI (-) sign. Finally, there is no unusual volume indicator, as defined by Stock Trends. This combination of Stock Trends indicators codifies price trend and momentum market characteristics of Fedex's stock at this moment.
What does this Stock Trends indicator combination tell us about future price movement? Can we assert some probability statement that is based on data evidence? If we want to generalize about a market condition like the one categorized by this Stock Trends indicator combination we must first make an assumption: market conditions are non-specific to a security. This is an integral premise of technical analysis - that patterns evident in one security have relevance in patterns evident in another security.
In order to assign probability statements a sample space of possible outcomes must be defined. We can estimate this sample space through statistical inference methods. In the case of the Stock Trends indicator combinations we can ask the question: how did other stocks with similar indicator combinations perform in the past?
The answer to that question is found in the data. By extracting all like combinations in the 30-year data history we obtain a sample of stocks from which we can measure the post-observation returns. This statistic will measure the change in share price after 4-weeks, 13-weeks, and 40-weeks.
The sample extracted from the data finds 91 other like observations - stocks that sported similar Stock Trends indicator combinations in the past. The distribution of returns for each of these periods is of interest, but here is the sample distribution of post-observation 13-week returns for stocks with similar Stock Trends indicator combinations as the current Stock Trends Report of Fedex.
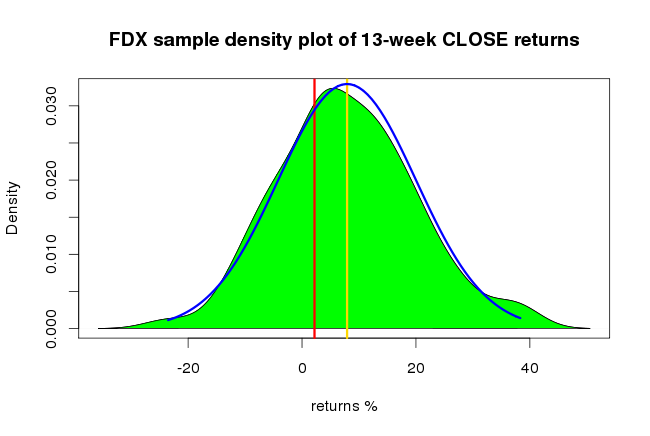
The sample density distribution is filled in green. The assumed population distribution - a normal distribution - is outlined in blue. The vertical yellow line indicates the estimated population mean return. The vertical red line indicates the base return of a randomly selected stock.
Expected 13-week returns (%) implied by the Stock Trends Inference Model can be summarized briefly:
For 13-week CLOSE returns estimation, with 95 % confidence, the 13-week CLOSE mean return of the population of stocks with a similar Stock Trends indicator combination to FDX will be inside [ 5.688 %, 10.137 %], with probability of 2.5 % we will have a mean return below 5.688%.
The mean return 7.91% and standard deviation of 12.26% tell us that a normal distribution of 13-week CLOSE returns implies a probability of 67.97% that the expected return will be above the base 13-week random return of 2.19%.
FDX is listed in the current Stock Trends Inference Model (ST-IM) Select stocks ST Filter report.
|
 There is a lot to be gained from comparing trends of how individual stocks are doing within a sector, as well as how the sector is performing relative to the broad market.


