Emerging markets invitation

  • 04 May 2014 |
  • Written by  Skot Kortje, Stock Trends Analyst
  • font size
  • Print

Building momentum in emerging market equities indicates many market-timers are taking on foreign risk. ?But is it time for investors to increase their exposure? ?

Emerging market stocks are earning back investor confidence. When the 'risk-on' button has been pushed market-timing traders are prepared to rotate into foreign equities at the earliest sign of sustained price momentum. Considering the muted volatility of the broad North American stock market, evidence of a blooming sector rotation to overseas equity risk is a welcome technical signal for investors.

In U.S. dollar terms, Brazilian equities are outperforming U.S. equities by 13 per cent since the end of January. Southeast Asian markets - Indonesia, Thailand, and Philippines in particular - are also setting a much better pace than U.S. stocks. These markets are currently labeled as Stock Trends Weak Bearish () - indicating that the primary long-term bearish trend category is shifting - or have recently had a Bullish Crossover () and changed to a Stock Trends Bullish () trend. Many have rallied nicely in the past month. It's not surprising to see a surge in the number of stock picks that fit the emerging market theme.

The most recent Stock Trends Picks of the Week report features over twenty emerging market stocks and ETFs. Bank, communications, utilities, and energy stocks lead this group.


Emerging market stocks and ETFs on the move

Trend
RSI
Issue
Price($)
wk%chg
Vol(00s)
 
138 Banco Bradesco SA (BBD)
15.30
2.8
423586
 
121 Banco Santiago - Chile (BSAC)
24.91
8.1
25892
 
122 Bancolombia S A (CIB)
56.79
2.6
20410
 
120 Comp. Brasil. de Distribuicao (CBD)
48.41
3.4
22919
 
120 Companhia Energetica (CIG)
7.31
2.2
249327
 
108 Empresa Nacional Electricidad (EOC)
43.82
3.1
5512
 
115 Enersis SA (ENI)
16.11
2.9
31405
 
103 iShares Core MSCI Emerging Mkt (IEMG)
49.78
1.5
67434
 
101 iShares Intl Preferred E.T.F. (IPFF)
24.82
2.8
1893
111 iShares Latin Amer 40 E.T.F. (ILF)
38.67
2.9
34038
 
117 Ishares Msci Brazil Capped ETF (EWZ)
48.48
3.8
828316
 
103 iShares MSCI Emerg Mkt E.T.F. (EEM)
41.61
1.9
2784643
 
102 iShares MSCI Malaysia E.T.F. (EWM)
15.84
1.5
71161
 
105 iShares MSCI Singapore E.T.F. (EWS)
13.59
1.7
67869
 
111 iShares MSCI Thailand E.T.F. (THD)
76.34
1.7
12381
 
106 LATAM Airlines Group S.A. (LFL)
15.50
3.3
26946
 
103 Morg Stan Em Mk Debt (MSD)
10.15
0.5
2920
 
115 Mrk Vectr Indonesia E.T.F. (IDX)
25.54
0.8
7854
 
125 Paranaense De Energia Copel (ELP)
15.08
7.3
19917
 
104 SCHWAB EMG MKT ETF (SCHE)
24.70
1.5
11655
 
102 SPDR DJ Int Real Estate E.T.F. (RWX)
42.70
1.1
13119
 
129 Telecom Argentina (TEO)
20.82
7.3
7144
 
107 Telefonica Brasil (VIV)
21.41
4.6
88363
 
104 Templeton Emg Mkt Incm Fd (TEI)
14.50
0.9
6251
 
110 Ultrapar Participacoes Sa (UGP)
25.71
3.1
12621
 
104 Vanguard FTSE Emerging Markets (VWO)
41.24
1.9
622375
 

The Relative Strength Indicator (RSI) provides a measure of the strength of a stock’s 13-week price movement relative to the S&P 500 index. Stocks outperforming the index have an RSI value above 100.


But should investors be jumping on these stocks now? Timing is everything for active traders, but is now the time for investors with a longer trade horizon? For the technician evaluating a multi-year chart of the iShares MSCI Emerging Markets ETF (EEM-N), for instance, the answer to the question would come from further price development above a long-term price formation that indicates consolidation. Even the impressive spring rally that has propelled Brazilian stocks is not convincing enough when measured against the backdrop of a bearish long-term trend. How can we know if the rewards will match the risk inherent in these markets?

Stock Trends indicators report on price trends, but they also give guidance on what kind of future returns those trend categories imply. Sampling indicator combinations like the ones currently sported by these emerging market issues and statistically measuring post-observation returns gives us a more quantitative interpretation of this group of performing stocks and ETFs.

For example, the sample of 145 stocks that have had similar Stock Trends indicator combination and trend longevity as the iShares MSCI Brazil Capped ETF (EWZ-N) gives us an expected return below the expected market return for the coming 4-week, 13-week and 40-week time periods. The graph below shows the distribution of 13-week returns of the sample and the assumed normal distribution of the population of stocks with similar Stock Trends indicators.

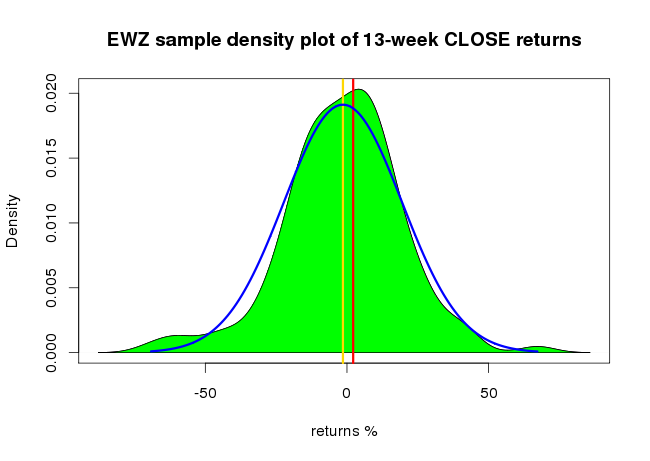
The sample density distribution is filled in green. The assumed population distribution - a normal distribution - is outlined in blue. The vertical yellow line indicates the estimated population mean return. The vertical red line indicates the base return of a randomly selected stock.

The following heatmap graph ranks some of the issues highlighted here by estimated returns implied in the market conditions categorized by the Stock Trends indicators. The estimated returns (%) of 4-week, 13-week, and 40-week periods are discounted by the base period expected market returns. The green elements of the map represent progressively higher performance expectations. Yellow elements represent market performance, while red elements represent progressively lower performance expectations.


Ranking of returns expectations: 4-week, 13-week, 40-week


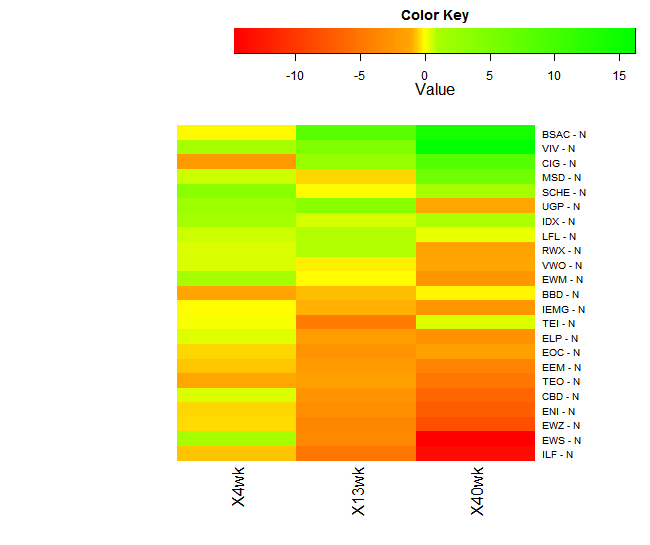
What does this tell us? The statistical inference analysis doesn't give the investor much confidence about returns over the next three quarters for many of these issues. This is not to say that these emerging market issues are not now in nascent stages of bullish trends, but the markers of more promising return expectations in the immediate future are not yet in place. For more conservative investors there is no need to jump on these risky markets yet. 


back to top

Subscriber Testimonials

  • I find your website and research very helpful in my stock trading. I have subscribed to several related services in the past and none present their work with “just the facts” as you. Please keep up the great work so that I can continue to learn! 

    Bryan E., Subscriber
  • Hence, anyone who had followed the "Stock Trends" line should have sold their Bre-X shares and, with the windfall, paid for a lifetime subscription to The Globe and Mail and more. Talk about return on investment!

    Muni P., Subscriber

  • You have created and maintained an amazing, highly educational program and I am grateful for your part in getting our retirement funds to the good place they are.

    Karin M., Subscriber
  • I've followed a number of Stock Trends picks, and the methodology is solid.

    Doug B., Subscriber

  • Your report is an impressive, excellent tool and I have recommmended it to friends.

    Colin E., Subscriber

  • Stock Trends Weekly Reporter is an easy way to pick up equities that represent an upward trend.

    Subscriber
  • I am just writing to tell you of my appreciation of your service! It makes so much sense to me. You seem to be an oasis of stability and sensibility in a stockmarket jungle.

    Adrian S., Subscriber

  • I've followed your recommendations since reading your columns in the Globe & Mail, and finding they published Stock Trends arrows in their financial listings. I do find them a guide to the general market and what I should be avoiding for declining chart trends.
    Has probably saved me the subscription by not rushing into hot stocks!

    Anthony D., Subscriber
  • Thank you for your excellent work and kind approach to your customers.

    Odette C., Subscriber

  • Stock Trends information is part of the base information I review before making a trade.

    Subscriber
  • Just thought I'd call to thank you, Skot. Stock Trends Weekly Reporter helped pay for my daughter's education!

    Peter H., Subscriber

  • I have had the good fortune to be reasonably successful and enjoy the investment process. Your process would be recommended for both experts and those who are new to investing.

    Frank I., Subscriber
  • I very much like the systematic approach to analyzing stock data, it fits my approach.

    Subscriber
  • An admitted cynic, it's obviously very high praise when he says he likes StockTrends because of its "simplicity, utility, openness, [and] honesty," and in addition to having "no hidden agenda" is "understandably documented [and] historically verifiable." And, he adds, "It lets me see a lot of things without doing a lot of work." Globe and Mail

    Paul W., Subscriber

  • I am fascinated with your service and methodology - it is very impressive. [...] Over the years I have concluded that there are many ways to approach stock investing, but once one has chosen a path, one is better off sticking to it.

    Bob E., Subscriber

  • I use Stock Trends to help direct my stock picks. Also, following the advice of Stock Trends I have religiously used stop-loss orders and have avoided hanging on to losing stocks for emotional reasons.

    John B., Subscriber
  • Stock Trends analysis quantifies nicely the movement of individual stocks. I’ve found that if the technicals are out of synch with fundamental analysis, it is a wake-up call to make a decision. The Stock Trends Bull/Bear Ratio is useful in identifying major market bottoms and tops. It has always presented a good buying or selling opportunity.

    Charles G., Subscriber
  • There is a lot to be gained from comparing trends of how individual stocks are doing within a sector, as well as how the sector is performing relative to the broad market.

    Dudley R., Subscriber

  • I want to thank you for posting such an excellent guide to technical analysis on the web. You have provided a great service to all of us novice investors.

    Michael C., Stock Trends user
  • I am something of a momentum investor. I find Stock Trends useful as I can look at my portfolio as a “watch list” and quickly see where trends are declining in strength or reversing, so it is particularly useful as a tool in portfolio management regarding sales.

    William C., Subscriber

Subscription Plans

Subscription Plans

STWR - Monthly

$19.95

Monthly subscription plan to Stock Trends Weekly Reporter - pay your monthly subscription fees by having them automatically charged (PayPal only). Free 7-day trial period. Subscribers may cancel before the end of any subscription month.

STWR - 1 Year Prepaid Subscription

$199.00

1 Year Prepaid subscription to Stock Trends Weekly Reporter. Save 16% off monthly rate!

STWR - 2 Year Prepaid Subscription

$299.00

2 Year Prepaid subscription to Stock Trends Weekly Reporter. Save 37% off monthly rate!

STWR - 3 Year Prepaid Subscription

$399.00

3 Year Prepaid subscription to Stock Trends Weekly Reporter. Save 44% off monthly rate!

Stock Trends Editorial

  • High-Volume Leaders: A Closer Look at the Heaviest-Traded Stocks
    High-Volume Leaders: A Closer Look at the Heaviest-Traded Stocks Stock Trends’ Unusually High Volume () indicator flags stocks whose weekly trading volume is at least 200% of their 13-week average. In the October 31 weekly reports, only a small slice of the universe qualifies—making these signals rare and valuable. When high volume coincides with a bullish trend state (or a new Bullish Crossover), it can mark institutional footprints at the start of a multi-week advance.
    Read more...
  • Positioning for Opportunity: Trade Detente and Stock Trends Momentum
    Positioning for Opportunity: Trade Detente and Stock Trends Momentum The easing of tensions between the world’s two largest economies has given markets a fresh narrative. By stepping back from new export restrictions and cutting key tariffs, the United States and China have removed some of the most disruptive threats hanging over global supply chains. For investors, this détente creates a backdrop of relative stability in which powerful price trends can resume and new trend…
    Read more...
  • From Flash Crash to Rotation: The Probability–Payoff Map of a Rebuilding Market
    From Flash Crash to Rotation: The Probability–Payoff Map of a Rebuilding Market The market’s October tremor—an abrupt but short-lived flash crash—has given way to a familiar pattern in the Stock Trends framework: the rapid repair of breadth and the birth of new trends. Where panic once pressed prices indiscriminately, order is returning through a disciplined sequence of new bullish signals, rebuilding sectors, and the subtle reorganization of leadership beneath the surface.
    Read more...
  • Random Portfolios as a Benchmark: A Smarter Yardstick for Performance
    Random Portfolios as a Benchmark: A Smarter Yardstick for Performance Investors often compare performance to market indexes like the S&P 500, but traditional benchmarks have built-in biases. The S&P 500, for example, is heavily skewed toward large-cap stocks and “is not a good benchmark for measuring alpha” – it reflects a size-factor bias rather than pure manager skill. All major indexes systematically tilt toward certain factors (size, sector, value/growth, etc.), meaning they’re not truly passive…
    Read more...
View all Stock Trends Editorials


Subscription Plans

STWR - Monthly

$19.95/Month

Monthly subscription plan to Stock Trends Weekly Reporter - pay your monthly subscription fees by having them automatically charged (PayPal only). Free 7-day trial period. Subscribers may cancel before the end of any subscription month.

STWR - 1 Year Prepaid Subscription

$199/Year

1 Year Prepaid subscription to Stock Trends Weekly Reporter. Save 16% off monthly rate!

STWR - 2 Year Prepaid Subscription

$299/2 Years

2 Year Prepaid subscription to Stock Trends Weekly Reporter. Save 37% off monthly rate!

STWR - 3 Year Prepaid Subscription

$399/3 Years

3 Year Prepaid subscription to Stock Trends Weekly Reporter. Save 44% off monthly rate!