Stock Trends RSI +/- Pattern Analysis

  • 22 September 2014 |
  • Written by  Skot Kortje, Stock Trends Analyst
  • font size
  • Print

The new Stock Trends RSI +/- analysis provides guidance on probable outcomes and expected returns in next week's trading.

Stock Trends Reports new Profile tab now also includes a pattern analysis of the RSI +/- indicator. This analysis looks to answer questions about a stock's volatility in particular price trends and how weekly price movement provides an indication of probable outcomes for the coming week.


The Stock Trends RSI +/- indicator is a simple binary marker of weekly price performance relative to the benchmark market index. If a stock (all North American trading issues and indexes covered by the Stock Trends analysis) outperforms the benchmark (the S&P 500 for U.S. stocks, the S&P/TSX Composite index for Canadian stocks) the stock is assigned a (+). If it underperforms, it is assigned a (-).


This binary notation of price performance can be a useful framework for an event sample space and inference model. From this we can derive probabilities of certain outcomes and estimate one week returns (%).


Binary events are always interesting. They provide a simple modeled sample space of possible outcomes. The most common example is the flipping of a coin. We know when we flip a fair coin that there is a 50% chance that the outcome will be heads, and an equal 50% chance the outcome will be tails. How does this kind of random event compare to the binary RSI +/- event?


Indeed, there is no surprise when the Stock Trends data reveals that almost all stocks have a near-50% chance of turning up an RSI +/- on any given week. But that is for a sample space that includes all the data. For instance, for IBM the Stock Trends weekly data shows that of the 1,800 weeks covered, 49.5% of observations show an RSI (+) as the weekly indicator. Although some stocks like INTC show a 51.6% probability of a (+) over their history, the mean value across all stocks tends to 50%.


A question derived from this random-like event becomes quite apparent: how does this probability change under different market characteristics? For example, if a stock is in a Stock Trends Bullish trend, what is the probability of an RSI (+) indicator? We can also ask what is the probability we will see an RSI (+) in the upcoming week if the previous week was also a (+) while the stock is in a Bullish trend?


Using the samples of the stock's data history that match certain patterns of market performance and underperformance we can also derive similar probability statements. Although this analysis operates under the assumption of randomness in market returns, we are looking at the pattern of past performance and estimate the probability of an outcome derived from the event sample space.


In short, like a gambler looking for evidence of an 'unfair' coin that can be capitalized on, we are looking for evidence of a pattern that provides us with better probabilities of a desired outcome than the base probability - which is 50%.


Introduced in last week's editorial, the Stock Trends Reports Profile section is the first element of the Stock Trends Inference Model - the implied population parameters and distribution of like Stock Trends indicator combinations. Also presented was a heatmap that ranks the estimated returns of stocks in an industry group. These elements of the inference model focus on homogeneous patterns across markets and estimates 4-week, 13-week, and 40-week returns for individual stocks. The RSI +/- pattern analysis differs by focusing on patterns with the stock itself, estimating returns based on these internal samples.


Last week AAPL was presented as an example, so we'll use it again for illustrating the RSI +/- pattern analysis. Below we can see the most recent history of the weekly Stock Trends indicators for AAPL.

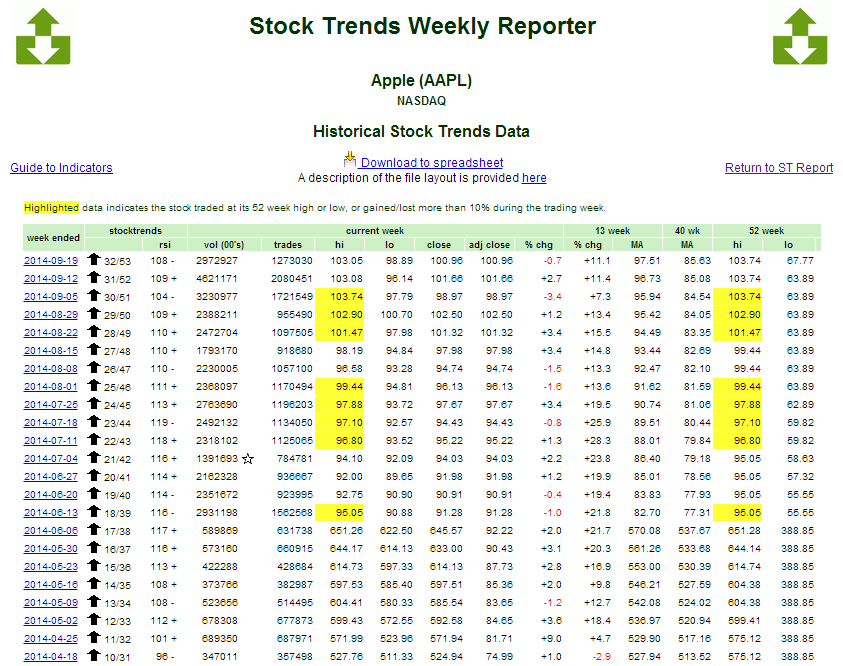
The current RSI +/- indicator is (-). In this analysis two categorical variables - the Stock Trends trend indicator and the RSI +/- indicator - are inputs. The output is the returns, or percentage change in price, in the week following the observation. What kind of returns (%) do the data show after the observation of a particular pattern of RSI +/- indicators when a stock is labeled in a specific trend?


Here is the current RSI +/- pattern analysis of AAPL:

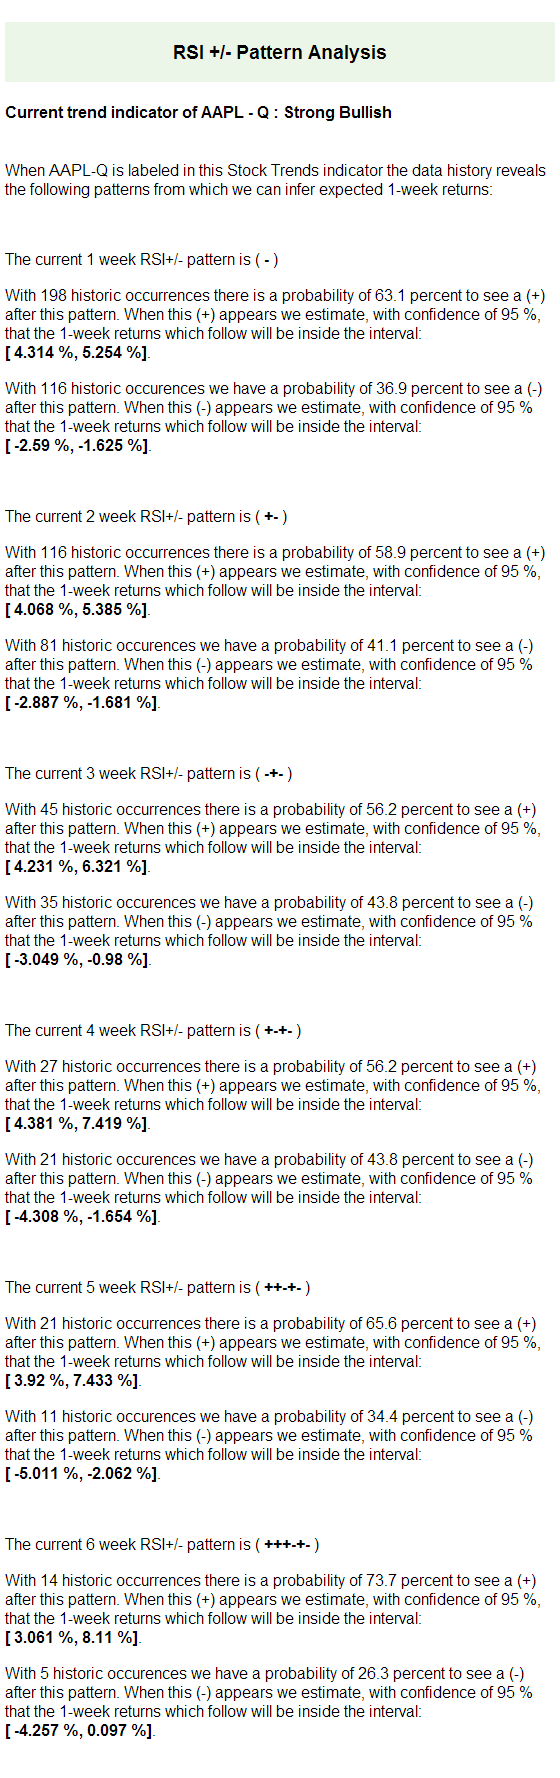
To repeat, only weeks of the AAPL data showing the same trend indicator as the current trend indicator (strong Bullish) of AAPL are evaluated. Here we are looking to find how the binary RSI +/- probabilities differs from the probabilities we already understand about the aggregate for this and most stocks - a near 50% chance of either a (+) or a (-).


Is the coin somehow biased in a particular trend? If so, to what degree? In this case, given the current RSI +/- patterns for AAPL, what does the data history tell us about how the stock performed subsequently to these patterns when the stock was in the same Bullish trend?


The length of the longest pattern of RSI +/- indicators for each stock analyzed depends on the data available. Here the longest pattern measured is 6-weeks long. However, practical usage of the analysis probably lends itself best to periods of three or four weeks.


In any event, the probabilities for binary outcomes as the pattern extends is of interest in evaluating the quality of the probabilities of the shorter term patterns. In the current AAPL example, the patterns all suggest that the current market underperformance indicated by the (-) will most probably be followed by a market outperformance (+).


Of course, with a given probability of market outperformance we would like to know the returns expectations. If AAPL does outperform the market next week, what is the expected change in price in the coming week? The analysis above defines intervals for the returns expectations for AAPL for each length of the pattern - here from one to six weeks.


This type of short-term price movement analysis can be used in tandem with the longer-term analysis provided by the Stock Trends Inference Model and detailed above the RSI +/- Pattern Analysis on the Profile tab of each Stock Trends Report. It can also be profitably used in short-term options trade setups, something Stock Trends will be able to advise about in the future.

back to top

Subscriber Testimonials

  • I am something of a momentum investor. I find Stock Trends useful as I can look at my portfolio as a “watch list” and quickly see where trends are declining in strength or reversing, so it is particularly useful as a tool in portfolio management regarding sales.

    William C., Subscriber
  • I am just writing to tell you of my appreciation of your service! It makes so much sense to me. You seem to be an oasis of stability and sensibility in a stockmarket jungle.

    Adrian S., Subscriber

  • I want to thank you for posting such an excellent guide to technical analysis on the web. You have provided a great service to all of us novice investors.

    Michael C., Stock Trends user
  • Stock Trends analysis quantifies nicely the movement of individual stocks. I’ve found that if the technicals are out of synch with fundamental analysis, it is a wake-up call to make a decision. The Stock Trends Bull/Bear Ratio is useful in identifying major market bottoms and tops. It has always presented a good buying or selling opportunity.

    Charles G., Subscriber
  • I've followed a number of Stock Trends picks, and the methodology is solid.

    Doug B., Subscriber

  • There is a lot to be gained from comparing trends of how individual stocks are doing within a sector, as well as how the sector is performing relative to the broad market.

    Dudley R., Subscriber

  • Stock Trends Weekly Reporter is an easy way to pick up equities that represent an upward trend.

    Subscriber
  • I have had the good fortune to be reasonably successful and enjoy the investment process. Your process would be recommended for both experts and those who are new to investing.

    Frank I., Subscriber
  • I find your website and research very helpful in my stock trading. I have subscribed to several related services in the past and none present their work with “just the facts” as you. Please keep up the great work so that I can continue to learn! 

    Bryan E., Subscriber
  • I am fascinated with your service and methodology - it is very impressive. [...] Over the years I have concluded that there are many ways to approach stock investing, but once one has chosen a path, one is better off sticking to it.

    Bob E., Subscriber

  • Your report is an impressive, excellent tool and I have recommmended it to friends.

    Colin E., Subscriber

  • I use Stock Trends to help direct my stock picks. Also, following the advice of Stock Trends I have religiously used stop-loss orders and have avoided hanging on to losing stocks for emotional reasons.

    John B., Subscriber
  • Just thought I'd call to thank you, Skot. Stock Trends Weekly Reporter helped pay for my daughter's education!

    Peter H., Subscriber

  • Thank you for your excellent work and kind approach to your customers.

    Odette C., Subscriber

  • An admitted cynic, it's obviously very high praise when he says he likes StockTrends because of its "simplicity, utility, openness, [and] honesty," and in addition to having "no hidden agenda" is "understandably documented [and] historically verifiable." And, he adds, "It lets me see a lot of things without doing a lot of work." Globe and Mail

    Paul W., Subscriber

  • Hence, anyone who had followed the "Stock Trends" line should have sold their Bre-X shares and, with the windfall, paid for a lifetime subscription to The Globe and Mail and more. Talk about return on investment!

    Muni P., Subscriber

  • I've followed your recommendations since reading your columns in the Globe & Mail, and finding they published Stock Trends arrows in their financial listings. I do find them a guide to the general market and what I should be avoiding for declining chart trends.
    Has probably saved me the subscription by not rushing into hot stocks!

    Anthony D., Subscriber
  • You have created and maintained an amazing, highly educational program and I am grateful for your part in getting our retirement funds to the good place they are.

    Karin M., Subscriber
  • Stock Trends information is part of the base information I review before making a trade.

    Subscriber
  • I very much like the systematic approach to analyzing stock data, it fits my approach.

    Subscriber

Subscription Plans

Subscription Plans

STWR - Monthly

$19.95

Monthly subscription plan to Stock Trends Weekly Reporter - pay your monthly subscription fees by having them automatically charged (PayPal only). Free 7-day trial period. Subscribers may cancel before the end of any subscription month.

STWR - 1 Year Prepaid Subscription

$199.00

1 Year Prepaid subscription to Stock Trends Weekly Reporter. Save 16% off monthly rate!

STWR - 2 Year Prepaid Subscription

$299.00

2 Year Prepaid subscription to Stock Trends Weekly Reporter. Save 37% off monthly rate!

STWR - 3 Year Prepaid Subscription

$399.00

3 Year Prepaid subscription to Stock Trends Weekly Reporter. Save 44% off monthly rate!

Stock Trends Editorial

  • High-Volume Leaders: A Closer Look at the Heaviest-Traded Stocks
    High-Volume Leaders: A Closer Look at the Heaviest-Traded Stocks Stock Trends’ Unusually High Volume () indicator flags stocks whose weekly trading volume is at least 200% of their 13-week average. In the October 31 weekly reports, only a small slice of the universe qualifies—making these signals rare and valuable. When high volume coincides with a bullish trend state (or a new Bullish Crossover), it can mark institutional footprints at the start of a multi-week advance.
    Read more...
  • Positioning for Opportunity: Trade Detente and Stock Trends Momentum
    Positioning for Opportunity: Trade Detente and Stock Trends Momentum The easing of tensions between the world’s two largest economies has given markets a fresh narrative. By stepping back from new export restrictions and cutting key tariffs, the United States and China have removed some of the most disruptive threats hanging over global supply chains. For investors, this détente creates a backdrop of relative stability in which powerful price trends can resume and new trend…
    Read more...
  • From Flash Crash to Rotation: The Probability–Payoff Map of a Rebuilding Market
    From Flash Crash to Rotation: The Probability–Payoff Map of a Rebuilding Market The market’s October tremor—an abrupt but short-lived flash crash—has given way to a familiar pattern in the Stock Trends framework: the rapid repair of breadth and the birth of new trends. Where panic once pressed prices indiscriminately, order is returning through a disciplined sequence of new bullish signals, rebuilding sectors, and the subtle reorganization of leadership beneath the surface.
    Read more...
  • Random Portfolios as a Benchmark: A Smarter Yardstick for Performance
    Random Portfolios as a Benchmark: A Smarter Yardstick for Performance Investors often compare performance to market indexes like the S&P 500, but traditional benchmarks have built-in biases. The S&P 500, for example, is heavily skewed toward large-cap stocks and “is not a good benchmark for measuring alpha” – it reflects a size-factor bias rather than pure manager skill. All major indexes systematically tilt toward certain factors (size, sector, value/growth, etc.), meaning they’re not truly passive…
    Read more...
View all Stock Trends Editorials


Subscription Plans

STWR - Monthly

$19.95/Month

Monthly subscription plan to Stock Trends Weekly Reporter - pay your monthly subscription fees by having them automatically charged (PayPal only). Free 7-day trial period. Subscribers may cancel before the end of any subscription month.

STWR - 1 Year Prepaid Subscription

$199/Year

1 Year Prepaid subscription to Stock Trends Weekly Reporter. Save 16% off monthly rate!

STWR - 2 Year Prepaid Subscription

$299/2 Years

2 Year Prepaid subscription to Stock Trends Weekly Reporter. Save 37% off monthly rate!

STWR - 3 Year Prepaid Subscription

$399/3 Years

3 Year Prepaid subscription to Stock Trends Weekly Reporter. Save 44% off monthly rate!