Bearish sentiment builds

  • 24 October 2014 |
  • Written by  Skot Kortje, Stock Trends Analyst
  • font size
  • Print

The S&P 500 index's 4.1% recovery last week may be heartening, but fading investor sentiment should keep investors on high alert. 

Investors are always looking for the door. Even when returns are abundant and investor sentiment is wildly bullish, shareholders know that plump investment accounts are but paper profits - only real when the trigger is pulled and equity is once again cash. The degree to which investors look more nervously to the exit is proportional to the degree to which their equity positions are compromised. How we measure that compromise helps us identify critical shifts in investor sentiment and recognize high-risk market periods.


Stock Trends is by design a categorical reporting framework that gives us a measure of aggregate investor sentiment and a metric for determining when market participants are feeling the squeeze and most ready to dash for the cash. The Stock Trends Bull/Bear Ratio is now serving notice that the exit doors are wide open.


Most market analysts look at benchmark indexes of price level, pointing to areas of support and resistance to anticipate market rallies and corrections. Certainly, the 6% drop in the S&P 500 index from the market high in September sounded alarm bells. But we have had corrections of 5% and more multiple times during the bull market run since 2009. Can we expect this is just another typical and expected correction that will soon be subdued? Price level analysis can conjecture about that, but a measure of market breadth is the best barometer of how sentiment has truly shifted.


The Stock Trends Bull/Bear Ratio measures the distribution of Stock Trends trend categories and tells us something quite simple: are the majority of stocks trending positively or negatively? Are the diversified holdings of investors buoyed by a rising tide or sinking in aggregate?


The Stock Trends trend indicators categorize individual trends by the conditions of a simple moving average study. The base categories - Bullish or Bearish - are determined by the relationship of the 13-week and 40-week moving averages of price. If the 13-week average price is above the 40-week average price the stock is categorized as Bullish. If it is below the stock is categorized as Bearish. This is a factual reporting of past price performance.


The price smoothing aspect of average prices gives us a clearer idea of trends, and although these longer-term time parameters are lagging in nature, they do make it possible to characterize long-term price movement. It is this long-term price movement that most shifts the balance of investor sentiment and creates heightened periods of anxiety about equities.


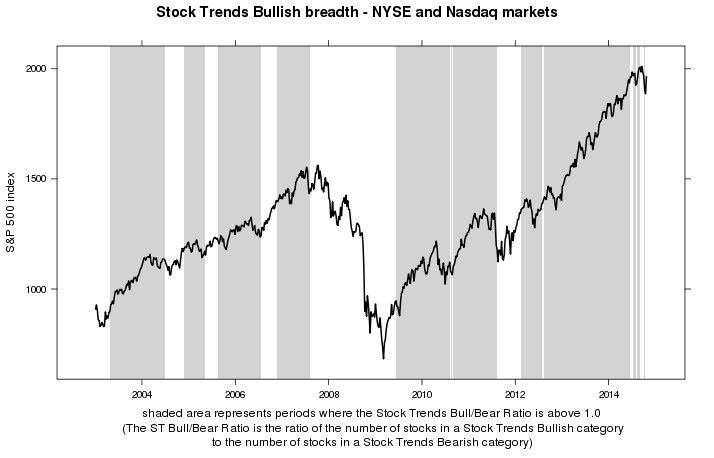
Stock Trends tabulates the Bull/Bear Ratio for individual North American exchanges. The New York Stock Exchange Bull/Bear Ratio has been plummeting since August, and is now at 1.07. The Nasdaq Bull/Bear Ratio dropped below 1.0 in June and is now at 0.66. When we look at the composite of both major exchanges - some 5,660 common stocks that currently have Stock Trends trend indicators - we get a good look at the trend breadth of the U.S. stock market.


The graph below highlights periods where the Stock Trends Bull/Bear Ratio for the combined Big Board and Nasdaq exchanges has been rated as 'Bullish'. These shaded areas tell us when investor sentiment provides more fertile ground for market rallies and rebounds. There will be times when the S&P 500 index rallies without broader market support , like in late 2006, but these can represent divergences between large cap and small cap performances. Generally, a strong bullish investor sentiment is characterized across the stock market. The Stock Trends Bull/Bear Ratio gives us that representation of market breadth.


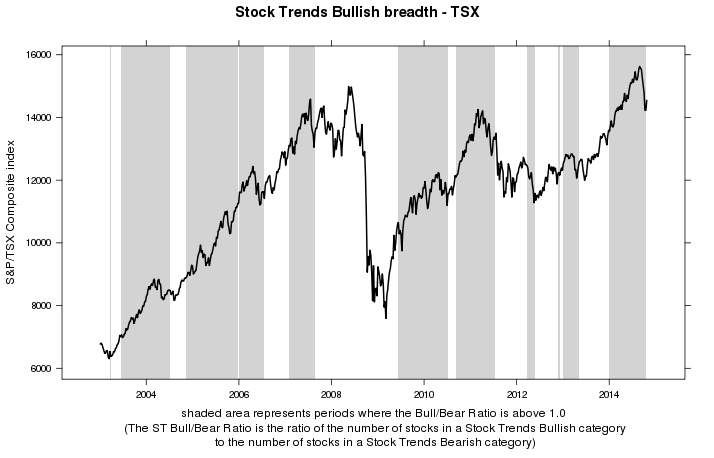
Where are we at now? The U.S. market Bull/Bear Ratio has been flirting with a Bearish investor sentiment reading since the market top in the summer, and has now dropped to 0.7. Canadian investors sentiment has also dipped into Bearish territory - the Stock Trends TSX Bull/Bear Ratio fell below 1.0 this week (now at 0.85).


Stock Trends Bull/Bear Ratio - NYSE and Nasdaq


Stock Trends Bull/Bear Ratio - TSX

Investors should take note that this aggregate North American trend condition makes the market vulnerable to a crash as investors increasingly weigh in about making an exit. The S&P 500 index's 4.1% recovery last week may be heartening, but fading investor sentiment should keep investors on high alert.

back to top

Subscriber Testimonials

  • Stock Trends information is part of the base information I review before making a trade.

    Subscriber
  • I am fascinated with your service and methodology - it is very impressive. [...] Over the years I have concluded that there are many ways to approach stock investing, but once one has chosen a path, one is better off sticking to it.

    Bob E., Subscriber

  • I very much like the systematic approach to analyzing stock data, it fits my approach.

    Subscriber
  • An admitted cynic, it's obviously very high praise when he says he likes StockTrends because of its "simplicity, utility, openness, [and] honesty," and in addition to having "no hidden agenda" is "understandably documented [and] historically verifiable." And, he adds, "It lets me see a lot of things without doing a lot of work." Globe and Mail

    Paul W., Subscriber

  • Thank you for your excellent work and kind approach to your customers.

    Odette C., Subscriber

  • I've followed your recommendations since reading your columns in the Globe & Mail, and finding they published Stock Trends arrows in their financial listings. I do find them a guide to the general market and what I should be avoiding for declining chart trends.
    Has probably saved me the subscription by not rushing into hot stocks!

    Anthony D., Subscriber
  • I have had the good fortune to be reasonably successful and enjoy the investment process. Your process would be recommended for both experts and those who are new to investing.

    Frank I., Subscriber
  • I am just writing to tell you of my appreciation of your service! It makes so much sense to me. You seem to be an oasis of stability and sensibility in a stockmarket jungle.

    Adrian S., Subscriber

  • Your report is an impressive, excellent tool and I have recommmended it to friends.

    Colin E., Subscriber

  • Hence, anyone who had followed the "Stock Trends" line should have sold their Bre-X shares and, with the windfall, paid for a lifetime subscription to The Globe and Mail and more. Talk about return on investment!

    Muni P., Subscriber

  • I use Stock Trends to help direct my stock picks. Also, following the advice of Stock Trends I have religiously used stop-loss orders and have avoided hanging on to losing stocks for emotional reasons.

    John B., Subscriber
  • Stock Trends analysis quantifies nicely the movement of individual stocks. I’ve found that if the technicals are out of synch with fundamental analysis, it is a wake-up call to make a decision. The Stock Trends Bull/Bear Ratio is useful in identifying major market bottoms and tops. It has always presented a good buying or selling opportunity.

    Charles G., Subscriber
  • I want to thank you for posting such an excellent guide to technical analysis on the web. You have provided a great service to all of us novice investors.

    Michael C., Stock Trends user
  • I am something of a momentum investor. I find Stock Trends useful as I can look at my portfolio as a “watch list” and quickly see where trends are declining in strength or reversing, so it is particularly useful as a tool in portfolio management regarding sales.

    William C., Subscriber
  • You have created and maintained an amazing, highly educational program and I am grateful for your part in getting our retirement funds to the good place they are.

    Karin M., Subscriber
  • I've followed a number of Stock Trends picks, and the methodology is solid.

    Doug B., Subscriber

  • There is a lot to be gained from comparing trends of how individual stocks are doing within a sector, as well as how the sector is performing relative to the broad market.

    Dudley R., Subscriber

  • Just thought I'd call to thank you, Skot. Stock Trends Weekly Reporter helped pay for my daughter's education!

    Peter H., Subscriber

  • Stock Trends Weekly Reporter is an easy way to pick up equities that represent an upward trend.

    Subscriber
  • I find your website and research very helpful in my stock trading. I have subscribed to several related services in the past and none present their work with “just the facts” as you. Please keep up the great work so that I can continue to learn! 

    Bryan E., Subscriber

Subscription Plans

Subscription Plans

STWR - Monthly

$19.95

Monthly subscription plan to Stock Trends Weekly Reporter - pay your monthly subscription fees by having them automatically charged (PayPal only). Free 7-day trial period. Subscribers may cancel before the end of any subscription month.

STWR - 1 Year Prepaid Subscription

$199.00

1 Year Prepaid subscription to Stock Trends Weekly Reporter. Save 16% off monthly rate!

STWR - 2 Year Prepaid Subscription

$299.00

2 Year Prepaid subscription to Stock Trends Weekly Reporter. Save 37% off monthly rate!

STWR - 3 Year Prepaid Subscription

$399.00

3 Year Prepaid subscription to Stock Trends Weekly Reporter. Save 44% off monthly rate!

Stock Trends Editorial

  • Stock Trends Inference Model: A Statistical Foundation for Smarter Investing
    Stock Trends Inference Model: A Statistical Foundation for Smarter Investing At the heart of Stock Trends is a conviction: market data is not noise, but information. For more than three decades, the Stock Trends framework has given investors a disciplined way to interpret market cycles, trend signals, and momentum patterns. The Stock Trends Inference Model (ST-IM) is the natural extension of this approach, embedding rigorous statistical reasoning into the reports available for every listed stock…
    Read more...
  • Technology Sector Split: Hardware & Chips vs. Software – A Deep Dive with Stock Trends
    Technology Sector Split: Hardware & Chips vs. Software – A Deep Dive with Stock Trends The uncertain interest rate environment is evident in a number of sectors, and the stock market is always reflecting both the trend of the cost of capital and the anticipation of changes in it. The technology sector is especially sensitive to interest rates and generally feeds off the risk-on investor appetite supported by lower interest rates or expectations of relatively lower rates. But all technology…
    Read more...
  • Resource rotation remains strong
    Resource rotation remains strong The summer season is coming to a close. It is sometimes a sleepy market season because investor attention is elsewhere. However, the market has provided us with some definite messaging over the past few months. The themes of rotation and building strength in resources and energy stocks, notably fueled by an AI transformation across the broader economy, are key highlights that investors should pay attention…
    Read more...
View all Stock Trends Editorials


Subscription Plans

STWR - Monthly

$19.95/Month

Monthly subscription plan to Stock Trends Weekly Reporter - pay your monthly subscription fees by having them automatically charged (PayPal only). Free 7-day trial period. Subscribers may cancel before the end of any subscription month.

STWR - 1 Year Prepaid Subscription

$199/Year

1 Year Prepaid subscription to Stock Trends Weekly Reporter. Save 16% off monthly rate!

STWR - 2 Year Prepaid Subscription

$299/2 Years

2 Year Prepaid subscription to Stock Trends Weekly Reporter. Save 37% off monthly rate!

STWR - 3 Year Prepaid Subscription

$399/3 Years

3 Year Prepaid subscription to Stock Trends Weekly Reporter. Save 44% off monthly rate!