Industry return expectations

  • 04 March 2015 |
  • Written by  Skot Kortje, Stock Trends Analyst
  • font size
  • Print

Wondering which U.S. sectors and industry groups are signalling the best opportunities for returns in the period ahead?

Wondering which U.S. sectors and industry groups are signalling the best opportunities for returns in the period ahead? The Stock Trends Inference Model presents a quantitative look at period returns for individual stocks, and from those return expectations the sector and industry group average return expectations can be measured.


Recall that the Stock Trends Inference Model estimates the returns expectations for a stock, ETF or income trust given its current Stock Trends indicators. It does this by sampling for similar combinations of Stock Trends indicators over the past 30-years and measures post-observation price performance. From these samples statistical inference methodology is applied to estimate population mean and standard deviation parameters.


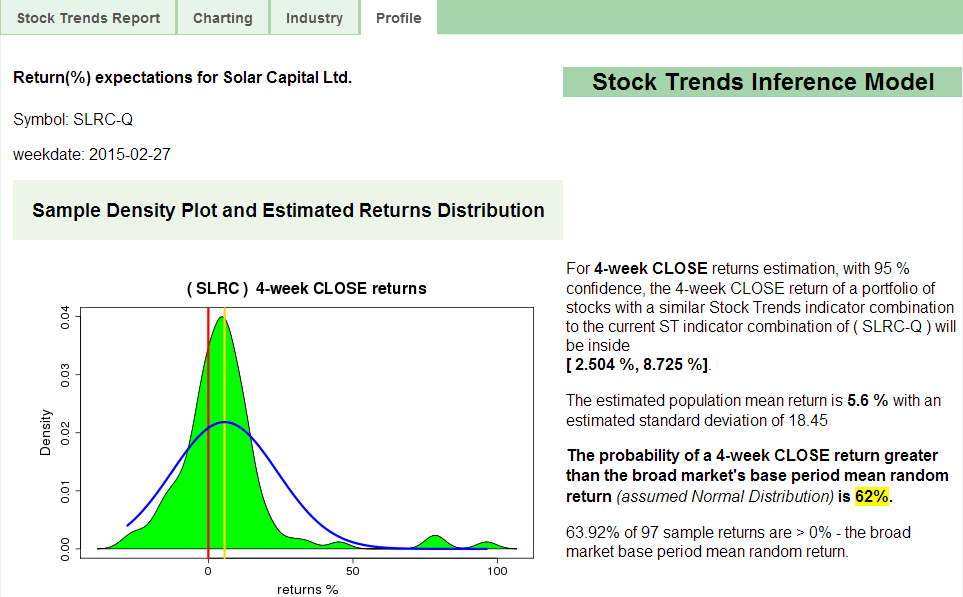
Every week over 6,000 issues have a Stock Trends indicator combination that has a minimum of 50 similar combinations in the data history, and you can find the resultant probability analysis in the Profile tab of these individual Stock Trends Reports. For instance, the current Stock Trends Profile of Solar Capital Ltd. (SLRC) shows that the expected 4-week return will be 5.6% and that the probability of a return greater than the base 4-week return expectation (which is 0%) is 62%. Our base expectation is that a stock has a 50% chance of a positive return in a 4-week period, so SLRC has a better chance of performing well, and is the top Nasdaq ST-IM Select stock this week.


The current week reports on 6,261 listings that have ST-IM returns estimations for 4-week, 13-week, and 40-week periods ahead. Breaking down those listings by sector and industry group gives us a better understanding of market timing trade opportunities. The heatmaps below rank sectors and industry groups by mean relative expectations over the three different time periods.


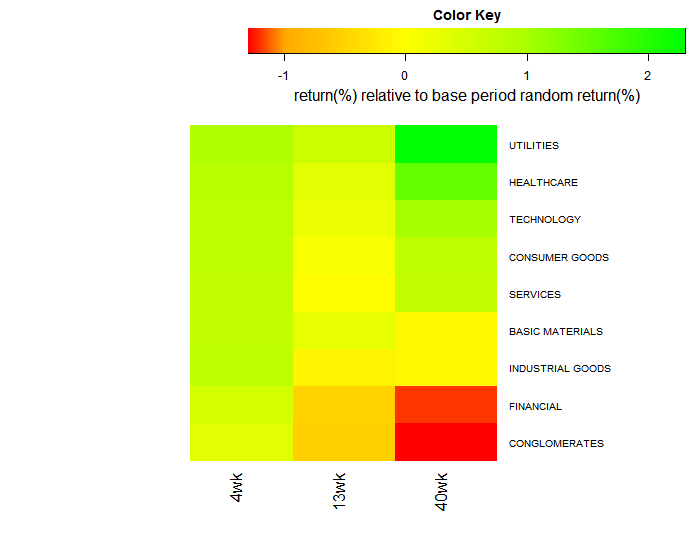
U.S sectors - ranking of return(%) expectations


Currently, the top returns expectations are found in utilities, healthcare, and technology sectors. Conglomerates, Financials, and Industrial sectors have the worst returns expectations.


Each sector breaks down into industry groups. The following heatmap shows how the returns expectations for these groups rank.


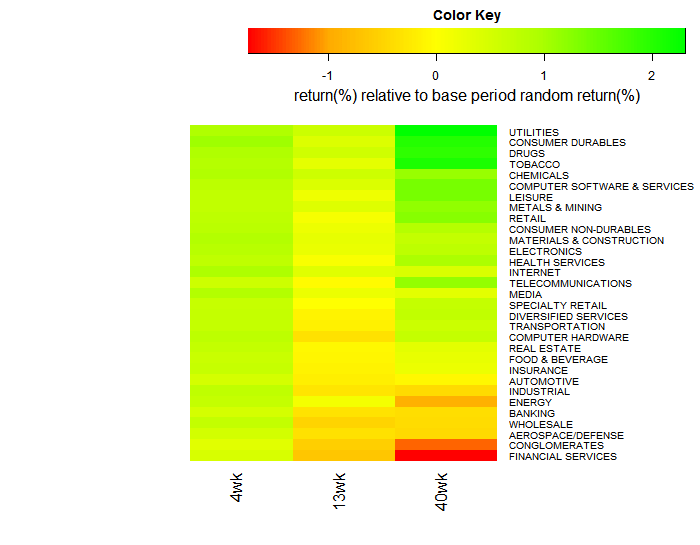
U.S industry groups - ranking of return(%) expectations


The industry groups with the best returns expectations, as averaged over the three periods, include utilities, consumer durables, and drug stocks. Financial services, conglomerates, and aerospace/defense stocks have the worst returns expectations.


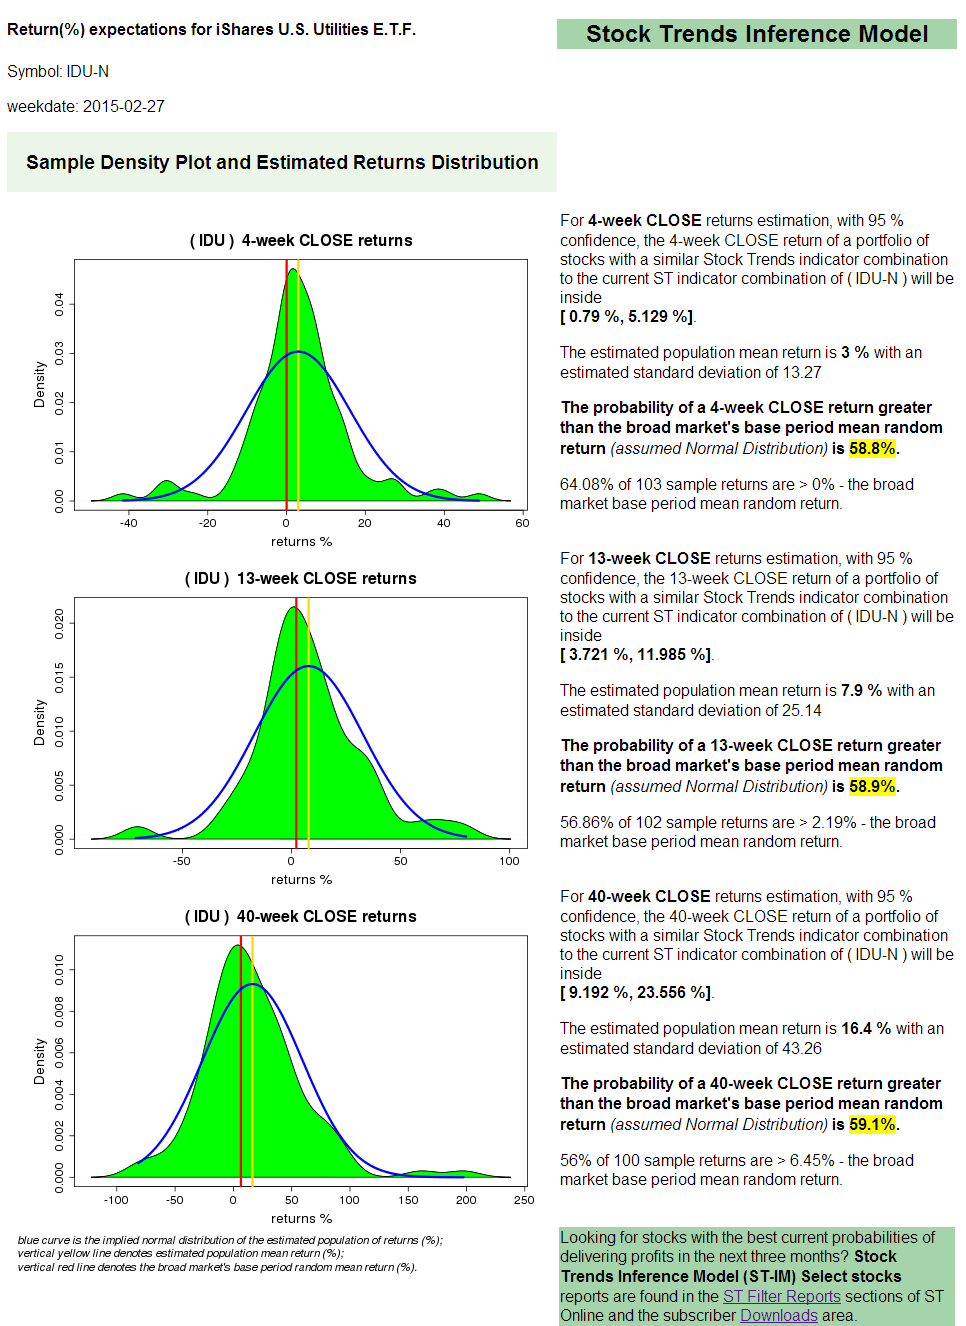
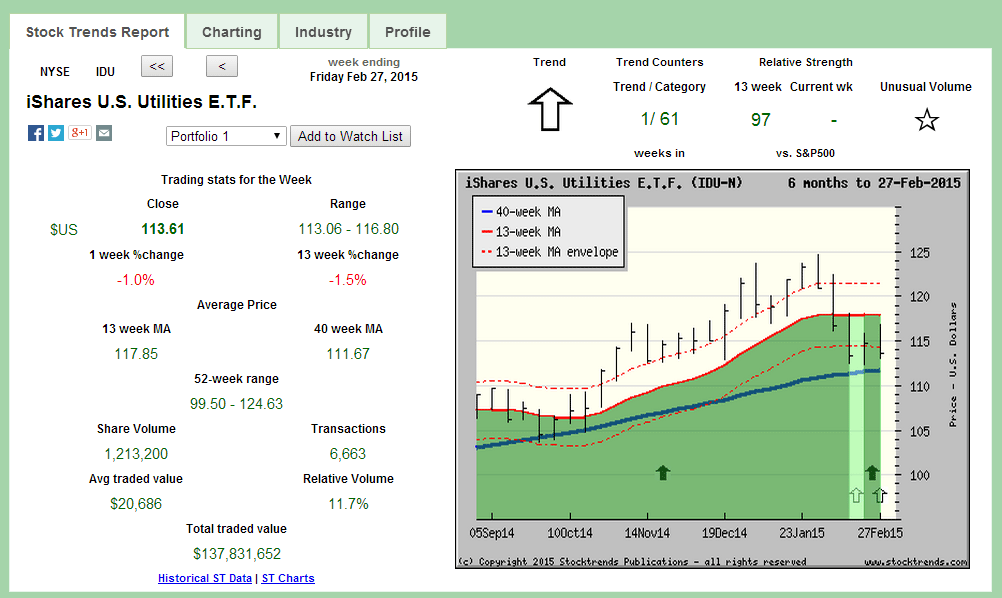
The weekly Stock Trends ST-IM Select report shows the issues (stocks, ETFs, income units) with the best returns expectations over 13-weeks where the returns expectations are better than the base period returns expectations in all three periods (4-week, 13-week, and 40-week). [For rankings of return expectations within each period see the reports Top 4-week returns(%) expectations, Top 13-week returns(%) expectations, Top 40-week returns(%) expectations in the ST Filters reports section.]


Among the top ranked issues in the February 27th NYSE ST-IM report is the iShares U.S. Utilities ETF (IDU). Here Profile report shows that IDU has a 59% probability of beating the base period random return for each of the three periods. Recall that a stock chosen at random has a 50% chance of beating the broad market’s base period random return (i.e. a 0% return over 4-weeks, a 2.19% return over 13-weeks, and a 6.45% return over 40-weeks). With the given assumption of randomness in market returns, a 59% probability of beating a random return constitutes an appreciable edge.


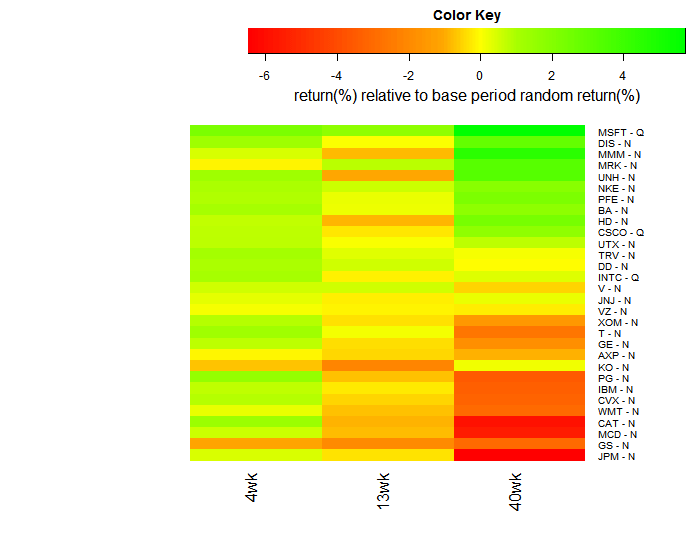
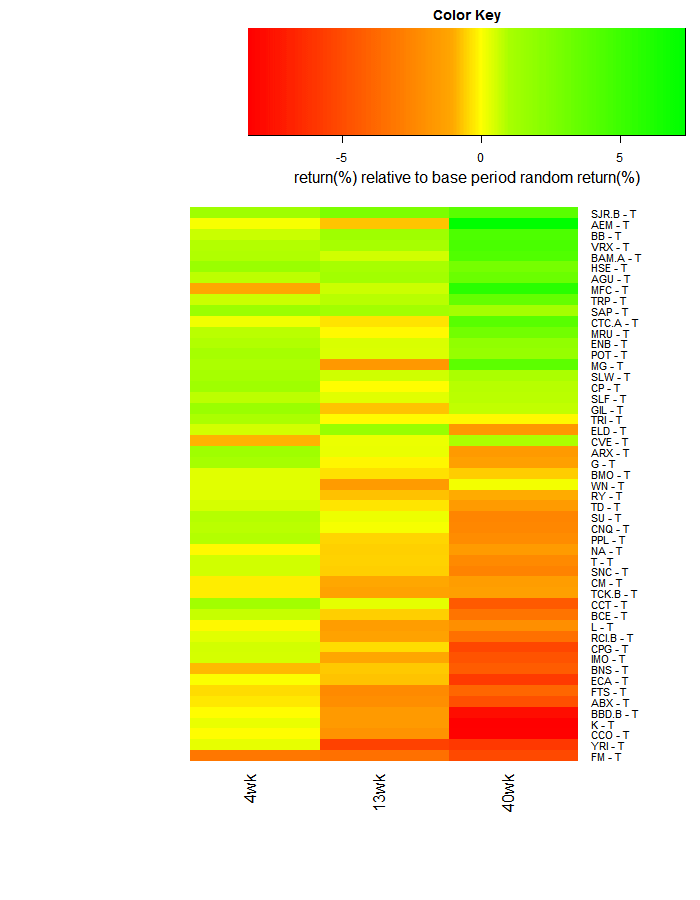
The heatmaps below rank the current returns expectations of large cap stocks represented in the Dow Jones Industrials index and the S&P/TSX 60 index. Microsoft (MSFT), Disney (DIS) and 3-M (MMM) top the DJI rankings, while Shaw Communications (SJR.B), Agnico Eagle Mines (AEM), and Blackberry (BB) have the best blue chip Canadian stocks return expectations. You can view the Profile report of each of these and all stocks on the Stock Trends Report page.


Dow Jones Industrials stocks - ranking of return(%) expectations


S&P/TSX 60 stocks - ranking of return(%) expectations


back to top

Subscriber Testimonials

  • I am something of a momentum investor. I find Stock Trends useful as I can look at my portfolio as a “watch list” and quickly see where trends are declining in strength or reversing, so it is particularly useful as a tool in portfolio management regarding sales.

    William C., Subscriber
  • There is a lot to be gained from comparing trends of how individual stocks are doing within a sector, as well as how the sector is performing relative to the broad market.

    Dudley R., Subscriber

  • I very much like the systematic approach to analyzing stock data, it fits my approach.

    Subscriber
  • I want to thank you for posting such an excellent guide to technical analysis on the web. You have provided a great service to all of us novice investors.

    Michael C., Stock Trends user
  • Thank you for your excellent work and kind approach to your customers.

    Odette C., Subscriber

  • I have had the good fortune to be reasonably successful and enjoy the investment process. Your process would be recommended for both experts and those who are new to investing.

    Frank I., Subscriber
  • I am just writing to tell you of my appreciation of your service! It makes so much sense to me. You seem to be an oasis of stability and sensibility in a stockmarket jungle.

    Adrian S., Subscriber

  • You have created and maintained an amazing, highly educational program and I am grateful for your part in getting our retirement funds to the good place they are.

    Karin M., Subscriber
  • Stock Trends Weekly Reporter is an easy way to pick up equities that represent an upward trend.

    Subscriber
  • I've followed a number of Stock Trends picks, and the methodology is solid.

    Doug B., Subscriber

  • An admitted cynic, it's obviously very high praise when he says he likes StockTrends because of its "simplicity, utility, openness, [and] honesty," and in addition to having "no hidden agenda" is "understandably documented [and] historically verifiable." And, he adds, "It lets me see a lot of things without doing a lot of work." Globe and Mail

    Paul W., Subscriber

  • I am fascinated with your service and methodology - it is very impressive. [...] Over the years I have concluded that there are many ways to approach stock investing, but once one has chosen a path, one is better off sticking to it.

    Bob E., Subscriber

  • I use Stock Trends to help direct my stock picks. Also, following the advice of Stock Trends I have religiously used stop-loss orders and have avoided hanging on to losing stocks for emotional reasons.

    John B., Subscriber
  • I've followed your recommendations since reading your columns in the Globe & Mail, and finding they published Stock Trends arrows in their financial listings. I do find them a guide to the general market and what I should be avoiding for declining chart trends.
    Has probably saved me the subscription by not rushing into hot stocks!

    Anthony D., Subscriber
  • Just thought I'd call to thank you, Skot. Stock Trends Weekly Reporter helped pay for my daughter's education!

    Peter H., Subscriber

  • Stock Trends information is part of the base information I review before making a trade.

    Subscriber
  • Hence, anyone who had followed the "Stock Trends" line should have sold their Bre-X shares and, with the windfall, paid for a lifetime subscription to The Globe and Mail and more. Talk about return on investment!

    Muni P., Subscriber

  • Stock Trends analysis quantifies nicely the movement of individual stocks. I’ve found that if the technicals are out of synch with fundamental analysis, it is a wake-up call to make a decision. The Stock Trends Bull/Bear Ratio is useful in identifying major market bottoms and tops. It has always presented a good buying or selling opportunity.

    Charles G., Subscriber
  • Your report is an impressive, excellent tool and I have recommmended it to friends.

    Colin E., Subscriber

  • I find your website and research very helpful in my stock trading. I have subscribed to several related services in the past and none present their work with “just the facts” as you. Please keep up the great work so that I can continue to learn! 

    Bryan E., Subscriber

Subscription Plans

Subscription Plans

STWR - Monthly

$19.95

Monthly subscription plan to Stock Trends Weekly Reporter - pay your monthly subscription fees by having them automatically charged (PayPal only). Free 7-day trial period. Subscribers may cancel before the end of any subscription month.

STWR - 1 Year Prepaid Subscription

$199.00

1 Year Prepaid subscription to Stock Trends Weekly Reporter. Save 16% off monthly rate!

STWR - 2 Year Prepaid Subscription

$299.00

2 Year Prepaid subscription to Stock Trends Weekly Reporter. Save 37% off monthly rate!

STWR - 3 Year Prepaid Subscription

$399.00

3 Year Prepaid subscription to Stock Trends Weekly Reporter. Save 44% off monthly rate!

Stock Trends Editorial

  • Leadership Beneath the Surface: How Stock Trends Identifies System-Critical Equities
    Leadership Beneath the Surface: How Stock Trends Identifies System-Critical Equities The broad market still reads as a rotation market rather than a generalized expansion phase. Energy, Materials, and Utilities remain the clearest sector-level leadership blocs, but the current Stock Trends dataset shows that a second layer of leadership is now becoming more visible beneath the sector averages. That secondary leadership is important because it does not present itself as broad participation. It appears instead through specific industry groups whose internal trend structure is materially stronger than that of their parent sectors. In this week’s data, the clearest examples are Semiconductors and Equipment, Telecommunications, Containers & Packaging, and Banking.
    29 March 2026 Read more...
  • Indexing Is the Baseline—Probability Is the Edge
    Indexing Is the Baseline—Probability Is the Edge The case for indexing continues to strengthen, and rightly so. The evidence is overwhelming: most active managers fail to outperform their benchmarks over time, and the costs of attempting to do so only compound the underperformance. For many investors, indexing has become not just a strategy, but the default solution. But the conclusion that often follows—that markets cannot be meaningfully outperformed—is where the interpretation begins to break down. The failure of traditional active management is not evidence that opportunity does not exist. It is evidence that non-probabilistic selection fails.
    24 March 2026 Read more...
  • Continuation, Not Expansion: What the Probability Structure Now Reveals
    Continuation, Not Expansion: What the Probability Structure Now Reveals The current market is not offering investors the kind of broad speculative expansion that often defines the early phase of a powerful advance. Nor is it confirming a simple risk-off breakdown. The latest Stock Trends dataset points to something more disciplined. The probability structure remains constructive, but it is now being expressed primarily through continuation and consolidation rather than broad breakout expansion.
    21 March 2026 Read more...
  • When Headlines Darken but the Probability Structure Holds
    When Headlines Darken but the Probability Structure Holds The recent Stock Trends editorials argued that hard assets had become structural leaders and that capital was rotating across themes rather than collapsing into a simple risk-on or risk-off binary. This week’s data adds a new layer. The market’s probability structure has improved even as the macro headlines have become more hostile. That is a distinct signal, and it is coming directly from the Stock Trends Inference Model.
    14 March 2026 Read more...
View all Stock Trends Editorials


Subscription Plans

STWR - Monthly

$19.95/Month

Monthly subscription plan to Stock Trends Weekly Reporter - pay your monthly subscription fees by having them automatically charged (PayPal only). Free 7-day trial period. Subscribers may cancel before the end of any subscription month.

STWR - 1 Year Prepaid Subscription

$199/Year

1 Year Prepaid subscription to Stock Trends Weekly Reporter. Save 16% off monthly rate!

STWR - 2 Year Prepaid Subscription

$299/2 Years

2 Year Prepaid subscription to Stock Trends Weekly Reporter. Save 37% off monthly rate!

STWR - 3 Year Prepaid Subscription

$399/3 Years

3 Year Prepaid subscription to Stock Trends Weekly Reporter. Save 44% off monthly rate!