Introducing the 'Map of Stock Trends'

  • 13 April 2015 |
  • Written by  Skot Kortje, Stock Trends Analyst
  • font size
  • Print

The Map of Stock Trends is a treemap that points investors toward large cap stocks the Stock Trends analysis favours. Investors get a unique and powerful look at the North American stock market.

The Stock Trends Inference Model is a quantitative approach to interpreting the categorical data that is the core value-added analysis presented here. The Stock Trends indicators are derived from base tenets of the market technician’s encyclopedia - a toolset designed to reduce a complex market dynamic to a categorical, and hierarchical framework. By evaluating the statistical significance of this framework we can apply meaningful algorithmic trading methods.


However, the first step is to understand the data and interpret the Stock Trends Inference Model results. Every week we sample 30-years of data to assign a probability for future returns on over 7,000 North American stocks. Using combinations of categorical data and making assumptions about the distribution of returns, we apply statistical inference methods to differentiate stocks (ETFs and income trusts, too) by the estimated returns in the coming periods (4-weeks, 13-weeks, and 40-weeks). You can see the result of that analysis in the Profile section of each Stock Trends Report.


I’ve already introduced the Stock Trends Inference Model in previous editorials. Subscribers to Stock Trends Weekly Reporter can interpret this information weekly, as well as review the reports on issues with the best expected returns. The Stock Trends ‘Select’ report, as well as the Top 4-wk/13-wk/40-wk returns expectations reports give users a new way to make the Stock Trends reports actionable.


However, these reports can be augmented by data visualizations. Graphical presentations of data are always useful in translating vast data points into more accessible interpretations. A good graph saves us time and points us in the right direction.


The Stock Trends Profile reports include heatmaps which help us compare returns expectations among industry group member stocks. Another useful display method for this data, especially when we want to broaden the use of the data hierarchy, is a treemap. A treemap is specifically designed for hierarchical data and is commonly used. A popular example in our equity analysis space is the Map of the Market.


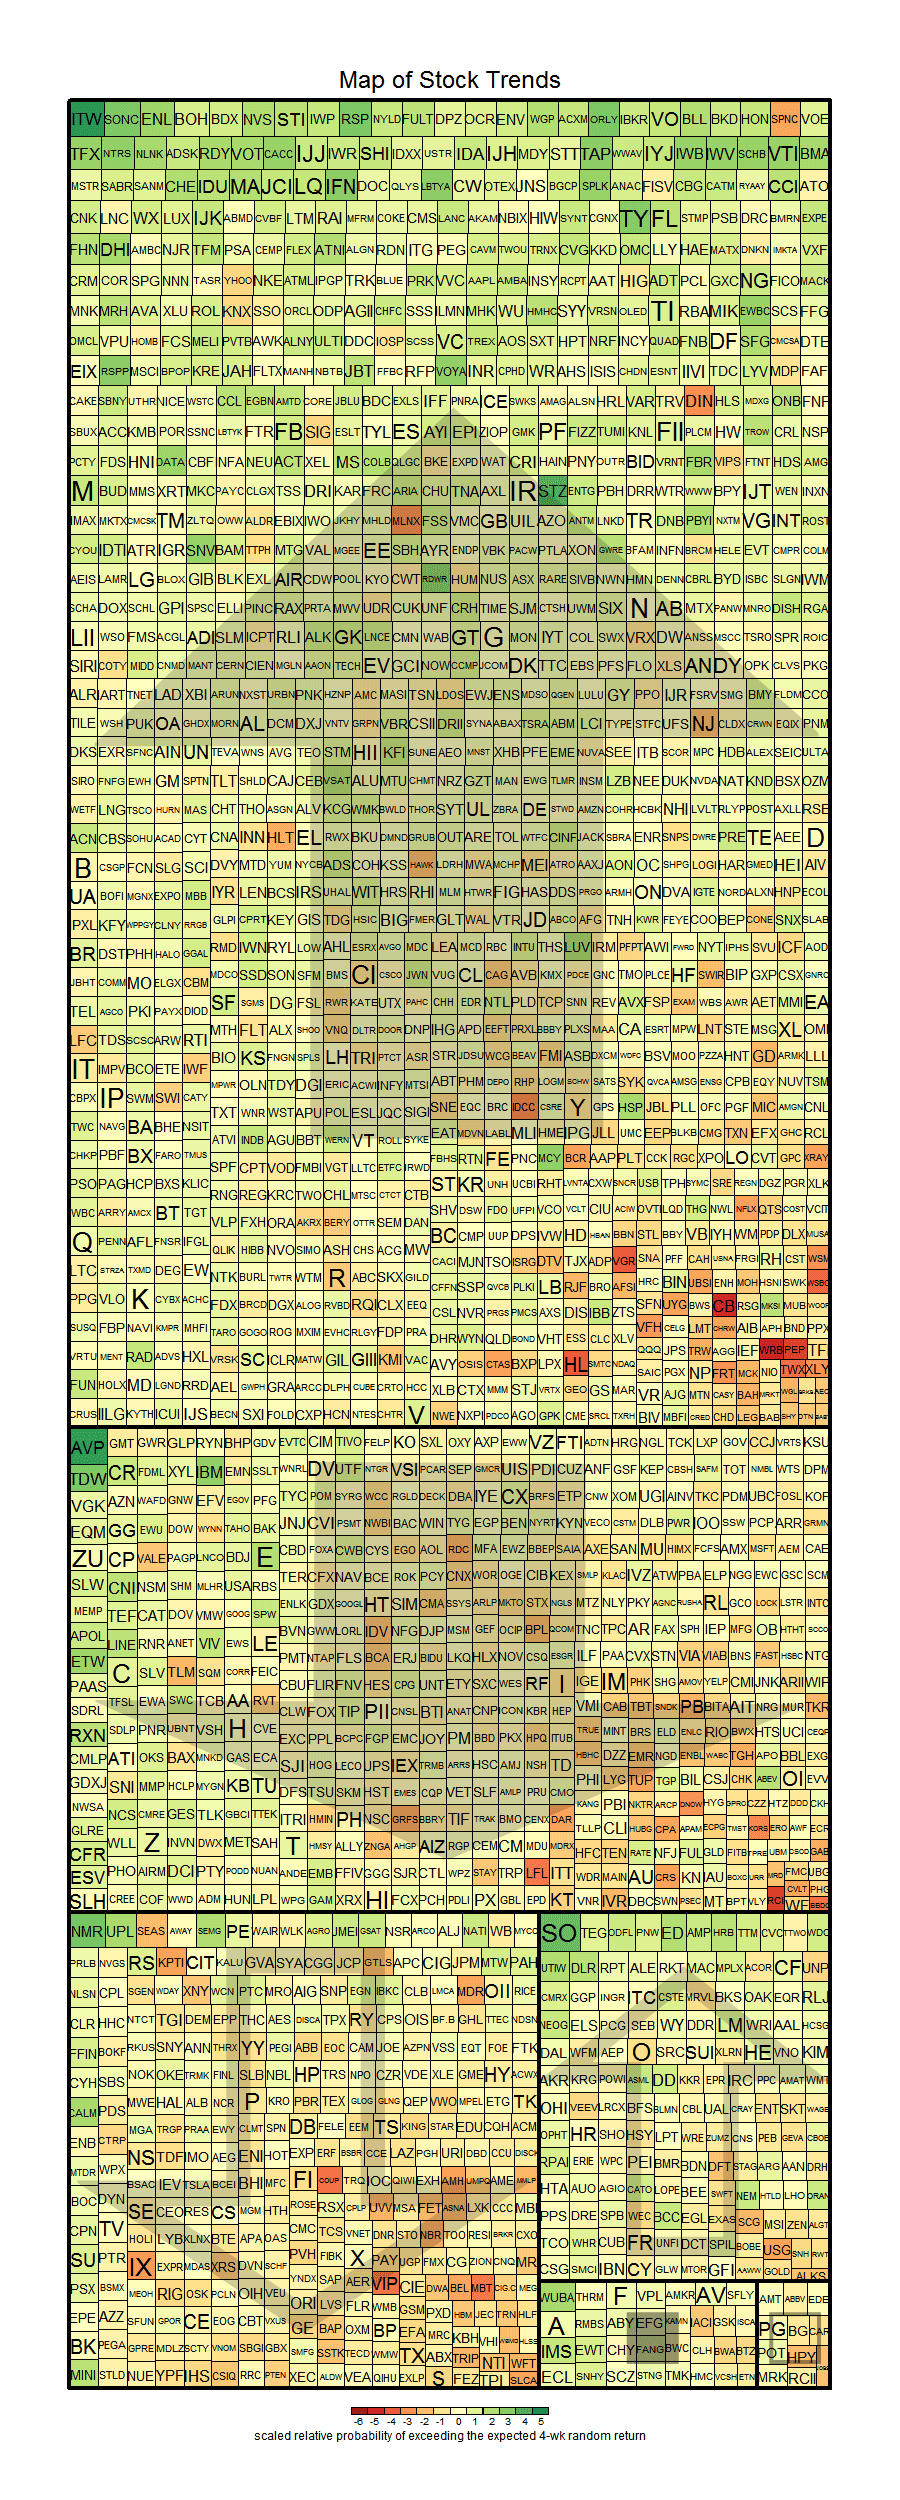
Today I am introducing a treemap of the Stock Trends Inference Model - the Map of Stock Trends. It takes the data results from the weekly analysis, sorting 4-week and 13-week returns expectations by trend category.


In the treemaps displayed below large capitalization stocks (U.S. stocks with a market cap greater than $1-billion, Canadian stocks with market cap greater than $500-million) are grouped by Stock Trends indicator (Bullish , Weak Bullish , Bearish , Weak Bearish , Bullish Crossover , Bearish Crossover ). Each stock within these groups is visually differentiated in two ways: spatially by their relative probability of a return greater than the base 13-week mean random return (2.19%) , with larger cells (higher probabilities) sorted and displayed from the upper left quadrant and moving down to the lower right corner for the lower value. Secondly, the 4-week returns expectations are differentiated visually by color gradation, with darker green hues representing stocks with higher probabilities of exceeding the base average 4-week random return (0%) and darker red hues representing the stocks with the poorest probabiltity of a positive return in 4-weeks.
 
 
Dark green cells in the upper left of each trend category are stocks with the best statistical trend characteristics. Dark red cells in the lower right quadrant of each trend category are stocks with the worst statistical trend characteristics.


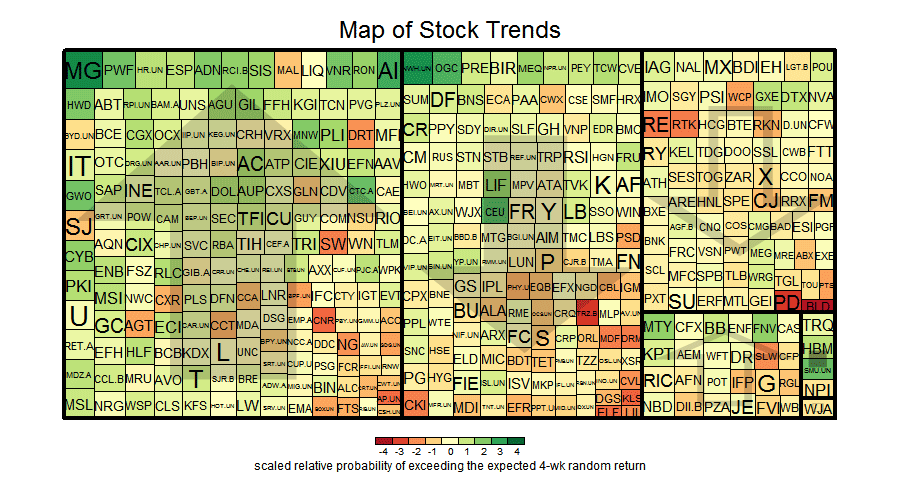
Below are the current Map of Stock Trends treemaps for the U.S. and Canadian stock markets. Each Stock Trends trend indicator category grouping is identified by the translucent indicators in the background of each box. In the future the treemap will be developed in an application that allows users to click on an individual cell and go directly to individual Stock Trends Reports, but for now the visualizations help direct us to the stocks with the most favourable current Stock Trends Reports.


U.S. stock exchanges - big cap stocks

Map of Stock Trends


Toronto Stock Exchange - big cap stocks

Map of Stock Trends

back to top

Subscriber Testimonials

  • Thank you for your excellent work and kind approach to your customers.

    Odette C., Subscriber

  • Your report is an impressive, excellent tool and I have recommmended it to friends.

    Colin E., Subscriber

  • Stock Trends analysis quantifies nicely the movement of individual stocks. I’ve found that if the technicals are out of synch with fundamental analysis, it is a wake-up call to make a decision. The Stock Trends Bull/Bear Ratio is useful in identifying major market bottoms and tops. It has always presented a good buying or selling opportunity.

    Charles G., Subscriber
  • Stock Trends information is part of the base information I review before making a trade.

    Subscriber
  • There is a lot to be gained from comparing trends of how individual stocks are doing within a sector, as well as how the sector is performing relative to the broad market.

    Dudley R., Subscriber

  • I have had the good fortune to be reasonably successful and enjoy the investment process. Your process would be recommended for both experts and those who are new to investing.

    Frank I., Subscriber
  • I very much like the systematic approach to analyzing stock data, it fits my approach.

    Subscriber
  • I use Stock Trends to help direct my stock picks. Also, following the advice of Stock Trends I have religiously used stop-loss orders and have avoided hanging on to losing stocks for emotional reasons.

    John B., Subscriber
  • I've followed your recommendations since reading your columns in the Globe & Mail, and finding they published Stock Trends arrows in their financial listings. I do find them a guide to the general market and what I should be avoiding for declining chart trends.
    Has probably saved me the subscription by not rushing into hot stocks!

    Anthony D., Subscriber
  • I am something of a momentum investor. I find Stock Trends useful as I can look at my portfolio as a “watch list” and quickly see where trends are declining in strength or reversing, so it is particularly useful as a tool in portfolio management regarding sales.

    William C., Subscriber
  • I find your website and research very helpful in my stock trading. I have subscribed to several related services in the past and none present their work with “just the facts” as you. Please keep up the great work so that I can continue to learn! 

    Bryan E., Subscriber
  • Stock Trends Weekly Reporter is an easy way to pick up equities that represent an upward trend.

    Subscriber
  • An admitted cynic, it's obviously very high praise when he says he likes StockTrends because of its "simplicity, utility, openness, [and] honesty," and in addition to having "no hidden agenda" is "understandably documented [and] historically verifiable." And, he adds, "It lets me see a lot of things without doing a lot of work." Globe and Mail

    Paul W., Subscriber

  • Just thought I'd call to thank you, Skot. Stock Trends Weekly Reporter helped pay for my daughter's education!

    Peter H., Subscriber

  • I am fascinated with your service and methodology - it is very impressive. [...] Over the years I have concluded that there are many ways to approach stock investing, but once one has chosen a path, one is better off sticking to it.

    Bob E., Subscriber

  • I am just writing to tell you of my appreciation of your service! It makes so much sense to me. You seem to be an oasis of stability and sensibility in a stockmarket jungle.

    Adrian S., Subscriber

  • Hence, anyone who had followed the "Stock Trends" line should have sold their Bre-X shares and, with the windfall, paid for a lifetime subscription to The Globe and Mail and more. Talk about return on investment!

    Muni P., Subscriber

  • I've followed a number of Stock Trends picks, and the methodology is solid.

    Doug B., Subscriber

  • I want to thank you for posting such an excellent guide to technical analysis on the web. You have provided a great service to all of us novice investors.

    Michael C., Stock Trends user
  • You have created and maintained an amazing, highly educational program and I am grateful for your part in getting our retirement funds to the good place they are.

    Karin M., Subscriber

Subscription Plans

Subscription Plans

STWR - Monthly

$19.95

Monthly subscription plan to Stock Trends Weekly Reporter - pay your monthly subscription fees by having them automatically charged (PayPal only). Free 7-day trial period. Subscribers may cancel before the end of any subscription month.

STWR - 1 Year Prepaid Subscription

$199.00

1 Year Prepaid subscription to Stock Trends Weekly Reporter. Save 16% off monthly rate!

STWR - 2 Year Prepaid Subscription

$299.00

2 Year Prepaid subscription to Stock Trends Weekly Reporter. Save 37% off monthly rate!

STWR - 3 Year Prepaid Subscription

$399.00

3 Year Prepaid subscription to Stock Trends Weekly Reporter. Save 44% off monthly rate!

Stock Trends Editorial

  • TJX at New Highs — A Case Study in Long-Run Trend Persistence and Momentum Rotation
    TJX at New Highs — A Case Study in Long-Run Trend Persistence and Momentum Rotation In the current Stock Trends data, almost 700 stocks are pressing to new 52-week highs despite late-year volatility in the broader equity benchmarks. Among these leaders, TJX Companies (TJX-N) continues to stand out not merely for its price strength today, but for its extraordinary multi-year trend persistence within the Stock Trends framework.
    Read more...
  • Two Decades of Trend Leadership, Risk Discipline, and Systematic Advantage
    Two Decades of Trend Leadership, Risk Discipline, and Systematic Advantage The investment world took notice this week as Berkshire Hathaway revealed a significant new equity position in Alphabet (GOOGL-Q). For a firm renowned for its deliberate, valuation-anchored decision-making, the entry into one of the world’s most dominant technology franchises carries weight. Yet for Stock Trends users, Berkshire’s move is not a surprise so much as a confirmation of a trend that the Stock Trends framework…
    Read more...
  • Market Regimes at an Inflection Point: What Stock Trends Indicators Reveal About the Current Market Climate
    Market Regimes at an Inflection Point: What Stock Trends Indicators Reveal About the Current Market Climate The latest weekly distribution of Stock Trends indicators points to an important shift in the underlying market regime for both U.S. and Canadian equities. A close examination of the composite trend structure—Bullish and Bearish proportions, crossovers, momentum breadth, and trend age—suggests that the market environment is undergoing meaningful transformation. By relating these observations to the developing Stock Trends ML Causal AI epoch framework, we gain…
    Read more...
  • Stock Trends Portfolio Strategies: A Data-Driven Review of Long-Term Performance
    Stock Trends Portfolio Strategies: A Data-Driven Review of Long-Term Performance Stock Trends model portfolios translate the core principles of the Stock Trends Handbook into systematic investment strategies. Each portfolio is built on the same foundation: objective price trend classifications, moving average crossover behaviour, volume indicators, and relative strength measures. These models apply the Stock Trends indicators consistently across decades, allowing investors to see how disciplined, rules-based trend following performs through complete market cycles.
    Read more...
View all Stock Trends Editorials


Subscription Plans

STWR - Monthly

$19.95/Month

Monthly subscription plan to Stock Trends Weekly Reporter - pay your monthly subscription fees by having them automatically charged (PayPal only). Free 7-day trial period. Subscribers may cancel before the end of any subscription month.

STWR - 1 Year Prepaid Subscription

$199/Year

1 Year Prepaid subscription to Stock Trends Weekly Reporter. Save 16% off monthly rate!

STWR - 2 Year Prepaid Subscription

$299/2 Years

2 Year Prepaid subscription to Stock Trends Weekly Reporter. Save 37% off monthly rate!

STWR - 3 Year Prepaid Subscription

$399/3 Years

3 Year Prepaid subscription to Stock Trends Weekly Reporter. Save 44% off monthly rate!