Return expectations for Twitter $TWTR #notgood

  • 03 May 2015 |
  • Written by  Skot Kortje, Stock Trends Analyst
  • font size
  • Print

The Stock Trends Inference Model analysis of Twitter (TWTR) presents a discouraging intermediate-term outlook.

There’s a new social media button: UnLike. Twitter’s stock (TWTR) might be the first click. It’s tumble last week erased much of the first quarter goodwill the market had buffed up, closing at $37.84 on Friday and leaving behind the previous $50 support level in splinters. With any market response of this profile there are hails of panic, as well as resolve. Does an investor see this correction as the beginning of an even nastier fall or an opportunity to take advantage of nervous Nellies?


Technical analysis is, by definition, the study of price and trading activity. It seeks to answer the basic question posed in any market - Do I buy, or do I sell? - by interpreting past market action and prognosticating about future market action. Sometimes the market characteristics of a particular stock (or any trading instrument) are not that distinguishable or distinguishing. And then there are stocks with market activity that is much more categorically defined. Hello, Twitter!


Stock Trends allows us to isolate market characteristics - and especially so when there is a selloff. The 25.5% drop of TWTR last week flushed out many investors, and the usually high volume of trading indicator tells us the scope of this sentiment change is substantial. When we see a change to a Stock Trends Weak Bullish indicator () on this kind of price and volume move the technical aspects of the stock are quite distinguishable.


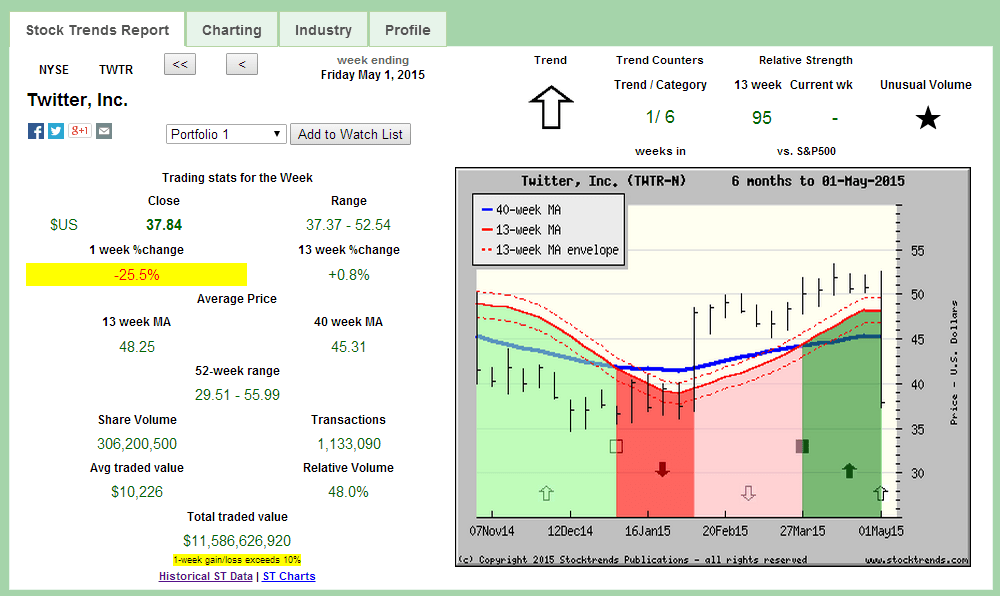
TWTR’s Stock Trends Report shows a combination of indicators that make this event categorically interesting: the trend indicator is Weak Bullish (), with a minor trend counter of 1, and a major trend counter now at 6, an RSI of 95 - , and an unusually high volume indicator (). The market characteristic described by this Stock Trends indicator combination is of a stock that is relatively early in a Bullish trend but has tripped rather suddenly on significant bad market news. While the drop in price was substantial last week, TWTR is still only underperforming the S&P 500 by 5% measured over the past 13-weeks.


The Stock Trends Inference Model (ST-IM) analysis is designed to make a statistical evaluation of market conditions - especially those market conditions that are most clearly defined. The Stock Trends Report on TWTR is now a good example. What does the ST-IM analysis say now about this stock’s future price expectations? Remember that the ST-IM analysis samples 30-years of Stock Trends data looking for stocks with similar indicator combinations, measuring post-observation statistics of 4-week, 13-week, and 40-week returns. From the samples we infer population parameters of these returns and estimate the probability of the current stock (here TWTR) bettering the estimated future returns of a randomly selected stock.


Here is the current ST-IM analysis of TWTR:
 
STIM - returns expectations for Twitter TWTR


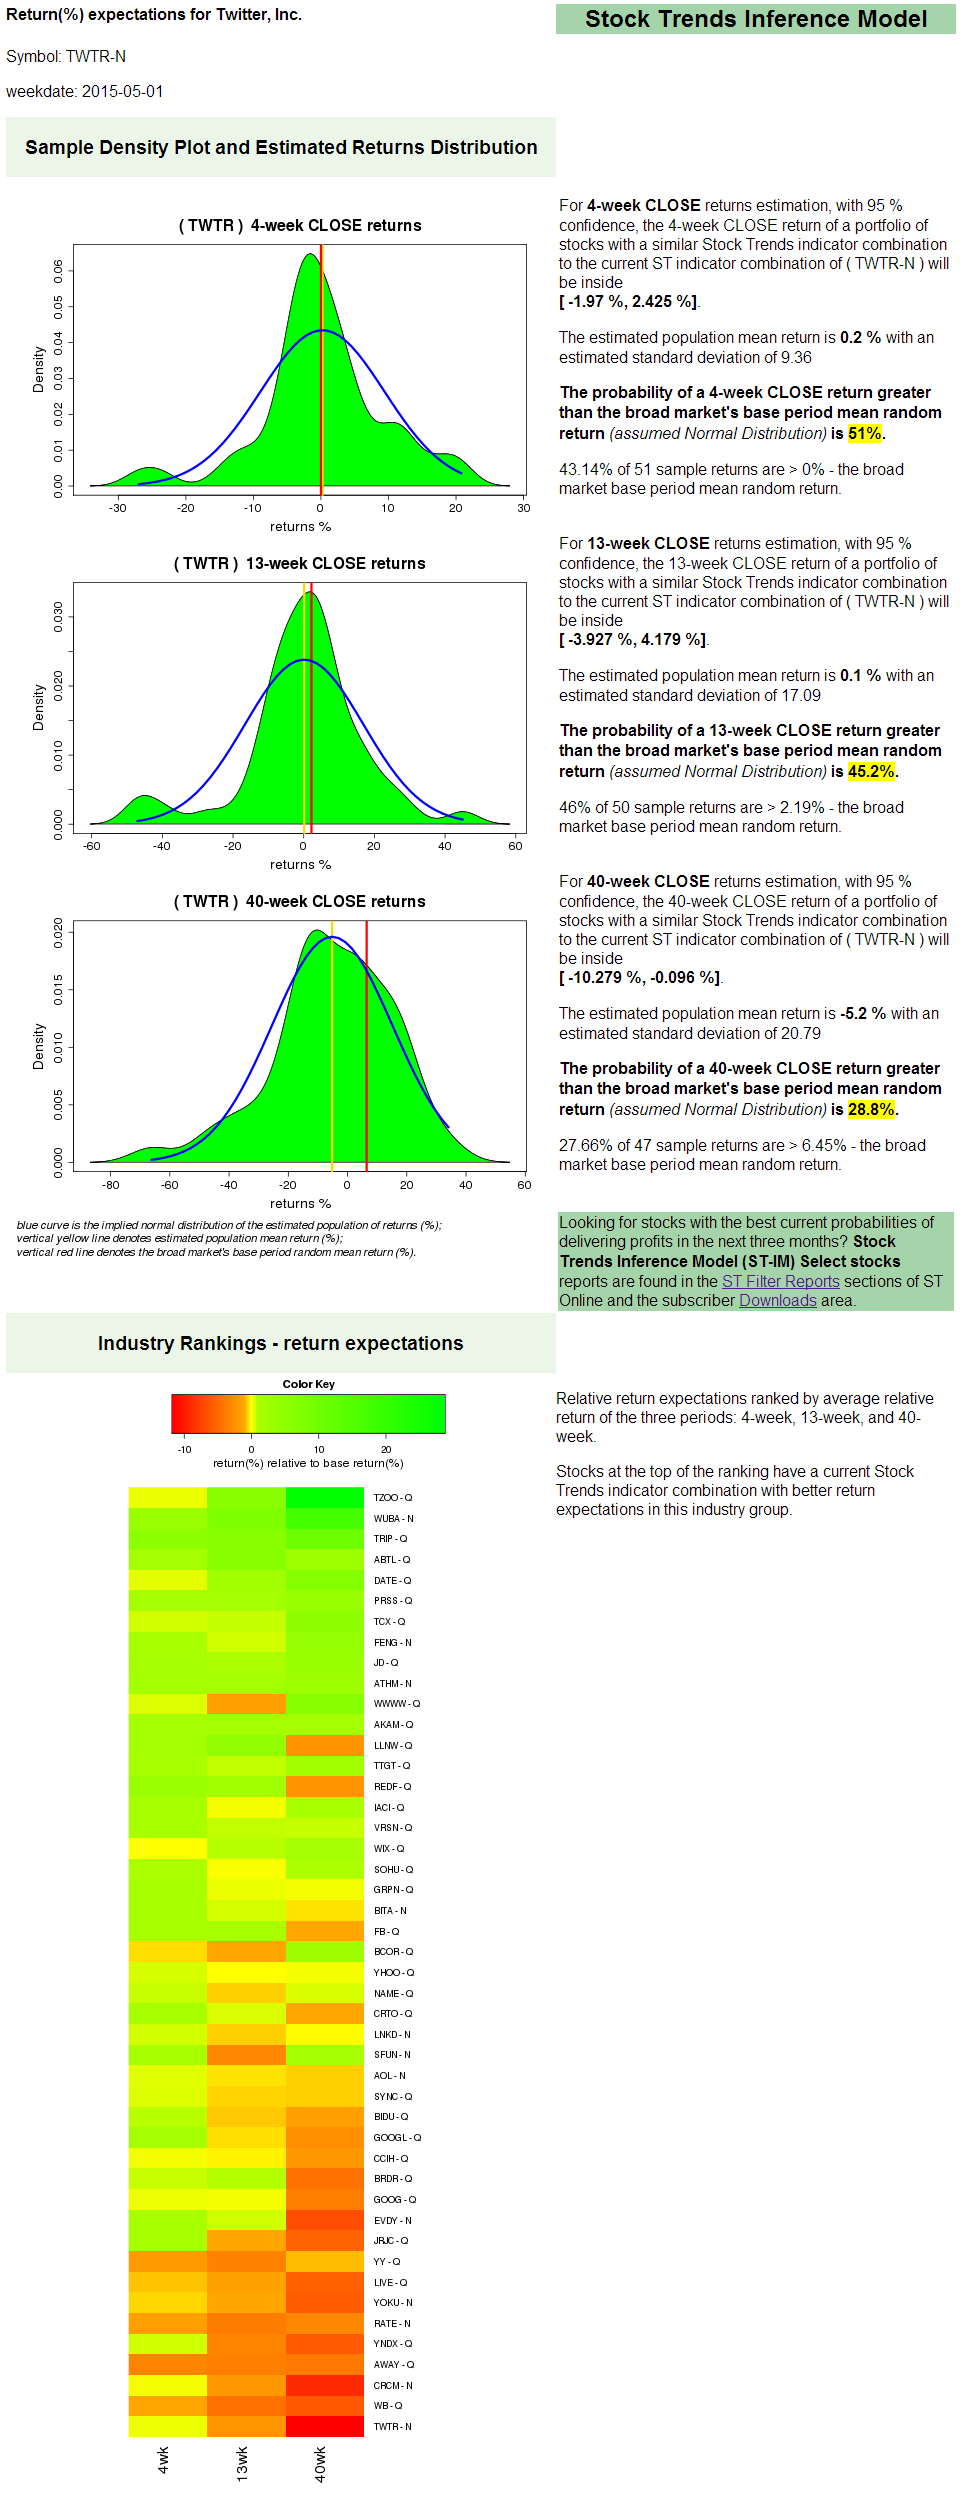
What does this analysis tell us? First, we see that the short-term price expectations are relatively neutral, with the mean return expectations near the expected return of a randomly selected stock (0%). There is a 51% probability that the 4-week return of TWTR will be positive (greater than 0%, the expected return of a broad market randomly selected stock). Not much better than the 50% probability that you would see a positive 4-week return in a randomly selected stock.
 
However, the 13-week and 40-week expected returns of TWTR are much more concerning. The probability of TWTR having a 13-week return better than the expected 13-week return of a randomly selected stock (2.19%) is only 45.2%. Looking further out on the time horizon is even more bleak. The probability of TWTR having a 40-week return greater than the expected 40-week return of a randomly selected stock (6.45%) is just 28.8%. Remember, a randomly selected stock has a 50% probability of having a 40-week return greater than 6.45%.


The ST-IM analysis tell us that TWTR, as defined by the current Stock Trends indicator combination, has a significantly low probability of delivering positive returns over the intermediate time periods ahead.


back to top

Subscriber Testimonials

  • Stock Trends analysis quantifies nicely the movement of individual stocks. I’ve found that if the technicals are out of synch with fundamental analysis, it is a wake-up call to make a decision. The Stock Trends Bull/Bear Ratio is useful in identifying major market bottoms and tops. It has always presented a good buying or selling opportunity.

    Charles G., Subscriber
  • I use Stock Trends to help direct my stock picks. Also, following the advice of Stock Trends I have religiously used stop-loss orders and have avoided hanging on to losing stocks for emotional reasons.

    John B., Subscriber
  • Thank you for your excellent work and kind approach to your customers.

    Odette C., Subscriber

  • There is a lot to be gained from comparing trends of how individual stocks are doing within a sector, as well as how the sector is performing relative to the broad market.

    Dudley R., Subscriber

  • Stock Trends information is part of the base information I review before making a trade.

    Subscriber
  • Just thought I'd call to thank you, Skot. Stock Trends Weekly Reporter helped pay for my daughter's education!

    Peter H., Subscriber

  • I find your website and research very helpful in my stock trading. I have subscribed to several related services in the past and none present their work with “just the facts” as you. Please keep up the great work so that I can continue to learn! 

    Bryan E., Subscriber
  • Your report is an impressive, excellent tool and I have recommmended it to friends.

    Colin E., Subscriber

  • Stock Trends Weekly Reporter is an easy way to pick up equities that represent an upward trend.

    Subscriber
  • I have had the good fortune to be reasonably successful and enjoy the investment process. Your process would be recommended for both experts and those who are new to investing.

    Frank I., Subscriber
  • You have created and maintained an amazing, highly educational program and I am grateful for your part in getting our retirement funds to the good place they are.

    Karin M., Subscriber
  • I am something of a momentum investor. I find Stock Trends useful as I can look at my portfolio as a “watch list” and quickly see where trends are declining in strength or reversing, so it is particularly useful as a tool in portfolio management regarding sales.

    William C., Subscriber
  • I am just writing to tell you of my appreciation of your service! It makes so much sense to me. You seem to be an oasis of stability and sensibility in a stockmarket jungle.

    Adrian S., Subscriber

  • An admitted cynic, it's obviously very high praise when he says he likes StockTrends because of its "simplicity, utility, openness, [and] honesty," and in addition to having "no hidden agenda" is "understandably documented [and] historically verifiable." And, he adds, "It lets me see a lot of things without doing a lot of work." Globe and Mail

    Paul W., Subscriber

  • I've followed your recommendations since reading your columns in the Globe & Mail, and finding they published Stock Trends arrows in their financial listings. I do find them a guide to the general market and what I should be avoiding for declining chart trends.
    Has probably saved me the subscription by not rushing into hot stocks!

    Anthony D., Subscriber
  • I've followed a number of Stock Trends picks, and the methodology is solid.

    Doug B., Subscriber

  • I very much like the systematic approach to analyzing stock data, it fits my approach.

    Subscriber
  • I am fascinated with your service and methodology - it is very impressive. [...] Over the years I have concluded that there are many ways to approach stock investing, but once one has chosen a path, one is better off sticking to it.

    Bob E., Subscriber

  • Hence, anyone who had followed the "Stock Trends" line should have sold their Bre-X shares and, with the windfall, paid for a lifetime subscription to The Globe and Mail and more. Talk about return on investment!

    Muni P., Subscriber

  • I want to thank you for posting such an excellent guide to technical analysis on the web. You have provided a great service to all of us novice investors.

    Michael C., Stock Trends user

Subscription Plans

Subscription Plans

STWR - Monthly

$19.95

Monthly subscription plan to Stock Trends Weekly Reporter - pay your monthly subscription fees by having them automatically charged (PayPal only). Free 7-day trial period. Subscribers may cancel before the end of any subscription month.

STWR - 1 Year Prepaid Subscription

$199.00

1 Year Prepaid subscription to Stock Trends Weekly Reporter. Save 16% off monthly rate!

STWR - 2 Year Prepaid Subscription

$299.00

2 Year Prepaid subscription to Stock Trends Weekly Reporter. Save 37% off monthly rate!

STWR - 3 Year Prepaid Subscription

$399.00

3 Year Prepaid subscription to Stock Trends Weekly Reporter. Save 44% off monthly rate!

Stock Trends Editorial

  • High-Volume Leaders: A Closer Look at the Heaviest-Traded Stocks
    High-Volume Leaders: A Closer Look at the Heaviest-Traded Stocks Stock Trends’ Unusually High Volume () indicator flags stocks whose weekly trading volume is at least 200% of their 13-week average. In the October 31 weekly reports, only a small slice of the universe qualifies—making these signals rare and valuable. When high volume coincides with a bullish trend state (or a new Bullish Crossover), it can mark institutional footprints at the start of a multi-week advance.
    Read more...
  • Positioning for Opportunity: Trade Detente and Stock Trends Momentum
    Positioning for Opportunity: Trade Detente and Stock Trends Momentum The easing of tensions between the world’s two largest economies has given markets a fresh narrative. By stepping back from new export restrictions and cutting key tariffs, the United States and China have removed some of the most disruptive threats hanging over global supply chains. For investors, this détente creates a backdrop of relative stability in which powerful price trends can resume and new trend…
    Read more...
  • From Flash Crash to Rotation: The Probability–Payoff Map of a Rebuilding Market
    From Flash Crash to Rotation: The Probability–Payoff Map of a Rebuilding Market The market’s October tremor—an abrupt but short-lived flash crash—has given way to a familiar pattern in the Stock Trends framework: the rapid repair of breadth and the birth of new trends. Where panic once pressed prices indiscriminately, order is returning through a disciplined sequence of new bullish signals, rebuilding sectors, and the subtle reorganization of leadership beneath the surface.
    Read more...
  • Random Portfolios as a Benchmark: A Smarter Yardstick for Performance
    Random Portfolios as a Benchmark: A Smarter Yardstick for Performance Investors often compare performance to market indexes like the S&P 500, but traditional benchmarks have built-in biases. The S&P 500, for example, is heavily skewed toward large-cap stocks and “is not a good benchmark for measuring alpha” – it reflects a size-factor bias rather than pure manager skill. All major indexes systematically tilt toward certain factors (size, sector, value/growth, etc.), meaning they’re not truly passive…
    Read more...
View all Stock Trends Editorials


Subscription Plans

STWR - Monthly

$19.95/Month

Monthly subscription plan to Stock Trends Weekly Reporter - pay your monthly subscription fees by having them automatically charged (PayPal only). Free 7-day trial period. Subscribers may cancel before the end of any subscription month.

STWR - 1 Year Prepaid Subscription

$199/Year

1 Year Prepaid subscription to Stock Trends Weekly Reporter. Save 16% off monthly rate!

STWR - 2 Year Prepaid Subscription

$299/2 Years

2 Year Prepaid subscription to Stock Trends Weekly Reporter. Save 37% off monthly rate!

STWR - 3 Year Prepaid Subscription

$399/3 Years

3 Year Prepaid subscription to Stock Trends Weekly Reporter. Save 44% off monthly rate!