The random outcome benchmark

  • 11 February 2014 |
  • Written by  Skot Kortje, Stock Trends Analyst
  • font size
  • Print

The Stock Trends inference model’s random benchmark looks at all returns possible. Universal returns are market agnostic – they are not framed by the boundaries of the moment. That is true randomness. We do not know what to expect. Anything is possible.

Behind all of the statistical modeling Stock Trends is gradually unveiling there is an attempt to break down the weekly data reports into probability distributions that give the trader an estimate of the odds of success. Success is measured in terms of relative performance against the expected returns of a randomly selected stock. This benchmark needs elaboration.

The Stock Trends inference model defines the randomness of the market in a universal way - returns are not time specific. That means that we are referring to outcomes across all time frames, all markets, and all events. We are referring to a true population of returns.
 
This differs from the subjectively influenced range of outcomes that we see at any moment in time. For instance, at this moment in time the market might appear to present a certain bullish trend and typical analysis approaches build in expectations of price movement associated with aspects of the analysis (chart patterns, fundamental ratios, etc.). Those subjective evaluations of potential outcomes (whether the analysis reveals a highly bullish or highly bearish scenario) generally present only a subset of universal returns. These potential outcomes are rooted in expectations of the moment.
 
The Stock Trends inference model's random benchmark looks at all returns possible. Those returns are derived from every market type, including markets of ‘irrational exuberance’ as well as the gravest financial meltdown. Universal returns are market agnostic – they are not framed by the boundaries of the moment. That is true randomness. We do not know what to expect. Anything is possible.
 
When we look at large samples random returns match the long-term market expectations – basically 8 percent annually. Actually, the expected mean annual return of a randomly selected stock, across time, is about 8.6%. Taking period returns of approximately 500,000 random stocks from the Stock Trends 30-year weekly data, the estimated population parameters for the following periods are derived:
 
4-week mean return: -0.05%, standard deviation: 33.15
13-week mean return: 2.19%, standard deviation: 44.11
40-week mean return:  6.45%, standard deviation: 76.81
      
Obviously, the dispersion of results is quite wide. A random trade is as likely to be a double bagger as a money pit. Even more moderate ‘aggressive’ trading expectations are constrained by the same rules of the assumed normal distribution. Looking at the 40-week period for example, a random trade has a 48.1% chance of a return greater than 10%, but also has a 41.5% chance of a return less than -10%.
 
Assuming a normal distribution of returns for the population, we should be reminded that a binary implication of this is humbling for the trader. A trader’s odds of beating the mean return for any period are 1:2, or 50%. This is the situation most investors are in – they are at risk of entering the market at the worst of times or best of times depending on their investment life cycle, but will average out toward these mean values as we sample more and more trades over generations or multiple market cycles.
 
Most traders probably don’t think this way. Typically, they expect to be right and are trading because they believe they can do better than the market or that they are entering the market at an opportune time. After all, why trade if you can’t do better than an index fund or, alternatively, by not exposing to equity risk at all?
 
The Stock Trends inference model looks at trading as a kind of binary random outcome – heads to beat the market expected return, tails to do worse. Anyone who has experience in flipping coins knows that even a ‘fair’ coin can deliver an outcome – even lengthy series of outcomes - that seemingly defies the probabilities. A fair coin can deliver 10 consecutive heads (or tails) in the first 10 flips, for instance, 0.0977% of the time. More relevantly, over the span of 50 flips the probability of 10 consecutive heads (or tails) is 2% - certainly not impossible. This is known as a ‘run’, and every active trader has experience with both winning runs and losing runs. Every trading system will produce them.
 
Let’s look at our own Stock Trends trading systems. This is a distribution of loss runs of the Stock Trends NYSE Portfolio #1 trading record:
 
 
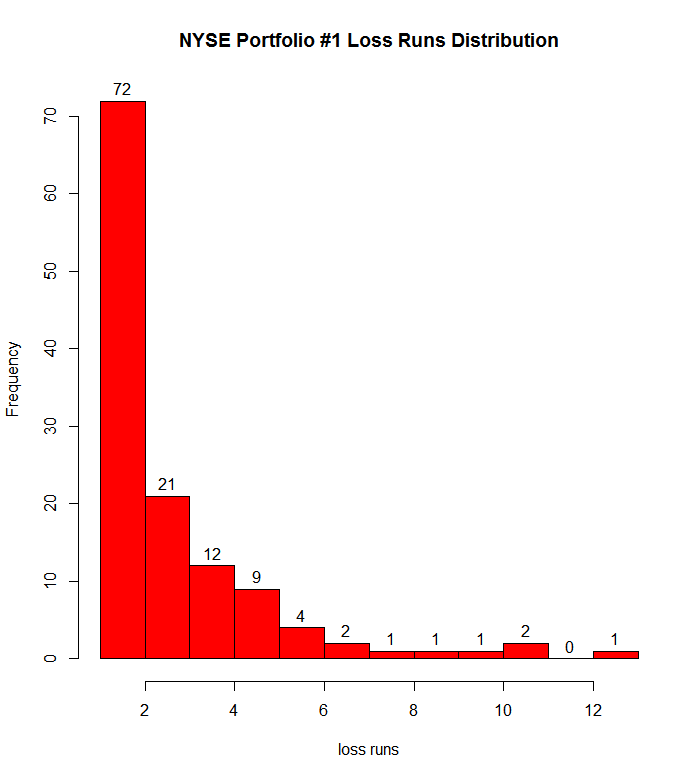
In this trading record of 583 trades there are 4 loss runs of 10 or more (maximum loss run is 13). That would be our string of ‘tails’ on the flip of the coin. In the real world of trading that is also called a drawdown. It’s an ugly thing; and a painful one. But we can see how loss runs factor into every trading system - every active trader must try to limit them.
 
Limiting the extent of losses is the primary function of a money management system. Stock Trends model portfolio trading systems have a few elements of loss protection that are inherent. First, they use a method of position sizing. All trades are made with a specific dollar value. This is a topic of discussion on its own, and I have written about it in previous editorials, comparing fixed dollar trades against variable or random amounts. Another aspect of loss protection is in the exit strategies – the stop loss triggers and the indicator triggers. However, over-all trading results will markedly improve if loss runs can be minimized. That means improving your success ratio: the win/loss ratio.
 
The Stock Trends inference model is a quantitative method to improve an investor’s trade expectations in a world of randomness. We look for Stock Trends indicator combinations that represent our best chance of being on the right side of a coin toss.
 
Here is a heatmap showing the current top ranked stocks of the S&P 100 index according to the Stock Trends inference model:
 
 
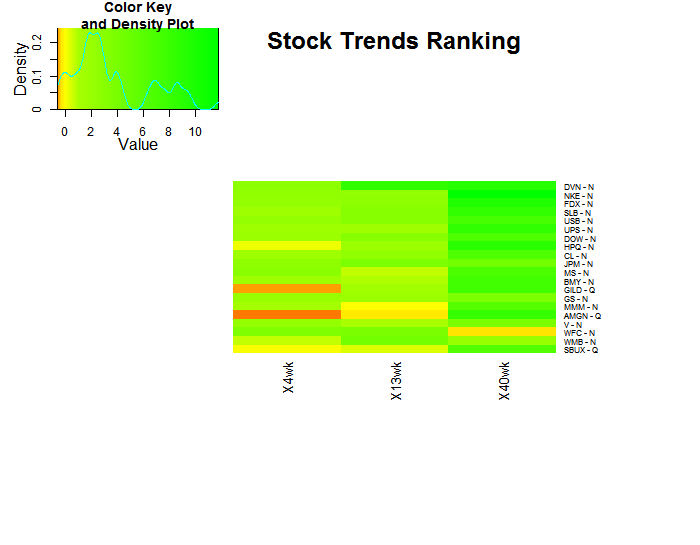
see Stock Trends editorial, Ranking expectations for an explanation of the ranking.
 
Devon Energy (DVN-N), Nike (NKE-N), and Fedex (FDX-N) top the list of these big cap stocks.
back to top

Subscriber Testimonials

  • Thank you for your excellent work and kind approach to your customers.

    Odette C., Subscriber

  • I very much like the systematic approach to analyzing stock data, it fits my approach.

    Subscriber
  • I am just writing to tell you of my appreciation of your service! It makes so much sense to me. You seem to be an oasis of stability and sensibility in a stockmarket jungle.

    Adrian S., Subscriber

  • I have had the good fortune to be reasonably successful and enjoy the investment process. Your process would be recommended for both experts and those who are new to investing.

    Frank I., Subscriber
  • I am something of a momentum investor. I find Stock Trends useful as I can look at my portfolio as a “watch list” and quickly see where trends are declining in strength or reversing, so it is particularly useful as a tool in portfolio management regarding sales.

    William C., Subscriber
  • I've followed your recommendations since reading your columns in the Globe & Mail, and finding they published Stock Trends arrows in their financial listings. I do find them a guide to the general market and what I should be avoiding for declining chart trends.
    Has probably saved me the subscription by not rushing into hot stocks!

    Anthony D., Subscriber
  • I am fascinated with your service and methodology - it is very impressive. [...] Over the years I have concluded that there are many ways to approach stock investing, but once one has chosen a path, one is better off sticking to it.

    Bob E., Subscriber

  • Hence, anyone who had followed the "Stock Trends" line should have sold their Bre-X shares and, with the windfall, paid for a lifetime subscription to The Globe and Mail and more. Talk about return on investment!

    Muni P., Subscriber

  • There is a lot to be gained from comparing trends of how individual stocks are doing within a sector, as well as how the sector is performing relative to the broad market.

    Dudley R., Subscriber

  • I use Stock Trends to help direct my stock picks. Also, following the advice of Stock Trends I have religiously used stop-loss orders and have avoided hanging on to losing stocks for emotional reasons.

    John B., Subscriber
  • I want to thank you for posting such an excellent guide to technical analysis on the web. You have provided a great service to all of us novice investors.

    Michael C., Stock Trends user
  • I find your website and research very helpful in my stock trading. I have subscribed to several related services in the past and none present their work with “just the facts” as you. Please keep up the great work so that I can continue to learn! 

    Bryan E., Subscriber
  • An admitted cynic, it's obviously very high praise when he says he likes StockTrends because of its "simplicity, utility, openness, [and] honesty," and in addition to having "no hidden agenda" is "understandably documented [and] historically verifiable." And, he adds, "It lets me see a lot of things without doing a lot of work." Globe and Mail

    Paul W., Subscriber

  • Stock Trends analysis quantifies nicely the movement of individual stocks. I’ve found that if the technicals are out of synch with fundamental analysis, it is a wake-up call to make a decision. The Stock Trends Bull/Bear Ratio is useful in identifying major market bottoms and tops. It has always presented a good buying or selling opportunity.

    Charles G., Subscriber
  • I've followed a number of Stock Trends picks, and the methodology is solid.

    Doug B., Subscriber

  • Just thought I'd call to thank you, Skot. Stock Trends Weekly Reporter helped pay for my daughter's education!

    Peter H., Subscriber

  • Your report is an impressive, excellent tool and I have recommmended it to friends.

    Colin E., Subscriber

  • You have created and maintained an amazing, highly educational program and I am grateful for your part in getting our retirement funds to the good place they are.

    Karin M., Subscriber
  • Stock Trends Weekly Reporter is an easy way to pick up equities that represent an upward trend.

    Subscriber
  • Stock Trends information is part of the base information I review before making a trade.

    Subscriber

Subscription Plans

Subscription Plans

STWR - Monthly

$19.95

Monthly subscription plan to Stock Trends Weekly Reporter - pay your monthly subscription fees by having them automatically charged (PayPal only). Free 7-day trial period. Subscribers may cancel before the end of any subscription month.

STWR - 1 Year Prepaid Subscription

$199.00

1 Year Prepaid subscription to Stock Trends Weekly Reporter. Save 16% off monthly rate!

STWR - 2 Year Prepaid Subscription

$299.00

2 Year Prepaid subscription to Stock Trends Weekly Reporter. Save 37% off monthly rate!

STWR - 3 Year Prepaid Subscription

$399.00

3 Year Prepaid subscription to Stock Trends Weekly Reporter. Save 44% off monthly rate!

Stock Trends Editorial

  • High-Volume Leaders: A Closer Look at the Heaviest-Traded Stocks
    High-Volume Leaders: A Closer Look at the Heaviest-Traded Stocks Stock Trends’ Unusually High Volume () indicator flags stocks whose weekly trading volume is at least 200% of their 13-week average. In the October 31 weekly reports, only a small slice of the universe qualifies—making these signals rare and valuable. When high volume coincides with a bullish trend state (or a new Bullish Crossover), it can mark institutional footprints at the start of a multi-week advance.
    Read more...
  • Positioning for Opportunity: Trade Detente and Stock Trends Momentum
    Positioning for Opportunity: Trade Detente and Stock Trends Momentum The easing of tensions between the world’s two largest economies has given markets a fresh narrative. By stepping back from new export restrictions and cutting key tariffs, the United States and China have removed some of the most disruptive threats hanging over global supply chains. For investors, this détente creates a backdrop of relative stability in which powerful price trends can resume and new trend…
    Read more...
  • From Flash Crash to Rotation: The Probability–Payoff Map of a Rebuilding Market
    From Flash Crash to Rotation: The Probability–Payoff Map of a Rebuilding Market The market’s October tremor—an abrupt but short-lived flash crash—has given way to a familiar pattern in the Stock Trends framework: the rapid repair of breadth and the birth of new trends. Where panic once pressed prices indiscriminately, order is returning through a disciplined sequence of new bullish signals, rebuilding sectors, and the subtle reorganization of leadership beneath the surface.
    Read more...
  • Random Portfolios as a Benchmark: A Smarter Yardstick for Performance
    Random Portfolios as a Benchmark: A Smarter Yardstick for Performance Investors often compare performance to market indexes like the S&P 500, but traditional benchmarks have built-in biases. The S&P 500, for example, is heavily skewed toward large-cap stocks and “is not a good benchmark for measuring alpha” – it reflects a size-factor bias rather than pure manager skill. All major indexes systematically tilt toward certain factors (size, sector, value/growth, etc.), meaning they’re not truly passive…
    Read more...
View all Stock Trends Editorials


Subscription Plans

STWR - Monthly

$19.95/Month

Monthly subscription plan to Stock Trends Weekly Reporter - pay your monthly subscription fees by having them automatically charged (PayPal only). Free 7-day trial period. Subscribers may cancel before the end of any subscription month.

STWR - 1 Year Prepaid Subscription

$199/Year

1 Year Prepaid subscription to Stock Trends Weekly Reporter. Save 16% off monthly rate!

STWR - 2 Year Prepaid Subscription

$299/2 Years

2 Year Prepaid subscription to Stock Trends Weekly Reporter. Save 37% off monthly rate!

STWR - 3 Year Prepaid Subscription

$399/3 Years

3 Year Prepaid subscription to Stock Trends Weekly Reporter. Save 44% off monthly rate!