Reconciling Stock Trends analysis with randomness allows us to look at the trend indicators in a more refined way. Inference analysis helps us improve our trend trading calculations.
|
The quantitative analysis presented here is an attempt to confront randomness in the stock market. Too often technical analysis is presented in a manner that misrepresents the nature of the market. In focusing on pattern recognition it is easy to make the assumption that patterns direct the market. It is a natural human condition to look for patterns and assign meaning to the chaotic world around us. However, there is danger in assuming that randomness is an unfortunate by-product of the dynamics of order. To the contrary, there are aspects of order in randomness, but we should never assume that outcomes are assured beyond the bounds of random probabilities.
That’s a tough statement to make in the investment business. There’s a lot of money staked on the idea that we can understand the market. Investors pay handsomely for that notion: management fees, time and money invested on analysis and guidance, among many costly investment expenses. Nothing is more costly, however, than the investment losses that occur because investors put capital at risk beyond the limits of random probabilities. We lose more money because we think the market has order when in fact it does not. Of course, financial institutions cannot present themselves as purveyors of randomness. That’s a business that goes by another name.
Stock Trends was designed based on the idea that we could categorize order in the stock market. Trend analysis is about assigning order to price movement. Reversion to the mean aspects of price momentum analysis has some application toward randomness, but the type of momentum analysis Stock Trends emphasizes is more aligned with harnessing forces of order evident in mass psychology. Exposing market randomness, at first glance, makes Stock Trends look like another snake oil gimmick – one of many peddled in the business of guiding investors. Is it possible to reconcile our trend analysis with the randomness of market outcomes?
The truthful answer to that question is… perhaps not. We can assume that many stakeholders with immense resources in the investment business are grappling with the same problem. There’s a big demand for quantitative analysts in the financial sector for a reason. It’s a battle with randomness that has forced the investment business toward a data science solution.
My solution for Stock Trends is to reframe our analysis question. It’s a solution that shifts our focus away from the traditional trend analysis framework – one that is based on notions illustrated by select samples of pattern evidence – to a framework that is data driven and presents all outcomes, supporting and non-supporting. Every technical analyst – honest ones, anyway – can show you ten contradicting charts for every tidy chart that illustrates a particular pattern. Our analysis question is now: what does the data really tell us? From that answer we can propose a trading strategy.
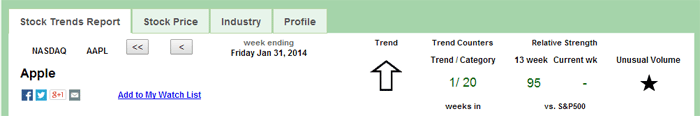
In previous editorials I’ve introduced a statistical inference model that attempts to translate sample observations into estimations of population means based on the indicator combinations presented in the Stock Trends Reports. The primary premise: that the Stock Trends indicator combinations represent distinct characteristics of a market condition. That condition is defined by the trend indicator, the length of trend category (major trend counter) and indicator (minor trend counter), the relative intermediate price momentum (Relative Strength Indicator) and weekly price performance (+/- indicator), as well as the evidence of unusual trading volume (volume indicator).
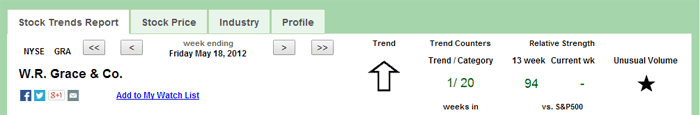
Here we are labelling across markets. The conditions of supply and demand represented in these indicator combinations are homogeneous – grouping the current market trend characteristics of iconic Apple’s big cap stock (AAPL-Q), for instance, with that of little-known W.R. Grace & Co. (GRA-N) on May 18, 2012.
The purpose of the inference model is to give us an estimated population mean and standard deviation from which to build a probability distribution – this on an assumption of randomness in the population of possible outcomes given the market condition (as defined by the indicator combination). Basically, we are trying to come to terms with randomness by assuming it, and looking for estimated indicator combination probability distributions that have a leg up on the expected random outcomes that include the universe of stocks.
Let’s again have a look at an example. It’s best that we look at the most easily defined Stock Trends event – the Crossover. We call this an event, but it is in reality a non-event. Strictly speaking it is a mathematical event defined by the crossing of a shorter-term (13-week) moving average trend line and a longer-term (40-week) moving average trend line – or more properly when the 13-week average share price moves either higher or lower than the 40-week average share price. This is not the kind of event that necessarily feeds back on a market for a stock, although in some circles it is promoted as such. However, it is an important event in our analysis that isolates changes in major trend category. It pinpoints when the Stock Trends parameters move between BULLISH and BEARISH.
Because in our inference model indicator combinations are supplemented with trend length qualifiers when querying the data for ‘like’ combinations, and the Crossovers by definition start a new trend, the Stock Trends trend counter for Crossover stocks is not much use for comparison. All Crossovers have trend counters 1/1. The way I have chosen to deal with this is to ascribe the length of the previous trend category (major trend counter) when looking for similar instances of Crossover stocks. This maintains an influence of time on the grouping of trend category changes as well. This is an important note to make about the Crossover stocks analysed.
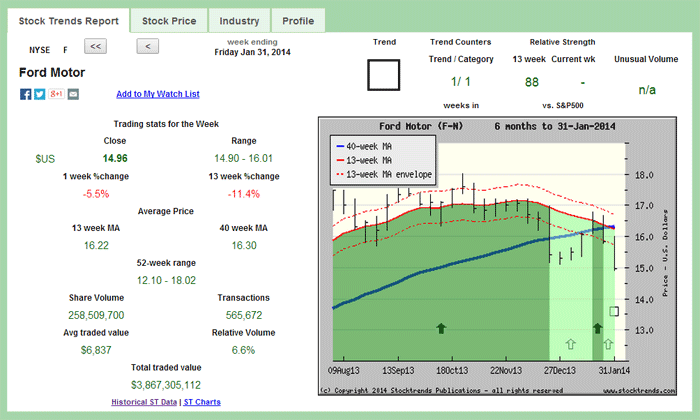
Ford Motor Co. (F-N) is currently a Bearish Crossover (
But what does our inference analysis really say about Crossovers? We’ve looked at some statistical analysis of that previously, but let’s evaluate how our probability guidance would have turned out for Ford’s stock over the past 30-years.
The first thing to note in the following data is that not all Ford stock's Crossovers are represented. Some of the Crossovers indicator combinations did not have a large enough sample size to complete the analysis. As such there are only 37 of the total 56 Crossovers that have occurred since 1980. A notable Crossover missing is that of May 8, 2009, a Bullish Crossover (
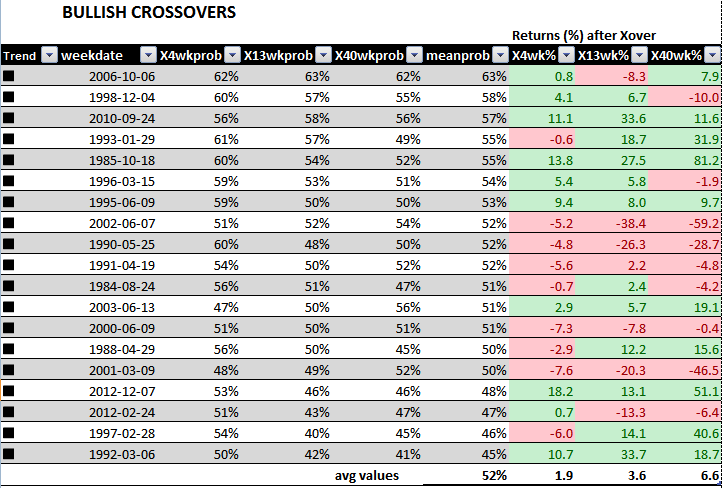 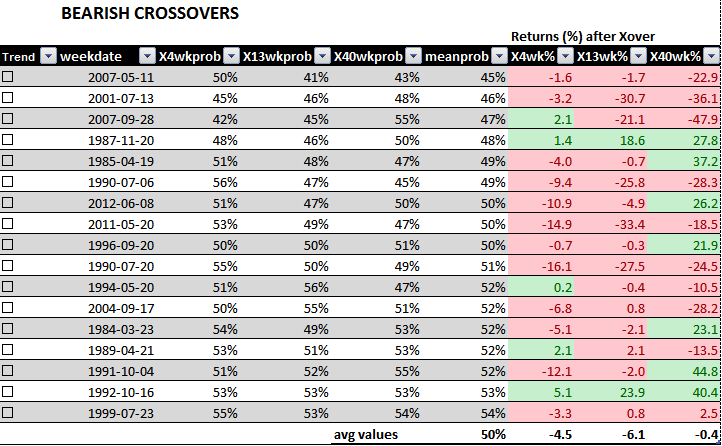 Both sets of results - Bullish and Bearish Crossovers - are sorted by the average probability that the stock will return better than the expected mean random outcome - our inference model. We discover the following:
For Bullish Crossover events where the mean probability of Ford's stock (F) besting the expected return of randomly selected stocks was greater than 52%, the stock beat the expected random return 17 out of 21 period-returns (81%) [green cells represent returns that outperformed the expected random return]. This compares to 15 out of 36 (42%) when the mean probability is less <= 52%.
For Bearish Crossover events where the mean probability of Ford's stock (F) besting the expected return of randomly selected stocks was less than 48%, the stock underperformed the expected random return 8 out of 9 returns (89%) [red cells represent returns that underperformed the expected random return]. This compares to 29 out of 42 (69%) when the mean probability is >= 48%.
This example tells us that our chances for a successful trade - that is, doing better than the return we can expect on a randomly selected stock - are enhanced by the inference model. As the average probability (across time periods) is outside some deviation (here above 52% and below 48%) of the probability of random stocks, the chances of a trade meeting our goals improve.
This explanation may seem complicated at this time, and future editorials will provide more examples to help us grasp the meaningfulness of the inference model. In the end, investors are looking for a slight edge, even in a game of chance.
Another important result of this analysis is that sometimes the inference analysis contradicts our expectations as far as the trade implications for the Stock Trends indicator. Sometimes a Bullish Crossover, based on the specific indicator combinations, presents an estimated return below the expected return of randomly selected stocks. Sometimes a Bearish Crossover, based on specific indicator combinations, presents an estimated return above the expected return of randomly selected stocks.
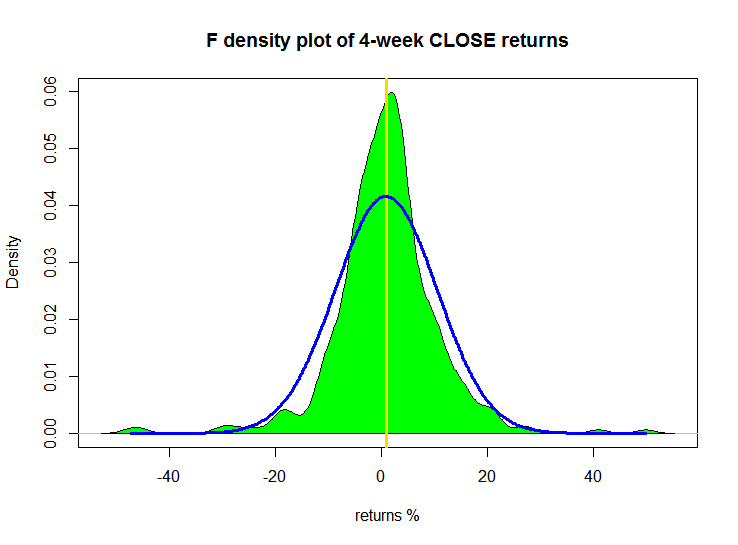
An example of this is found in the analysis of the current Stock Trends indicator combination of Ford's stock (F). Here are the estimated probability distributions over the 4-week, 13-week, and 40-week periods.
For 4-week returns distribution estimation, with 95% confidence, the 4-week mean return of the population of stocks with a smilar Stock Trends indicator combination to F will be inside [0.006%, 1.692%]. Mean return 0.85 and standard deviation of 9.63 For a Normal Distribution: For 4wk CLOSE P(R> 0)=53.51 For 4wk CLOSE P(R< 0)=46.49 For the 4-week period the probability of F returning better than the expected return of a randomly selected stock is 54%. 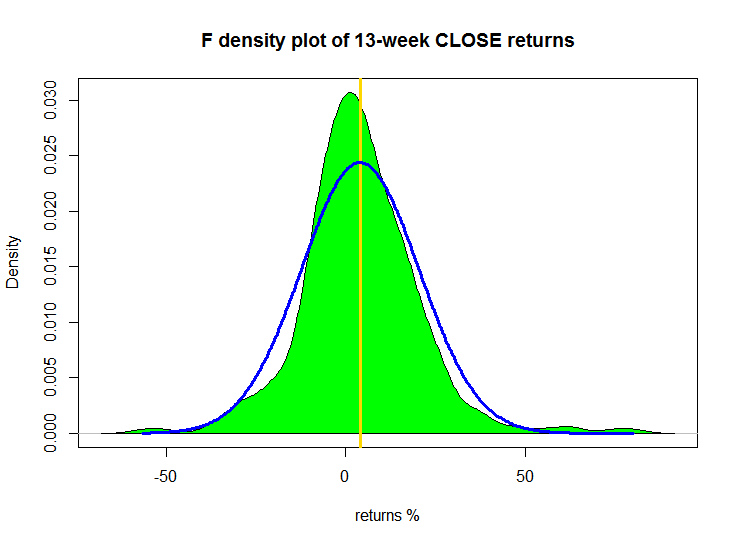
For 13-week returns distribution estimation, with 95 % confidence, the 13-week mean return of the population of stocks with a similar Stock Trends indicator combination to F will be inside [ 2.531 %, 5.434 %]
Mean return 3.98 and standard deviation of 16.42
For a Normal Distribution
For 13wk CLOSE P(R> 2.19)=54.35
For 13wk CLOSE P(R< 2.19)=45.65
52.3% of sample returns are >2.19%
For the 13-week period the probability of F returning better than the expected return of a randomly selected stock is 54%.
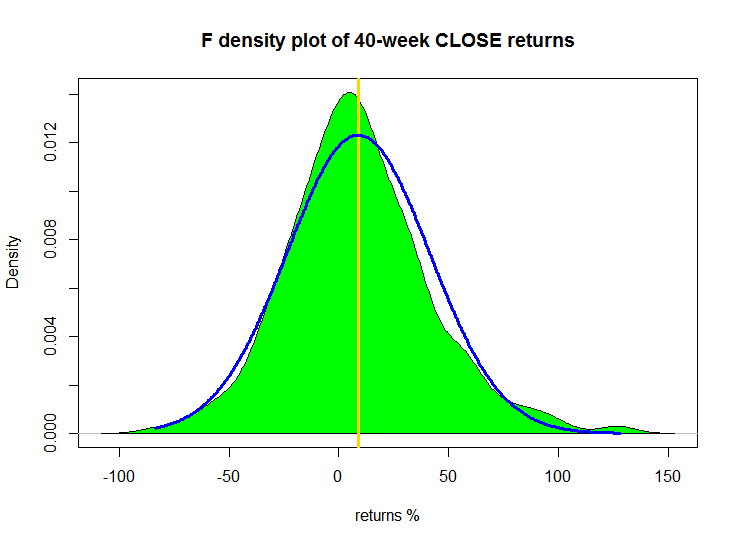
For 40-week returns distribution estimation, with 95 % confidence, the 40-week mean return of the population of stocks
with a similar Stock Trends indicator combination to F will be inside [ 5.9 %, 11.844 %]
Mean return 8.87 and standard deviation of 32.48
Normal Distribution
For 40wk CLOSE P(R> 6.45)=52.97
For 40wk CLOSE P(R< 6.45)=47.03
50.77% of sample returns are >6.45%
For the 40-week period the probability of F returning better than the expected return of a randomly selected stock is 53%.
The inference analysis is contradicting the trading implication of Ford's Bearish Crossover (
|
Published in Stock Trends
 Stock Trends information is part of the base information I review before making a trade.


