Ranking expectations

  • 24 January 2014 |
  • Written by  Skot Kortje, Stock Trends Analyst
  • font size
  • Print

The stock market exhibits undeniable aspects of randomness. If trading is like a toss of the coin, let's find a 'special' coin...

All reports and trading strategies in Stock Trends Weekly Reporter are derived from standard techniques of technical analysis. They are offered based on the premise that the indicators and chart patterns represented alert to possible trade events – either buying or selling. But because trading and investment advice is really a statement about future price movement - an uncertain domain – it should be framed as a probability statement.

The Stock Trends inference model I am developing is an attempt to do that. By looking at the results of past indicator combinations and assembling a sample space from which to estimate probable outcomes relative to probable outcomes of randomly selected stocks the model looks for a small edge in particular trend and price momentum situations. Put simply: if a trade is a toss of the coin, let’s find a 'special' coin.

 
First we must clarify that statements of probable outcomes enumerated here are not asserting what the actual outcome will be. That is unknown. The market could experience a massive correction, something that is in the realm of possible outcomes. Any individual stock could rally significantly… or drop precipitously. This analysis is not attempting to predict the price path of a stock. It is instead asserting that, assuming a particular distribution of the population of a sample space, a particular Stock Trends indicator combination signals a higher probability of a return greater than the one we would expect, on average, with a random stock selection. We’re playing to beat the monkey.
 
Ranking estimated means
 
In this week’s Stock Trends Picks of the Week reports (across all exchanges covered) there are 52 stocks highlighted. They include U.S. healthcare stocks like Eli Lilly & Co. (LLY-N) and AMN Healthcare Services Inc. (AHS-N), technology stocks like Digimarc Corp. (DMRC-Q), CommTouch Software (CTCH-Q), as well as precious metals stocks like Silver Standard Resources (SSO-T) and Agnico Eagle Mines (AEM-T) on the TSX. All of the stocks are selected based on a filter that looks for certain combinations of Stock Trends indicators, as well as share price and trading volume requirements.
 
The Picks of the Week report is designed as a weekly screening tool, helping investors locate stocks and exchange traded funds that might be signaling a good entry point. Generally, good practice is to look for additional confirmation, either technical or fundamental, in assessing the selections. The Stock Trends inference model allows us to evaluate these picks in terms of the statistical performance of grouped indicator combinations. Which stocks give us our best chance for a positive outcome?
 
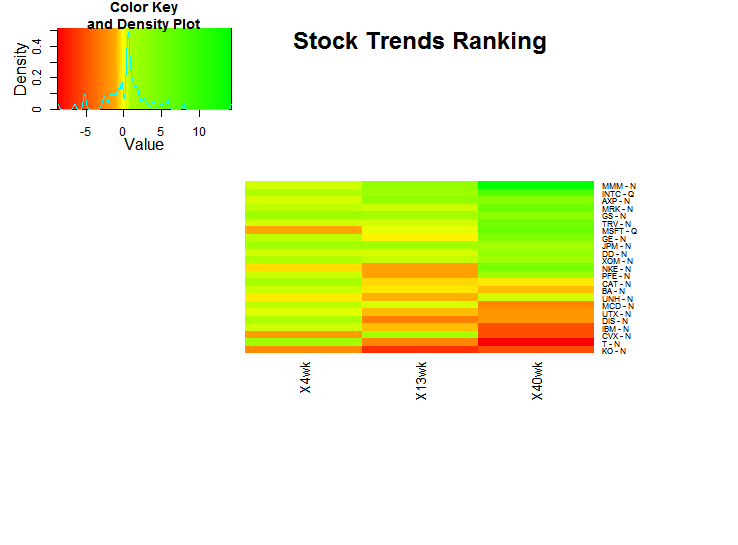
The following heatmap graph ranks the current top Picks of the Week selections based on the inference analysis. Each stock is evaluated to see how much its expected mean return is above the expected mean return of randomly selected stocks. The stocks are then ranked by the average mean return across all three periods (the “mean of means”).
 
 
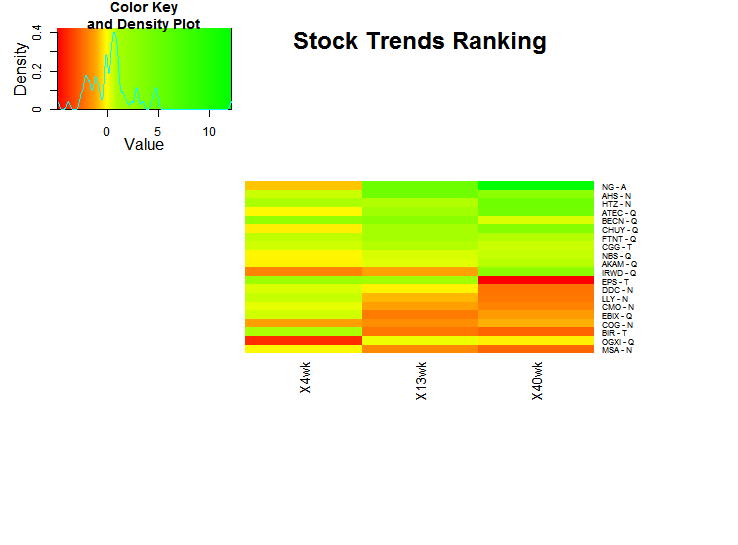
The colour scheme for the heatmap is set to the market base for random returns. Values that are greater than the expected mean return of randomly selected stocks have progressively darker green boxes; values that are less than the expected mean return of randomly selected stocks have progressively darker red boxes. Values hovering near the expected mean of randomly selected stocks are yellow. The color key legend gives us this representation. It also shows a density distribution of the “mean of the means” returns.
 
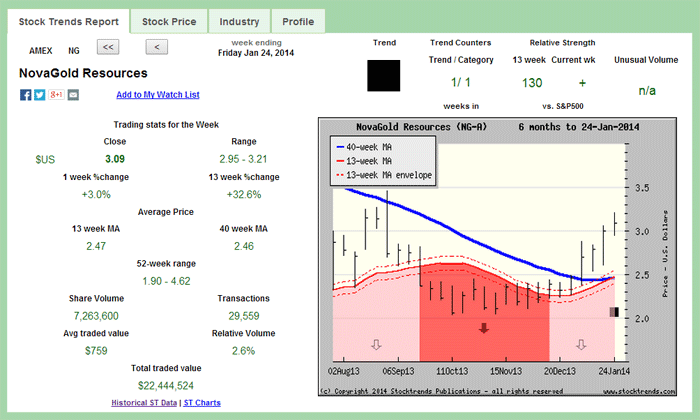
This analysis points us toward stocks that have the best record of indicating higher probabilities of positive returns throughout a 40-week period. At the top of the list – among this week’s Picks of the Week stocks – is NovaGold Resources (NG-A), AMN Healthcare Services (AHS-N), Hertz Global Holdings (HTZ-N), and Alphatec Holdings (ATEC-Q).
 
A breakdown of the analysis – what does it tells us?
 
Let's have a look at NovoGold Resources. Currently, it has a Bullish Crossover () trend indicator.


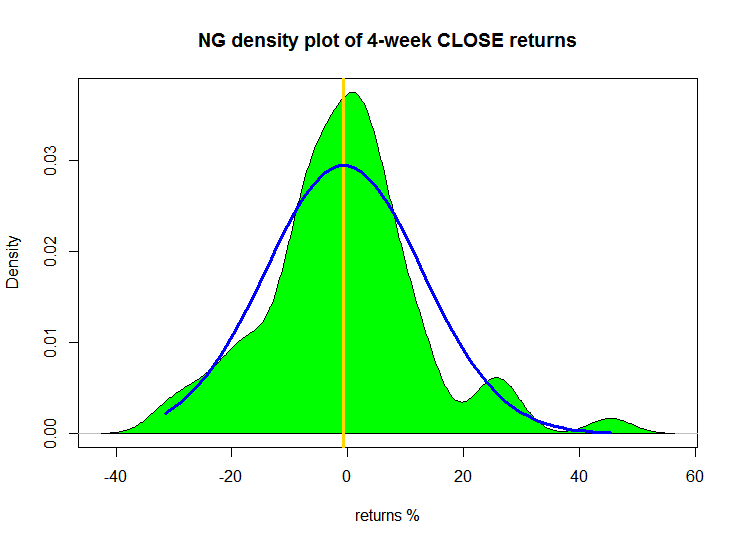
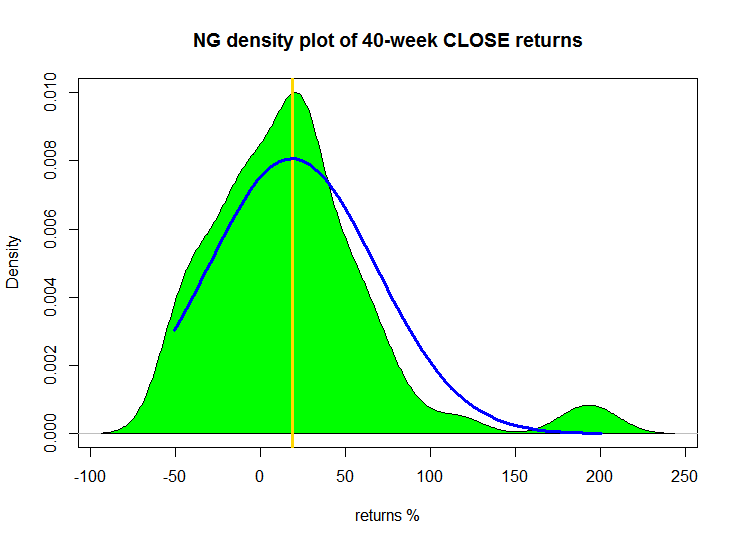
NovaGold’s current Stock Trends indicator combinations (*see note) generate the following distributions of returns for 4-week, 13-week, and 40-week periods:


The returns distribution of stocks that shared a similar Stock Trends indicator combination to NG (as described in last week’s editorial) tells us that the stock will perform relative to the expected random mean return are as follows:
 
There is a 48.1% probability that NG will return better than the expected mean return of randomly selected stocks at the end of the coming 4-week period.
 
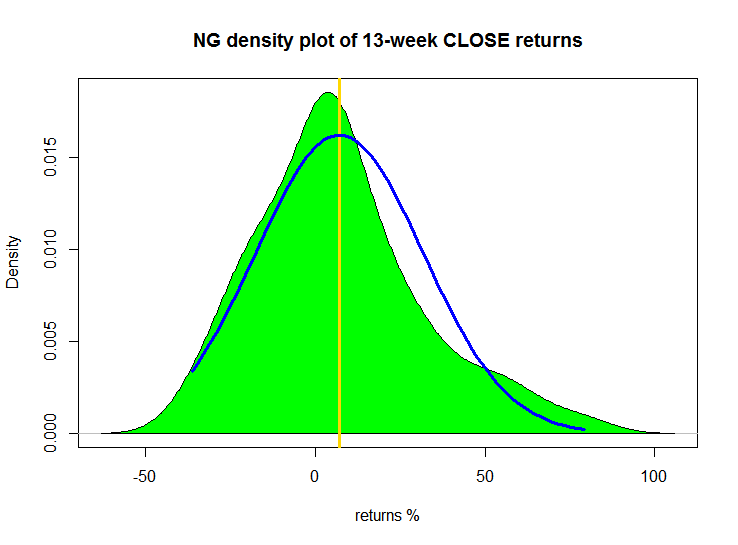
There is a 57.9% probability that NG will return better than the expected mean return of randomly selected stocks at the end of the coming 13-week period.
 
There is a 59.7% probability that NG will return better than the expected mean return of randomly selected stocks at the end of the coming 40-week period.
 
This analysis suggests that while NG’s shorter-term expectations are not that positive; the longer-term expectations are quite positive.
 
 
The components of the Dow Jones Industrials give us another representation of this analysis. Here not all 30 stocks currently have indicator combinations with large enough sample sizes for our inference model. This week there are 23 DJI stocks to compare.


Here we see that 3M Co. (MMM-N) ranks highest, and that Coca-Cola (KO-N) ranks lowest.


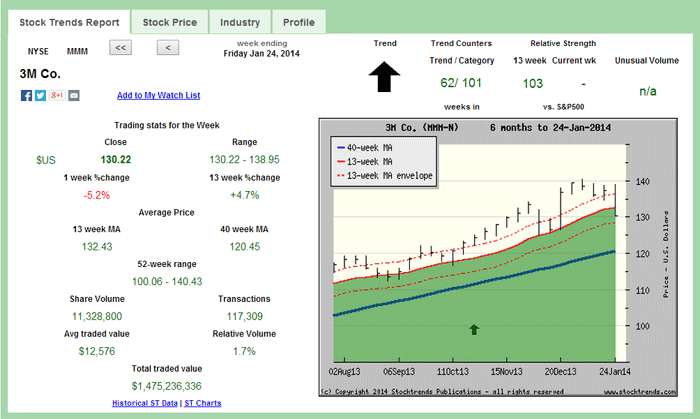
The returns distribution of stocks that shared a similar Stock Trends indicator combination to MMM tells us that the probabilities that the stock will perform relative to the expected random mean return are as follows:
 
There is a 52.5% probability that MMM will return better than the expected mean return of randomly selected stocks at the end of the coming 4-week period.
 
There is a 56.2% probability that MMM will return better than the expected mean return of randomly selected stocks at the end of the coming 13-week period.
 
There is a 65.95% probability that MMM will return better than the expected mean return of randomly selected stocks at the end of the coming 40-week period.
 
The analysis tells us that 3M Co. stock is a good bet. The stock is now in its 101st week of a Stock Trends Bullish trend and looks to continue along its path. At the very least, you would, on average, be better off buying MMM than buying a random stock.
 
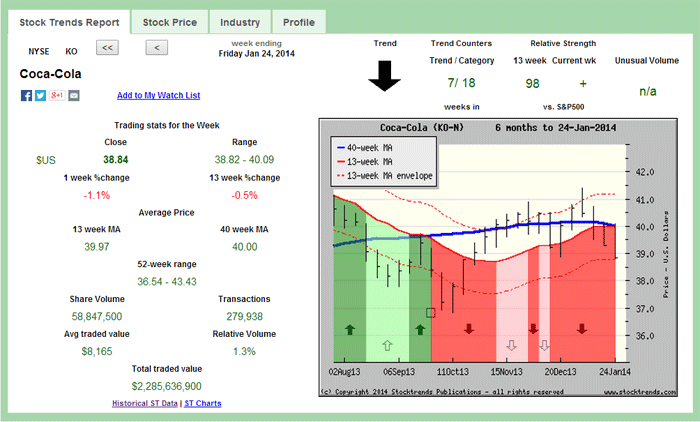
At the bottom of the Dow Jones Industrials in terms of current expectations is Coca-Cola.


The returns distribution of stocks that shared a similar Stock Trends indicator combination to KO tells us that the probabilities that the stock will perform relative to the expected random mean return are as follows:
 
There is a 42.6% probability that KO will return better than the expected mean return of randomly selected stocks at the end of the coming 4-week period.
 
There is a 38.4% probability that KO will return better than the expected mean return of randomly selected stocks at the end of the coming 13-week period.
 
There is a 43.4% probability that KO will return better than the expected mean return of randomly selected stocks at the end of the coming 40-week period.
 
Here the analysis tells us that Coca-Cola’s stock is not a good bet. You would be better off to buy a random stock.


[note: for Bullish Crossover and Bearish Crossover stocks the trend counter criteria reverts to the previous week's counters. In that manner the length of the previous trend category is the pertinent comparison. This adjustment is made for queries on all Crossover combinations because the trend counters are set to 1 for Crossovers.]


back to top

Subscriber Testimonials

  • I find your website and research very helpful in my stock trading. I have subscribed to several related services in the past and none present their work with “just the facts” as you. Please keep up the great work so that I can continue to learn! 

    Bryan E., Subscriber
  • I very much like the systematic approach to analyzing stock data, it fits my approach.

    Subscriber
  • I have had the good fortune to be reasonably successful and enjoy the investment process. Your process would be recommended for both experts and those who are new to investing.

    Frank I., Subscriber
  • I've followed a number of Stock Trends picks, and the methodology is solid.

    Doug B., Subscriber

  • I am something of a momentum investor. I find Stock Trends useful as I can look at my portfolio as a “watch list” and quickly see where trends are declining in strength or reversing, so it is particularly useful as a tool in portfolio management regarding sales.

    William C., Subscriber
  • Stock Trends analysis quantifies nicely the movement of individual stocks. I’ve found that if the technicals are out of synch with fundamental analysis, it is a wake-up call to make a decision. The Stock Trends Bull/Bear Ratio is useful in identifying major market bottoms and tops. It has always presented a good buying or selling opportunity.

    Charles G., Subscriber
  • There is a lot to be gained from comparing trends of how individual stocks are doing within a sector, as well as how the sector is performing relative to the broad market.

    Dudley R., Subscriber

  • I want to thank you for posting such an excellent guide to technical analysis on the web. You have provided a great service to all of us novice investors.

    Michael C., Stock Trends user
  • An admitted cynic, it's obviously very high praise when he says he likes StockTrends because of its "simplicity, utility, openness, [and] honesty," and in addition to having "no hidden agenda" is "understandably documented [and] historically verifiable." And, he adds, "It lets me see a lot of things without doing a lot of work." Globe and Mail

    Paul W., Subscriber

  • I've followed your recommendations since reading your columns in the Globe & Mail, and finding they published Stock Trends arrows in their financial listings. I do find them a guide to the general market and what I should be avoiding for declining chart trends.
    Has probably saved me the subscription by not rushing into hot stocks!

    Anthony D., Subscriber
  • Stock Trends information is part of the base information I review before making a trade.

    Subscriber
  • Just thought I'd call to thank you, Skot. Stock Trends Weekly Reporter helped pay for my daughter's education!

    Peter H., Subscriber

  • I am fascinated with your service and methodology - it is very impressive. [...] Over the years I have concluded that there are many ways to approach stock investing, but once one has chosen a path, one is better off sticking to it.

    Bob E., Subscriber

  • Your report is an impressive, excellent tool and I have recommmended it to friends.

    Colin E., Subscriber

  • I am just writing to tell you of my appreciation of your service! It makes so much sense to me. You seem to be an oasis of stability and sensibility in a stockmarket jungle.

    Adrian S., Subscriber

  • I use Stock Trends to help direct my stock picks. Also, following the advice of Stock Trends I have religiously used stop-loss orders and have avoided hanging on to losing stocks for emotional reasons.

    John B., Subscriber
  • Stock Trends Weekly Reporter is an easy way to pick up equities that represent an upward trend.

    Subscriber
  • Hence, anyone who had followed the "Stock Trends" line should have sold their Bre-X shares and, with the windfall, paid for a lifetime subscription to The Globe and Mail and more. Talk about return on investment!

    Muni P., Subscriber

  • Thank you for your excellent work and kind approach to your customers.

    Odette C., Subscriber

  • You have created and maintained an amazing, highly educational program and I am grateful for your part in getting our retirement funds to the good place they are.

    Karin M., Subscriber

Subscription Plans

Subscription Plans

STWR - Monthly

$19.95

Monthly subscription plan to Stock Trends Weekly Reporter - pay your monthly subscription fees by having them automatically charged (PayPal only). Free 7-day trial period. Subscribers may cancel before the end of any subscription month.

STWR - 1 Year Prepaid Subscription

$199.00

1 Year Prepaid subscription to Stock Trends Weekly Reporter. Save 16% off monthly rate!

STWR - 2 Year Prepaid Subscription

$299.00

2 Year Prepaid subscription to Stock Trends Weekly Reporter. Save 37% off monthly rate!

STWR - 3 Year Prepaid Subscription

$399.00

3 Year Prepaid subscription to Stock Trends Weekly Reporter. Save 44% off monthly rate!

Stock Trends Editorial

  • Long and strong - Bullish trends in specialized retailers
    Long and strong - Bullish trends in specialized retailers Amidst a market still digesting the Federal Reserve’s first rate cut in nine months, one theme stands out in the latest Stock Trends dataset: the remarkable resilience of retail leaders. While thousands of common stocks across NYSE, Nasdaq, and TSX are posting Strong Bullish signals, three consumer-facing companies — TJX Companies, O’Reilly Automotive, and Dollarama — hold the longest uninterrupted Bullish runs on their exchanges.…
    Read more...
  • From Banks to Bytes to Uranium: Strong Bulls Align with ST-IM Signals
    From Banks to Bytes to Uranium: Strong Bulls Align with ST-IM Signals On September 17, 2025, the U.S. Federal Reserve delivered its first interest rate cut in nine months, lowering the federal funds rate by 25 basis points to a new target range of 4.00%–4.25%. This was a response to clear signs of a cooling labor market—slower job growth, shorter workweeks, and rising unemployment in several cohorts. Although inflation remains above the Fed’s 2% target, policymakers signaled…
    Read more...
  • Money management and trading psychology: building a resilient trading plan that integrates with the Stock Trends decision-tree framework
    Money management and trading psychology: building a resilient trading plan that integrates with the Stock Trends decision-tree framework Financial markets are unpredictable. Even when a trading strategy has a positive expectancy, a few bad trades can wipe out an account if position sizes are too large or emotions override discipline. Academic studies show that how much capital is allocated per trade is more influential on long‑term returns than the specific trading system used. For example, research cited by position‑sizing specialist Van Tharp found that…
    Read more...
  • Stock Trends: The Human Side of Market Trends
    Stock Trends: The Human Side of Market Trends Markets don’t move on math alone—they move on people. The screens light up because millions of humans react to news, stories, and each other. Behavioral economics is the field that studies those reactions. This article introduces the big ideas, then brings the story up to date with automated bots and AI trading—and explains how the Stock Trends framework helps you navigate it all.
    Read more...
View all Stock Trends Editorials


Subscription Plans

STWR - Monthly

$19.95/Month

Monthly subscription plan to Stock Trends Weekly Reporter - pay your monthly subscription fees by having them automatically charged (PayPal only). Free 7-day trial period. Subscribers may cancel before the end of any subscription month.

STWR - 1 Year Prepaid Subscription

$199/Year

1 Year Prepaid subscription to Stock Trends Weekly Reporter. Save 16% off monthly rate!

STWR - 2 Year Prepaid Subscription

$299/2 Years

2 Year Prepaid subscription to Stock Trends Weekly Reporter. Save 37% off monthly rate!

STWR - 3 Year Prepaid Subscription

$399/3 Years

3 Year Prepaid subscription to Stock Trends Weekly Reporter. Save 44% off monthly rate!