Statistical inference of price trends

  • 19 August 2013 |
  • Written by  Skot Kortje, Stock Trends Analyst
  • font size
  • Print

Investors who want to apply a quantitative approach to their trading can learn more about the Stock Trends statistical inference model.

How can a statistical approach to the Stock Trends indicator combinations guide our trading? A trading strategy can be effectively constructed by assigning a probable outcome that is weighted as a directional trade and controlled for risk at defined levels. Although the success of any trading system hinges on prudent money management principles, positive trade expectations are crucial to long-term results. Confidence in a system builds off its ability to match expectations. Certain Stock Trends indicator combinations exhibit post-observation historical returns that imply improved trade expectations and generate risk profiles for statistically probable outcomes. This is a golden starting point for any trade.

From our core assumption that trend patterns are transferable across markets – namely the assumption that the Stock Trends trend indicator, the length of trend, relative price momentum indicators, and the unusual volume indicators as a ‘combination’ of variables can be grouped and evaluated for post-observation price performance – we test a posited correlation. Sometimes correlation can be specious – making improbable links between cause and effect. Sometimes we can mistakenly attribute stock price changes to variables that are not independent. In order to avoid these analysis failures it is important to review the variables we have grouped and understand why the Stock Trends indicator combinations represent discrete categories that can be measured for correlation with a subsequent outcome. (At a later date statistical tests for variable independence and correlation will be presented.)
 
When statisticians talk about correlation they are referring to a dependency. They are referring to an independent variable having an effect on an outcome. It does not mean causation. It does not necessarily mean that A caused B. It means that A somehow influenced a change in B. In our framework we are generally asserting that the changes in the price of a stock – its price trend, its longevity of trend, and the degree of price movement – have an effect on subsequent price movement. Also, we are stating that these variables are homogeneous across stocks – that the same influences of trend and price momentum affect subsequent price movement of every stock. Here we are implying that principles of mass psychology direct the market.
 
Consider the following: suppose the share price of a stock has been trending positively for many months, and has rallied again – out-pacing the broad market performance by over 25% in the most recent three month period. The share price is up over 100% since the beginning of its bullish trend. Obviously, existing shareholders have booked paper profits. However, these shareholders, regardless of which stock in question, have pressure to act on these returns - the pressure to respond to the accelerated interest in the stock that the market brings to bear.
 
The scale of interest may be different with every stock, but the underlying force to act remains: to sell or not? Of course, there are forces that balance the sell influence. The same forces that bring new buyers to the table make many current shareholders that much more confident that the share price is destined to ride even higher. Certainly, for blue chip stocks the forces of inertia, the tendency to ‘hold’, are considerable – institutional ownership and the emotional attachment to a company’s brand often mutes the market’s pull. But inevitably the force of the market – which is represented by changes in the share price – comes to bear. Eventually the market wins.
 
Do the Stock Trends indicator combinations categorize these psychological market moments?  
 
Let’s have a look at the August 16th Stock Trends reports. If we rank the Stock Trends indicator combinations by the statistical analysis of returns introduced in previous editorials – focusing for now only on large cap North American stocks (many of which are institutional holdings) – the top-ranked statistical performing Stock Trends indicator combinations are currently sported by these stocks:
 

Trend

Issue

Price($)

Expected Mean Returns (%)


4-week

13-week

40-week

Abercrombie & Fitch (ANF)
48.39
2.2
8.8
15.8
Activision Blizzard (ATVI)
17.30
2.8
7.2
23.9
Colgate Palmolive (CL)
59.47
3.2
8.6
16.7
Accenture plc (ACN)
71.65
3.1
8.3
19.2
Micron Technology (MU)
14.01
1.5
8.3
15.7
ETrade Financial (ETFC)
14.56
1.8
6.9
14.4
SLM Corporation (SLM)
24.82
3.1
6.7
14.4
Best Buy (BBY)
30.37
2.4
7.3
9.8
Robert Half International (RHI)
37.95
1.1
5.9
10.8
Northrop Grumman (NOC)
94.02
3.5
5.5
14.1
Viacom Inc. (VIAB)
78.51
2.6
5.8
12.8
Kimberly Clark (KMB)
94.94
1.8
6.3
10.6
Clorox Co. (CLX)
84.09
2.2
5.0
12.0
Baidu (BIDU)
134.64
2.7
5.6
10.7
TripAdvisor, Inc. (TRIP)
70.99
1.5
5.9
15.1
Tiffany & Co. (TIF)
79.62
1.4
5.2
15.6
Shoppers Drug Mart (SC)
59.65
1.9
5.6
11.0
Hewlett-Packard Co. (HPQ)
26.42
1.5
5.9
14.7
Keycorp (KEY)
12.16
0.9
4.6
11.7
Eastman Chemical (EMN)
77.85
2.0
5.0
10.2
Plum Creek Timber (PCL)
44.50
2.0
4.3
10.6
Cablevision Systems (CVC)
18.43
1.9
4.7
10.4
Facebook, Inc. (FB)
37.08
1.7
4.7
10.6
Washington Post (WPO)
569.77
1.6
4.8
12.8
Pepco Holdings (POM)
19.22
1.2
4.4
10.6
Allergan (AGN)
87.93
1.2
5.0
9.1
Western Digital (WDC)
64.60
1.1
4.2
9.7
Harman International (HAR)
67.11
1.8
4.0
12.7
American Electric Power Co. (AEP)
43.31
1.2
4.4
10.1
Sandisk Corp. (SNDK)
55.81
1.8
3.9
12.8
Sealed Air Corp. (SEE)
29.16
1.3
4.1
12.8
AmerisourceBergen (ABC)
56.53
1.1
3.9
12.0
Priceline.com (PCLN)
940.07
1.4
4.4
11.7
Loblaw Companies (L)
46.54
1.7
3.8
11.9
CME Group (CME)
73.35
1.5
4.3
11.0
Cerner Corp. (CERN)
47.38
2.3
4.1
10.7
Dover Corp. (DOV)
87.15
1.3
3.6
11.7
Staples Inc. (SPLS)
16.84
1.5
4.2
11.2
FedEx (FDX)
108.68
1.6
3.9
11.1
Tyson Foods (TSN)
31.44
1.1
3.8
11.5
Assurant Inc. (AIZ)
55.23
1.4
4.0
10.4
St. Jude Medical Inc. (STJ)
51.47
2.1
4.2
9.1
Fossil Group (FOSL)
117.16
1.6
3.5
9.5
Ryder System (R)
58.89
1.7
3.4
9.2
Interpublic Group of Cos. (IPG)
15.92
1.7
3.9
8.7
Gap Inc. (GPS)
43.12
1.5
3.9
9.7
Royal Bank of Canada (RY)
64.36
1.0
3.4
12.0
WellPoint Inc. (WLP)
86.05
1.6
3.8
8.9
Xerox Corp. (XRX)
10.30
1.2
3.6
9.7
DuPont (DD)
58.28
0.9
3.8
7.5
Time Warner Cable (TWC)
109.94
1.4
3.4
9.2
Canadian Tire Corporation (CTC.A)
90.07
0.9
3.7
7.7
Hospira Inc. (HSP)
40.20
1.4
3.3
9.1
Comerica Inc. (CMA)
42.57
1.4
3.5
8.1
Bed Bath & Beyond (BBBY)
73.45
1.0
3.6
7.6
Capital One Financial (COF)
67.16
1.3
3.3
8.2
Starbucks (SBUX)
70.71
1.1
3.4
9.5
Harris Corp. (HRS)
57.29
1.3
3.3
8.3
Johnson Controls (JCI)
40.54
1.3
3.3
9.2
Huntington Bancshares (HBAN)
8.56
1.1
3.4
9.6
Weyerhaeuser (WY)
27.06
0.9
3.2
9.4
Spectra Energy (SE)
33.54
0.8
3.3
7.5
CA Inc. (CA)
30.55
0.8
3.3
7.5
Quanta Services (PWR)
26.54
0.5
3.1
8.5
Saputo Inc. (SAP)
47.37
0.7
3.1
7.6
Juniper Networks (JNPR)
20.44
1.3
3.0
9.0
UnitedHealth Group (UNH)
71.43
0.6
3.2
7.8
O'Reilly Automotive (ORLY)
123.14
1.0
3.1
9.1
Exelon (EXC)
30.16
0.5
2.8
8.8
American Express (AXP)
75.17
0.6
2.9
7.7
Lockheed Martin (LMT)
122.20
0.5
3.0
9.6
Catamaran Corp. (CCT)
56.91
1.1
2.9
7.3
Philip Morris International (PM)
85.75
0.6
2.8
7.7
Raytheon Co. (RTN)
76.74
0.6
2.8
9.4
 
Among the top-ranked stocks is Colgate Palmolive (
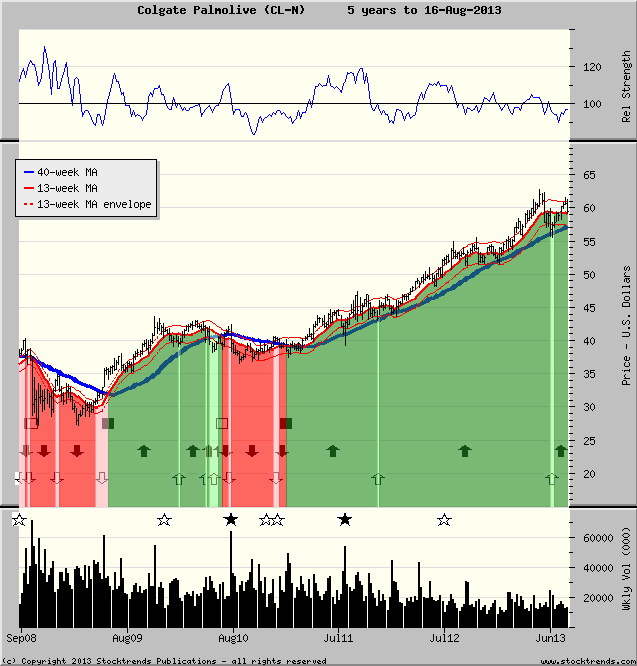
CL-N). This familiar consumer staple stock has been categorized as Stock Trends bullish for 134 weeks, although it dropped to support along its primary trend line at the end of June and went Weak Bullish briefly. The stock is currently underperforming the market by 3% (RSI 97) but gained some ground in most recent weeks (RSI +). Although its chart shows a secondary trend line that is flat, the bullish long-term trend is entrenched and has not been compromised often (only two brief Weak Bullish periods).  The market ‘buy’ forces are much stronger than the market forces to ‘sell’. The combination of Stock Trends indicators represented in CL’s Stock Trends Report encodes these chart (market) characteristics.


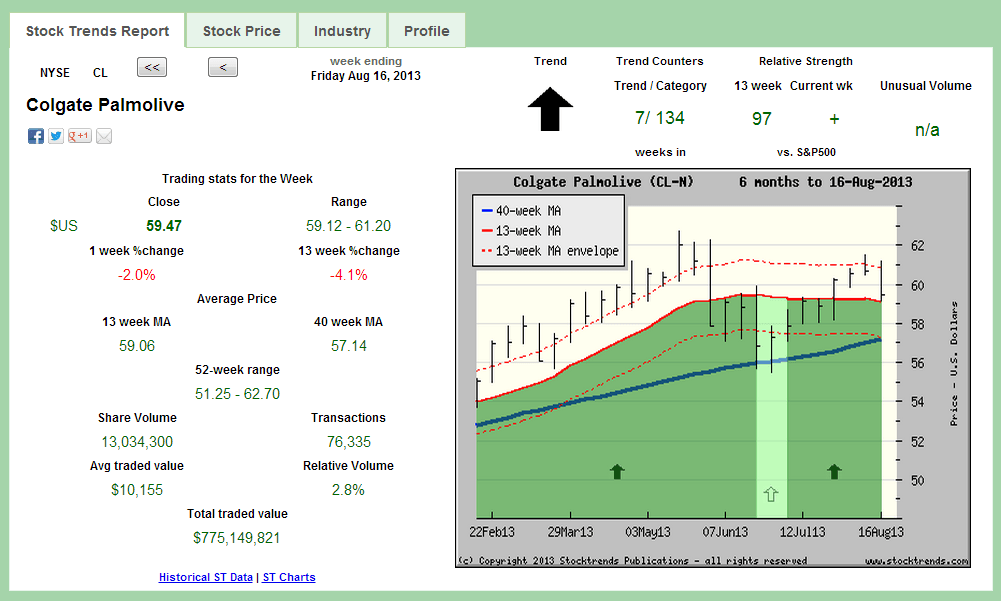
Our statistical analysis of previous instances of similar combinations (there are 42 similar observations in this sample) in the past directs us with some very positive results. What do these market characteristics indicate? Below is a statistical inference summary of the three post-observation time periods (4-week, 13-week, and 40-week).
 
 
For  4-week returns estimation, with  95 % confidence, the  4-week mean return of stocks with similar Stock Trends indicator combinations to CL will be inside [ 1.429 %, 4.968 ].  In other words, a basket of stocks similar to CL in terms of trend, trend length, price momentum and volume indicators would return between 1.4% and 5.0% at the end of the coming 4-week period.
 
Mean return 3.2% and standard deviation of 6.73
 
Normal Distribution
For 4wk CLOSE P(R> 10%)= 15.61
For 4wk CLOSE P(R< -10%)= 2.49
 
12.2% of sample returns are >10%
 
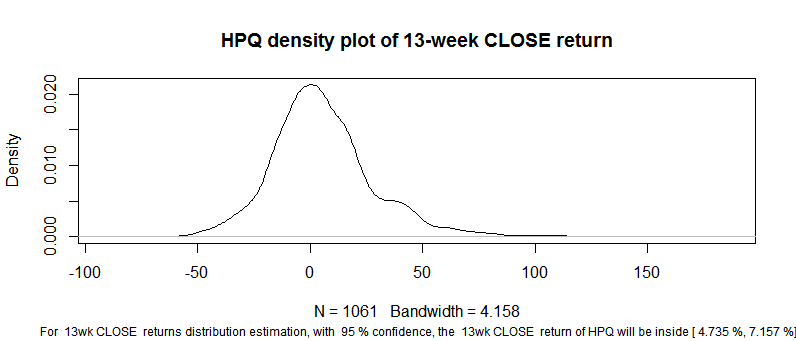
For  13-week returns estimation, with  95 % confidence, the  13-week mean return of stocks with similar Stock Trends indicator combinations to CL will be inside [5.275 %, 11.849 %].  In other words, a basket of stocks similar to CL in terms of trend, trend length, price momentum and volume indicators would return between 5.3% and 11.9% at the end of the coming 13-week period.
 
Mean return  8.56% and standard deviation of 12.5
 
Normal Distribution
For 13wk CLOSE P(R> 10%)=45.42
For 13wk CLOSE P(R< -10)=6.88
41.46% of sample returns are >10%
 
For  40-week returns estimation, with  95 % confidence, the  40-week mean return of stocks with similar Stock Trends indicator combinations to CL will be inside [9.137 %, 24.293 %].  In other words, a basket of stocks similar to CL in terms of trend, trend length, price momentum and volume indicators would return between 9.1% and 24.3% at the end of the coming 40-week period.
 
Mean return  16.71% and standard deviation of 27.69
 
Normal Distribution
For 40wk CLOSE P(R> 10)=59.58
For 40wk CLOSE P(R< -10)=16.73
57.89% of sample returns are >10%
 
 
The statistical inference of the population mean for stocks with these characteristics reveals above-market performance results for all three time frames. Focussing on the 13-week time frame, stocks that share similar indicator combinations to CL's current combination have a mean (average) return of 8.6%, and a confidence interval [5.275% to 11.849%] that is well above the interval exhibited by random results for the 13-week period (stocks randomly picked from the entire population, historically, of North American stocks have a mean between 2.1% and 2.3%).
 
If we assume a normal distribution of returns, the analysis also implies there is a 45.4 per cent chance that CL will have a return greater than 10% at the end of 13-weeks.  Alternatively, CL has a 6.9% chance of dropping more than 10% in 13-weeks. Indeed, it is the estimation of the probability of an outcome that makes this inference model a foundation for an algorithmic trading strategy.
 
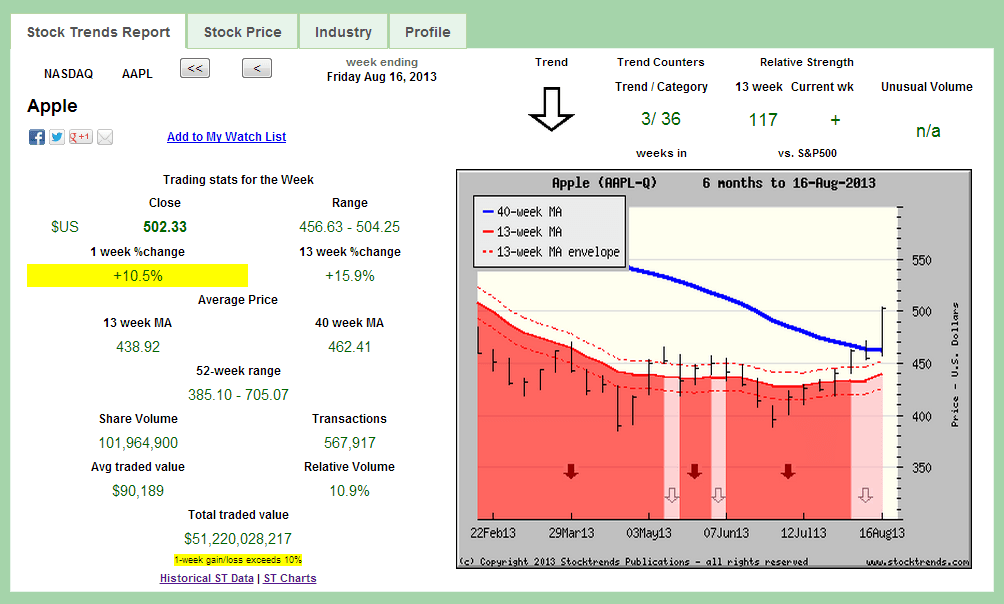
For now we’ll stick to trying to understand how the statistical inferences work, and how they respond to changing conditions. Let’s go back to the example stocks presented in the last editorial – Apple Inc. (
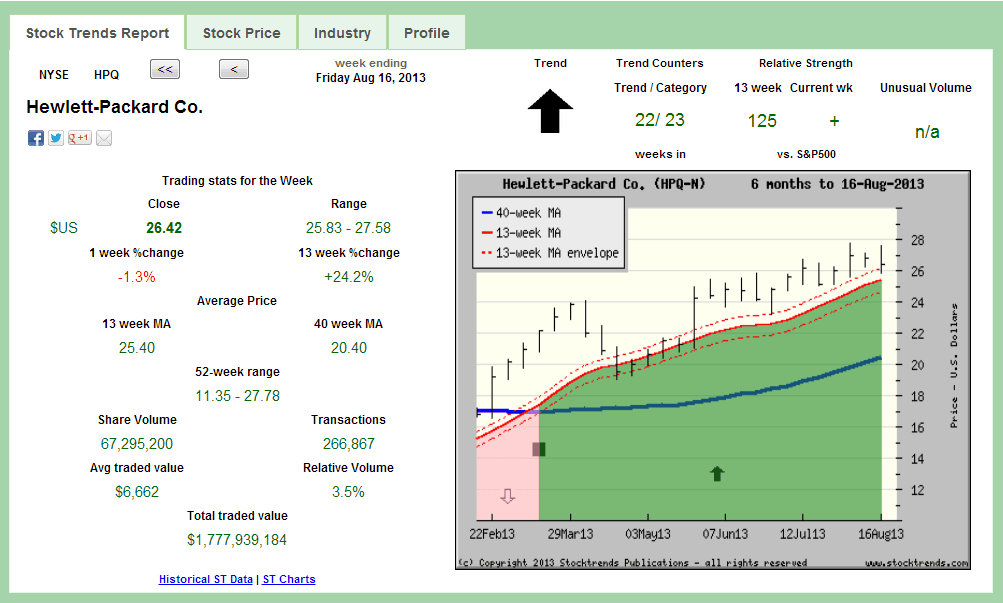
AAPL-Q) and Hewlett Packard (HPQ-N). Since that editorial AAPL has rallied from $462.54 to above $500 and is now out-performing the market in the past 13-weeks by 17%. What are the new statistical inferences we can make from Apple’s current observation?


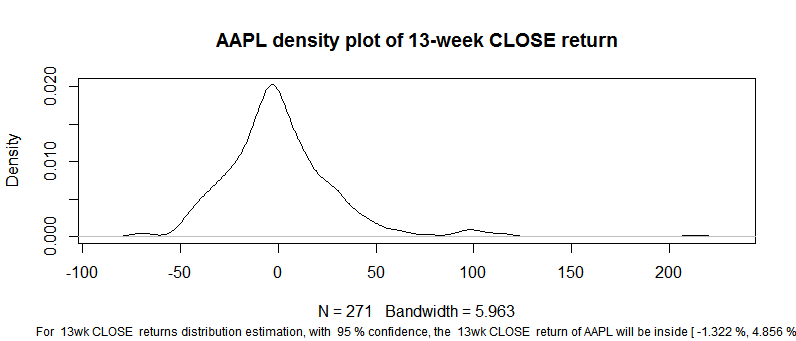
The mean of the population is now estimated to be between -1.3% and 4.9%, while at Aug 2 the interval was estimated to be inside 0.3% and 3.2%. The expected return of AAPL has improved, but not enough to change its relative performance expectations versus other big cap stocks. Returning to HPQ, here is its current ST Report and the returns that are inferred from this observation:


Here the statistical inference of the population mean for observations similar to HPQ continue to be higher than AAPL’s even though its share price has dropped marginally from $27 to $26.42. The analysis still supports a HPQ buy over an AAPL buy.
 
Are there characteristics of trend and momentum that show statistical evidence of future market out-performance?  We would need more time periods of analysis to make any attempt at systematic filtering for optimal combinations, but the current data presented by large cap stocks supports a well-known adage: the trend is your friend. Most of the highest ranked statistical combinations involve rather lengthy, established trends.
 
Stock Trends will work toward making the analysis an important part of our weekly reports. For now, future editorials will commence a weekly selection of top and bottom ranked stocks as determined by the statistical inferences described here.
 
back to top

Subscriber Testimonials

  • I use Stock Trends to help direct my stock picks. Also, following the advice of Stock Trends I have religiously used stop-loss orders and have avoided hanging on to losing stocks for emotional reasons.

    John B., Subscriber
  • Hence, anyone who had followed the "Stock Trends" line should have sold their Bre-X shares and, with the windfall, paid for a lifetime subscription to The Globe and Mail and more. Talk about return on investment!

    Muni P., Subscriber

  • I want to thank you for posting such an excellent guide to technical analysis on the web. You have provided a great service to all of us novice investors.

    Michael C., Stock Trends user
  • I am fascinated with your service and methodology - it is very impressive. [...] Over the years I have concluded that there are many ways to approach stock investing, but once one has chosen a path, one is better off sticking to it.

    Bob E., Subscriber

  • I am something of a momentum investor. I find Stock Trends useful as I can look at my portfolio as a “watch list” and quickly see where trends are declining in strength or reversing, so it is particularly useful as a tool in portfolio management regarding sales.

    William C., Subscriber
  • I've followed your recommendations since reading your columns in the Globe & Mail, and finding they published Stock Trends arrows in their financial listings. I do find them a guide to the general market and what I should be avoiding for declining chart trends.
    Has probably saved me the subscription by not rushing into hot stocks!

    Anthony D., Subscriber
  • I am just writing to tell you of my appreciation of your service! It makes so much sense to me. You seem to be an oasis of stability and sensibility in a stockmarket jungle.

    Adrian S., Subscriber

  • You have created and maintained an amazing, highly educational program and I am grateful for your part in getting our retirement funds to the good place they are.

    Karin M., Subscriber
  • I've followed a number of Stock Trends picks, and the methodology is solid.

    Doug B., Subscriber

  • Stock Trends Weekly Reporter is an easy way to pick up equities that represent an upward trend.

    Subscriber
  • An admitted cynic, it's obviously very high praise when he says he likes StockTrends because of its "simplicity, utility, openness, [and] honesty," and in addition to having "no hidden agenda" is "understandably documented [and] historically verifiable." And, he adds, "It lets me see a lot of things without doing a lot of work." Globe and Mail

    Paul W., Subscriber

  • There is a lot to be gained from comparing trends of how individual stocks are doing within a sector, as well as how the sector is performing relative to the broad market.

    Dudley R., Subscriber

  • Stock Trends information is part of the base information I review before making a trade.

    Subscriber
  • Thank you for your excellent work and kind approach to your customers.

    Odette C., Subscriber

  • Stock Trends analysis quantifies nicely the movement of individual stocks. I’ve found that if the technicals are out of synch with fundamental analysis, it is a wake-up call to make a decision. The Stock Trends Bull/Bear Ratio is useful in identifying major market bottoms and tops. It has always presented a good buying or selling opportunity.

    Charles G., Subscriber
  • Your report is an impressive, excellent tool and I have recommmended it to friends.

    Colin E., Subscriber

  • I have had the good fortune to be reasonably successful and enjoy the investment process. Your process would be recommended for both experts and those who are new to investing.

    Frank I., Subscriber
  • I find your website and research very helpful in my stock trading. I have subscribed to several related services in the past and none present their work with “just the facts” as you. Please keep up the great work so that I can continue to learn! 

    Bryan E., Subscriber
  • Just thought I'd call to thank you, Skot. Stock Trends Weekly Reporter helped pay for my daughter's education!

    Peter H., Subscriber

  • I very much like the systematic approach to analyzing stock data, it fits my approach.

    Subscriber

Subscription Plans

Subscription Plans

STWR - Monthly

$19.95

Monthly subscription plan to Stock Trends Weekly Reporter - pay your monthly subscription fees by having them automatically charged (PayPal only). Free 7-day trial period. Subscribers may cancel before the end of any subscription month.

STWR - 1 Year Prepaid Subscription

$199.00

1 Year Prepaid subscription to Stock Trends Weekly Reporter. Save 16% off monthly rate!

STWR - 2 Year Prepaid Subscription

$299.00

2 Year Prepaid subscription to Stock Trends Weekly Reporter. Save 37% off monthly rate!

STWR - 3 Year Prepaid Subscription

$399.00

3 Year Prepaid subscription to Stock Trends Weekly Reporter. Save 44% off monthly rate!

Stock Trends Editorial

  • Stock Trends Inference Model: A Statistical Foundation for Smarter Investing
    Stock Trends Inference Model: A Statistical Foundation for Smarter Investing At the heart of Stock Trends is a conviction: market data is not noise, but information. For more than three decades, the Stock Trends framework has given investors a disciplined way to interpret market cycles, trend signals, and momentum patterns. The Stock Trends Inference Model (ST-IM) is the natural extension of this approach, embedding rigorous statistical reasoning into the reports available for every listed stock…
    Read more...
  • Technology Sector Split: Hardware & Chips vs. Software – A Deep Dive with Stock Trends
    Technology Sector Split: Hardware &amp; Chips vs. Software – A Deep Dive with Stock Trends The uncertain interest rate environment is evident in a number of sectors, and the stock market is always reflecting both the trend of the cost of capital and the anticipation of changes in it. The technology sector is especially sensitive to interest rates and generally feeds off the risk-on investor appetite supported by lower interest rates or expectations of relatively lower rates. But all technology…
    Read more...
  • Resource rotation remains strong
    Resource rotation remains strong The summer season is coming to a close. It is sometimes a sleepy market season because investor attention is elsewhere. However, the market has provided us with some definite messaging over the past few months. The themes of rotation and building strength in resources and energy stocks, notably fueled by an AI transformation across the broader economy, are key highlights that investors should pay attention…
    Read more...
View all Stock Trends Editorials


Subscription Plans

STWR - Monthly

$19.95/Month

Monthly subscription plan to Stock Trends Weekly Reporter - pay your monthly subscription fees by having them automatically charged (PayPal only). Free 7-day trial period. Subscribers may cancel before the end of any subscription month.

STWR - 1 Year Prepaid Subscription

$199/Year

1 Year Prepaid subscription to Stock Trends Weekly Reporter. Save 16% off monthly rate!

STWR - 2 Year Prepaid Subscription

$299/2 Years

2 Year Prepaid subscription to Stock Trends Weekly Reporter. Save 37% off monthly rate!

STWR - 3 Year Prepaid Subscription

$399/3 Years

3 Year Prepaid subscription to Stock Trends Weekly Reporter. Save 44% off monthly rate!