Variability of returns

  • 05 September 2013 |
  • Written by  Skot Kortje, Stock Trends Analyst
  • font size
  • Print

The Stock Trends inference model uses end-of-period returns, but there are other intra-period returns that should be recognized. This editorial looks at the variability of returns.

 An aspect of the Stock Trends statistical inference trading model is worthy of elaboration: the end-of-period measurement of returns. Returns are always expressed as a function of time, where time and its increments can be sliced and diced in a multitude of ways. But with each period of time, unless it is a period of extreme brevity, there are numerous market prices that mark transactions. Intra-period returns are variable with those prices.

I have chosen 4-week, 13-week and 40-week end-of-period returns as the statistic of measurement in our Stock Trends inference model. These, of course, are based on closing prices for each period. But what about all those prices in between? The path of a market price from a starting point to an ending point – notated as t and t+1 – is usually far from linear. This price variability is hard to overstate. Take a look at the high and the low price for any stock quotation. Trades at opposite ends of the price bar can result in entirely different returns, depending on the trade time frame.

Here’s a statistical look at the powerful effect of price variability: comparing the returns distribution of a Stock Trends indicator combination with returns measured not only by the period closing price, but also by period highs and period lows. In addition, we can compare another arbitrary price that approximates the return of other investors who traded the stock over the periods – the average price of the stock as defined by the average price of the intra-period weekly closing prices. We will see that there is always a range of returns possible with any trade, and depending on which returns we statistically measure those returns project quite different outcomes.
 
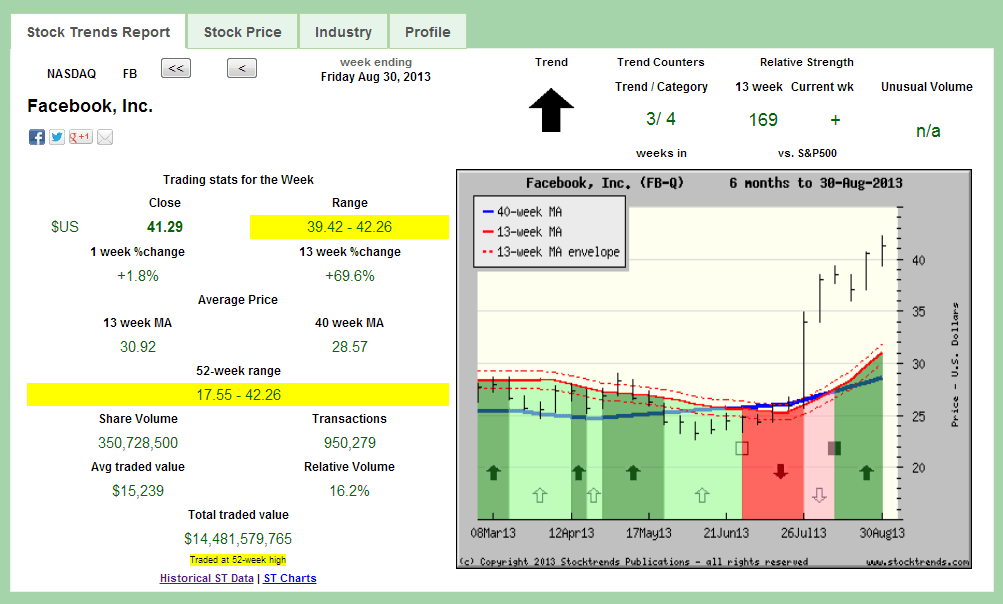
To illustrate this deviation of mean returns we’ll look at the statistical inference of the population mean of returns found in the stocks that share the same Stock Trends indicator combinations as Facebook, Inc. (FB-Q) at August 30.
 
 
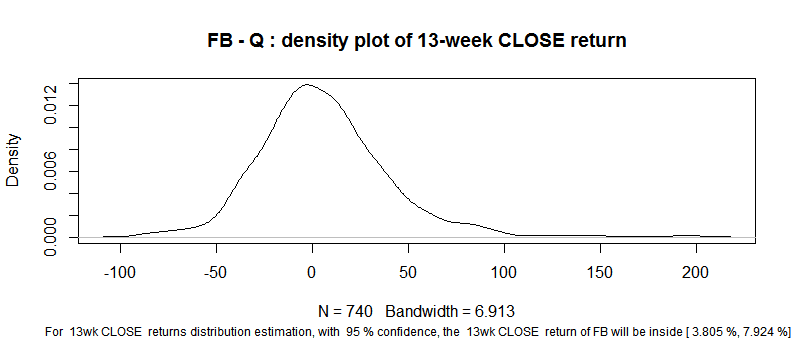
Focusing on the 13-week period ahead, the Stock Trends statistical inference model generates the following estimation of returns:
 
 
For  13wk CLOSE  mean (average) returns estimation, with  95 % confidence, the  13wk CLOSE  mean return of stocks with similar Stock Trends indicator combinations to FB’s will be inside [ 3.805 %, 7.924 %].
Mean return  5.86 and standard deviation of 34.01
Normal Distribution
For 13wk CLOSE P(R> 10)=45.16% probability that FB will return above 10%
For 13wk CLOSE P(R< -10)=32.05%  probability that FB will return below -10%
40.27% of sample returns are >10%
 
 
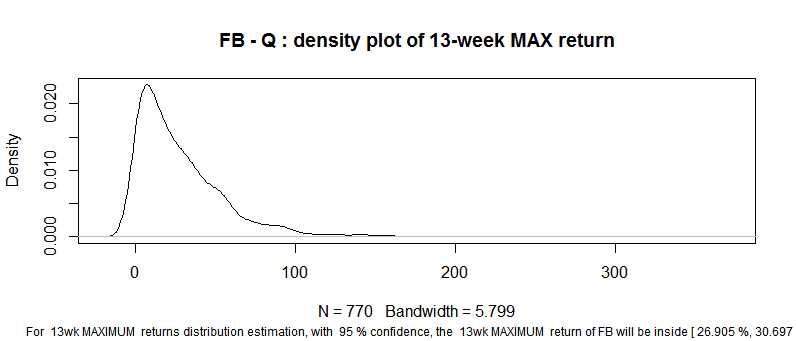
 For  13wk MAXIMUM  mean returns distribution estimation, with  95 % confidence, the  13wk MAXIMUM  mean return of stocks with similar Stock Trends indicator combinations to FB will be inside [ 26.905 %, 30.697 %].
Mean return  28.8 and standard deviation of 31.95
Normal Distribution
For 13wk MAXIMUM P(R> 10)=72.19% probability that FB will return above 10%
68.96% of sample returns are >10%
 
 
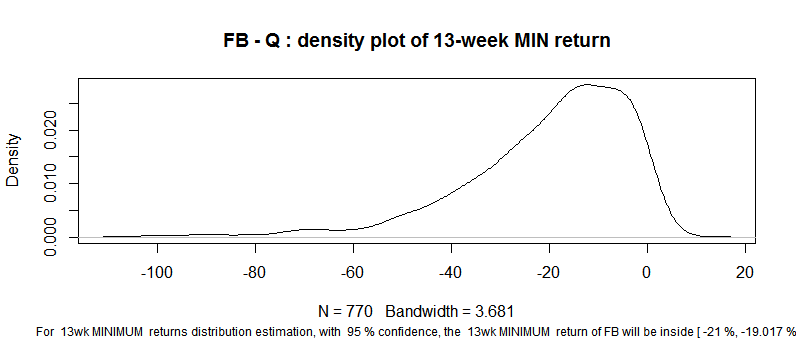
 For  13wk MINIMUM  mean returns distribution estimation, with  95 % confidence, the  13wk MINIMUM  mean return of stocks with similar Stock Trends indicator combinations as FB will be inside [ -21 %, -19.017 %].
 Mean return  -20.01 and standard deviation of 16.71
 Normal Distribution
 For 13wk MINIMUM P(R< -10)=72.54% probability that FB will return less than -10%
 31.04% of sample returns are >-10%
 
 
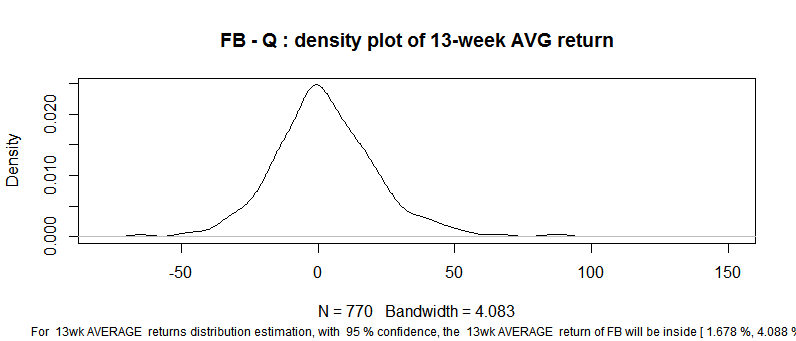
For  13wk AVERAGE  mean returns distribution estimation, with  95 % confidence, the  13wk AVERAGE  mean return of stocks with similar Stock Trends indicator combinations as FB will be inside [ 1.678 %, 4.088 %].
Mean return  2.88 and standard deviation of 20.3
Normal Distribution
 For 13wk AVG P(R> 10)=36.29% probability that FB will return above 10%
 Normal Distribution
 For 13wk AVG P(R< -10)=26.28% probability that FB will return below -10%
 30.65% of sample returns are >10%
 
 
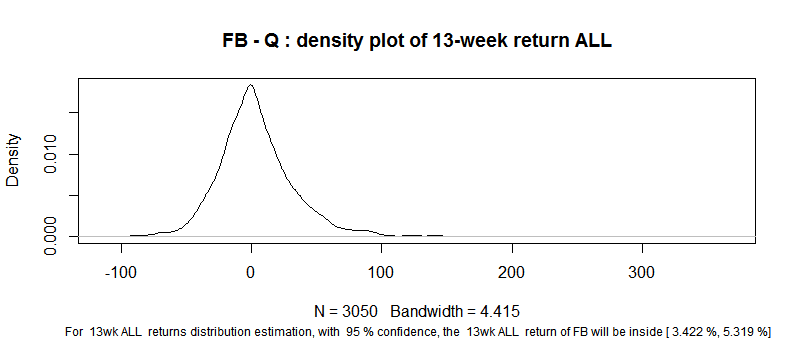
 For  13wk ALL  mean returns distribution estimation, with  95 % confidence, the  13wk ALL  mean return of stocks with the same indicator Stock Trends combination as FB will be inside [ 3.422 %, 5.319 %].
Mean return 4.37 and standard deviation of 31.83
Normal Distribution
For 13wk ALL P(R> 10)=42.98% probability that FB will return above 10%
For 13wk ALL P(R< -10)=32.58% probability that FB will return below -10%
34.92% of sample returns are >10%


The range of mean returns is quite large, making it clear that a trade’s returns depend on the type of trader. In this example, the mean return of traders who stuck with the trade until the end-of-period (13-weeks) exceeds the mean return of the population of traders that exited the trade at variable prices through the period, represented by the “All prices mean return”.
 
We looked at this variation of returns for two reasons: First, it’s important to identify the type of returns the Stock Trends inference model is measuring – end-of-period returns. During the periods Stock Trends measures – whether the 4-week period, the 13-week period, or the 40-week period – there is intra-period variability of prices that result in variable returns. The second reason for defining these variable returns is to show how the end-of-period returns rank against intra-period returns. Our analysis focuses on end-of-period returns because it is much easier to compare with other trading or investment models, but also because end-of-period returns compare favourably to aggregate intra-period returns. 
 
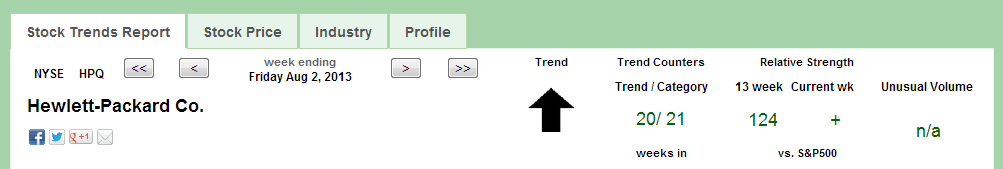
On that point, we can return to the fate of Hewlett Packard (HPQ) and Apple Inc (AAPL), featured in recent editorials outlining the Stock Trends inference model. Since the last editorial HPQ’s share price plummeted from $26.42 to the $22 level, while AAPL dropped marginally from $502.33 to sub-$500. Our model had presented a probable outcome for HPQ that exceeded that of AAPL. How does the model explain the actual results?
 
First of all, let’s make sure we are talking about the same returns. The Stocks Trends indicator combination for HPQ four weeks ago (August 2) was:
 
 
The 4-week end-of period mean returns for stocks with similar Stock Trends indicator combinations to HPQ at August 2 (4-weeks ago) was expressed as a confidence interval between 0.8% and 1.9%.  Further, a normal distribution of returns around this interval indicated that there was a 17.4% chance that HPQ would drop 10% or more below the August 2nd share price 4-weeks later. Indeed, the share price did close out August down 17% (coincidentally the same value as the probability). In short, there is always a chance that a stock will perform outside an expected range. In this case, HPQ closed the 4-week period outside its expected range. Traders must learn how to quantify this risk and protect against it.
 
back to top

Subscriber Testimonials

  • An admitted cynic, it's obviously very high praise when he says he likes StockTrends because of its "simplicity, utility, openness, [and] honesty," and in addition to having "no hidden agenda" is "understandably documented [and] historically verifiable." And, he adds, "It lets me see a lot of things without doing a lot of work." Globe and Mail

    Paul W., Subscriber

  • Stock Trends information is part of the base information I review before making a trade.

    Subscriber
  • Stock Trends analysis quantifies nicely the movement of individual stocks. I’ve found that if the technicals are out of synch with fundamental analysis, it is a wake-up call to make a decision. The Stock Trends Bull/Bear Ratio is useful in identifying major market bottoms and tops. It has always presented a good buying or selling opportunity.

    Charles G., Subscriber
  • Thank you for your excellent work and kind approach to your customers.

    Odette C., Subscriber

  • I want to thank you for posting such an excellent guide to technical analysis on the web. You have provided a great service to all of us novice investors.

    Michael C., Stock Trends user
  • I am something of a momentum investor. I find Stock Trends useful as I can look at my portfolio as a “watch list” and quickly see where trends are declining in strength or reversing, so it is particularly useful as a tool in portfolio management regarding sales.

    William C., Subscriber
  • I have had the good fortune to be reasonably successful and enjoy the investment process. Your process would be recommended for both experts and those who are new to investing.

    Frank I., Subscriber
  • I find your website and research very helpful in my stock trading. I have subscribed to several related services in the past and none present their work with “just the facts” as you. Please keep up the great work so that I can continue to learn! 

    Bryan E., Subscriber
  • I use Stock Trends to help direct my stock picks. Also, following the advice of Stock Trends I have religiously used stop-loss orders and have avoided hanging on to losing stocks for emotional reasons.

    John B., Subscriber
  • I very much like the systematic approach to analyzing stock data, it fits my approach.

    Subscriber
  • I am fascinated with your service and methodology - it is very impressive. [...] Over the years I have concluded that there are many ways to approach stock investing, but once one has chosen a path, one is better off sticking to it.

    Bob E., Subscriber

  • I am just writing to tell you of my appreciation of your service! It makes so much sense to me. You seem to be an oasis of stability and sensibility in a stockmarket jungle.

    Adrian S., Subscriber

  • Stock Trends Weekly Reporter is an easy way to pick up equities that represent an upward trend.

    Subscriber
  • You have created and maintained an amazing, highly educational program and I am grateful for your part in getting our retirement funds to the good place they are.

    Karin M., Subscriber
  • There is a lot to be gained from comparing trends of how individual stocks are doing within a sector, as well as how the sector is performing relative to the broad market.

    Dudley R., Subscriber

  • Just thought I'd call to thank you, Skot. Stock Trends Weekly Reporter helped pay for my daughter's education!

    Peter H., Subscriber

  • Hence, anyone who had followed the "Stock Trends" line should have sold their Bre-X shares and, with the windfall, paid for a lifetime subscription to The Globe and Mail and more. Talk about return on investment!

    Muni P., Subscriber

  • I've followed a number of Stock Trends picks, and the methodology is solid.

    Doug B., Subscriber

  • I've followed your recommendations since reading your columns in the Globe & Mail, and finding they published Stock Trends arrows in their financial listings. I do find them a guide to the general market and what I should be avoiding for declining chart trends.
    Has probably saved me the subscription by not rushing into hot stocks!

    Anthony D., Subscriber
  • Your report is an impressive, excellent tool and I have recommmended it to friends.

    Colin E., Subscriber

Subscription Plans

Subscription Plans

STWR - Monthly

$19.95

Monthly subscription plan to Stock Trends Weekly Reporter - pay your monthly subscription fees by having them automatically charged (PayPal only). Free 7-day trial period. Subscribers may cancel before the end of any subscription month.

STWR - 1 Year Prepaid Subscription

$199.00

1 Year Prepaid subscription to Stock Trends Weekly Reporter. Save 16% off monthly rate!

STWR - 2 Year Prepaid Subscription

$299.00

2 Year Prepaid subscription to Stock Trends Weekly Reporter. Save 37% off monthly rate!

STWR - 3 Year Prepaid Subscription

$399.00

3 Year Prepaid subscription to Stock Trends Weekly Reporter. Save 44% off monthly rate!

Stock Trends Editorial

  • Stock Trends Gauge of Investor Sentiment: A Market at the Crossroads of Renewal
    Stock Trends Gauge of Investor Sentiment: A Market at the Crossroads of Renewal The Stock Trends Gauge of Investor Sentiment has long served as a vital compass for interpreting the emotional currents that drive markets. By measuring the distribution of Bullish and Bearish Stock Trends indicators across all New York Stock Exchange issues, this gauge transforms the abstract notion of “market mood” into a quantifiable, observable pattern of investor behavior. Over the past two decades, it has proven…
    Read more...
  • Stock Trends Picks Confirm Emerging Bullish Leadership
    Stock Trends Picks Confirm Emerging Bullish Leadership There are weeks when the language of the market becomes unmistakable, even before it is broadly understood. The first week of October 2025 feels like such a moment. In the latest Stock Trends Picks of the Week, we observe not the frenzy of a mature bull market but something quieter, more deliberate — a low hum of recovery taking shape across the intricate lattice of…
    Read more...
  • Stock Trends Select Bullish Crossover Portfolio
    Stock Trends Select Bullish Crossover Portfolio The Select Bullish Crossover Portfolio strategy stands at the intersection of systematic inference and market timing. Each position is chosen from the Stock Trends Inference Model’s Select list—names whose probability of outperforming the base random return is favorable across 4, 13, and 40 weeks. From this foundation, the portfolio then isolates Bullish Crossover () signals, capturing securities that have transitioned from neutral or bearish states into…
    Read more...
  • Stocks Highlighted in Fall 2025 Trends
    Stocks Highlighted in Fall 2025 Trends Stock Trends Weekly Reporter highlights two powerful themes this week: Leadership Momentum — stocks in entrenched Bullish states with sustained outperformance — and Volume-Validated Bullish — stocks in Bullish categories attracting unusual accumulation. Together, these lists showcase the names that momentum metrics are backing, and where retail traders can align with strength.
    Read more...
View all Stock Trends Editorials


Subscription Plans

STWR - Monthly

$19.95/Month

Monthly subscription plan to Stock Trends Weekly Reporter - pay your monthly subscription fees by having them automatically charged (PayPal only). Free 7-day trial period. Subscribers may cancel before the end of any subscription month.

STWR - 1 Year Prepaid Subscription

$199/Year

1 Year Prepaid subscription to Stock Trends Weekly Reporter. Save 16% off monthly rate!

STWR - 2 Year Prepaid Subscription

$299/2 Years

2 Year Prepaid subscription to Stock Trends Weekly Reporter. Save 37% off monthly rate!

STWR - 3 Year Prepaid Subscription

$399/3 Years

3 Year Prepaid subscription to Stock Trends Weekly Reporter. Save 44% off monthly rate!