
A Bullish stock is not the same thing as a broadly Bullish market. A leading sector is not necessarily strengthening. A favorable historical return distribution is not a forecast. And a market environment that resembles a persistent Bullish structure can still contain weakening participation beneath the surface.
Those distinctions are becoming increasingly important because investment research is no longer consumed only by people looking at charts and tables. The same evidence can now be queried by portfolio systems, software applications and AI agents capable of combining thousands of observations in seconds.
That makes the quality of the underlying market intelligence more important, not less. Before a machine can reason about a market, the data must make clear what is being measured, which population it describes, when it was observed and what can legitimately be inferred from it.
One Market, Several Different Questions
The Stock Trends data for the week ending October 2, 2026 offers a useful example.
At the broadest directional level, 51.67% of the 7,562 classified U.S. and Canadian equities in the current canonical market population occupied Bullish trend families. That produced a modestly positive regime score of +0.0333, but not enough directional separation to move the market out of its Mixed regime.
Look at the market through a different lens, however, and the picture changes.
Among the 5,852 classified equities represented in the default mapped sector population, only 48.99% were in Bullish families. There were 2,867 Bullish observations compared with 2,985 Bearish observations. That was a small Bearish majority.
Yet the Stock Trends Market Epoch model continued to classify the broader structural environment as Broad Bullish, a state that had persisted for 17 consecutive weeks.
| October 2 measure | Reading | What it tells us |
|---|---|---|
| Market regime | Mixed, 51.67% Bullish | Directional participation retains a modest Bullish majority |
| Mapped sector breadth | 48.99% Bullish | The covered sector population has slipped to a slight Bearish majority |
| Market Epoch | Broad Bullish, 17 weeks | The market still resembles a persistent recurring Bullish structural state |
None of these observations contradicts the others. They answer different questions.
The regime measures directional participation across the classified equity population. Sector breadth asks how that participation is distributed through a mapped subset of the market. Epoch asks whether the market's broader combination of participation, trend persistence and relative performance resembles a recurring historical structure.
Flattening those measurements into one label such as “the market is Bullish” would discard much of the useful information.
The Market Has Been Losing Participation
The distinction becomes more meaningful when we look at the recent path rather than the October 2 snapshot alone.
Using the same mapped sector scope each week, Bullish participation has declined steadily over the past four observations:
| Week | Bullish | Bearish | Classified mapped equities | Bullish share |
|---|---|---|---|---|
| September 11 | 2,997 | 2,792 | 5,789 | 51.77% |
| September 18 | 2,983 | 2,835 | 5,818 | 51.27% |
| September 25 | 2,945 | 2,908 | 5,853 | 50.32% |
| October 2 | 2,867 | 2,985 | 5,852 | 48.99% |
That is a decline of 2.78 percentage points in three weeks.
The population is not a perfectly fixed cohort from week to week, so the table should not be interpreted as proof that exactly the same securities deteriorated. But the cross-sectional change is clear enough to establish the direction of participation.
This extends the central observation from our September editorial, The Indexes Have Confirmed. The Market Beneath Them Has Not. Broad confirmation and broad participation are two different things. The October data adds another dimension: even while participation has weakened, the longer-lived structural characteristics captured by the Epoch model have remained persistent.
Leadership Does Not Mean Everything Is Improving
The sector data provides another example of why context matters.
| Sector | Bullish | Bearish | Bullish share | Leadership rank |
|---|---|---|---|---|
| Finance | 653 | 376 | 63.46% | 1 |
| Energy | 220 | 168 | 56.70% | 2 |
| Technology | 369 | 359 | 50.69% | 3 |
| Real Estate | 133 | 124 | 51.75% | 4 |
| Healthcare | 482 | 535 | 47.39% | 5 |
| Industrials | 355 | 397 | 47.21% | 6 |
| Materials | 152 | 282 | 35.02% | 10 |
| Utilities | 37 | 91 | 28.91% | 11 |
Finance remains the strongest sector by the current Stock Trends leadership ranking, with almost two-thirds of its classified mapped equities in Bullish trend families. Energy follows. Technology ranks third, but its participation is almost evenly divided between Bullish and Bearish stocks.
There is an additional subtlety. Technology improved from fourth place to third place in the four-week leadership ranking even though its composite leadership score declined. Finance remained first while its own score and Bullish participation also weakened.
Relative rank and absolute improvement are therefore not interchangeable.
A sector can move higher in the rankings because conditions elsewhere have deteriorated faster. That is very different from saying that the sector itself is strengthening.
From Market Structure to an Individual Security
This is where the Stock Trends analytical framework becomes particularly useful. The market-level observations establish context, but they do not eliminate individual opportunities.
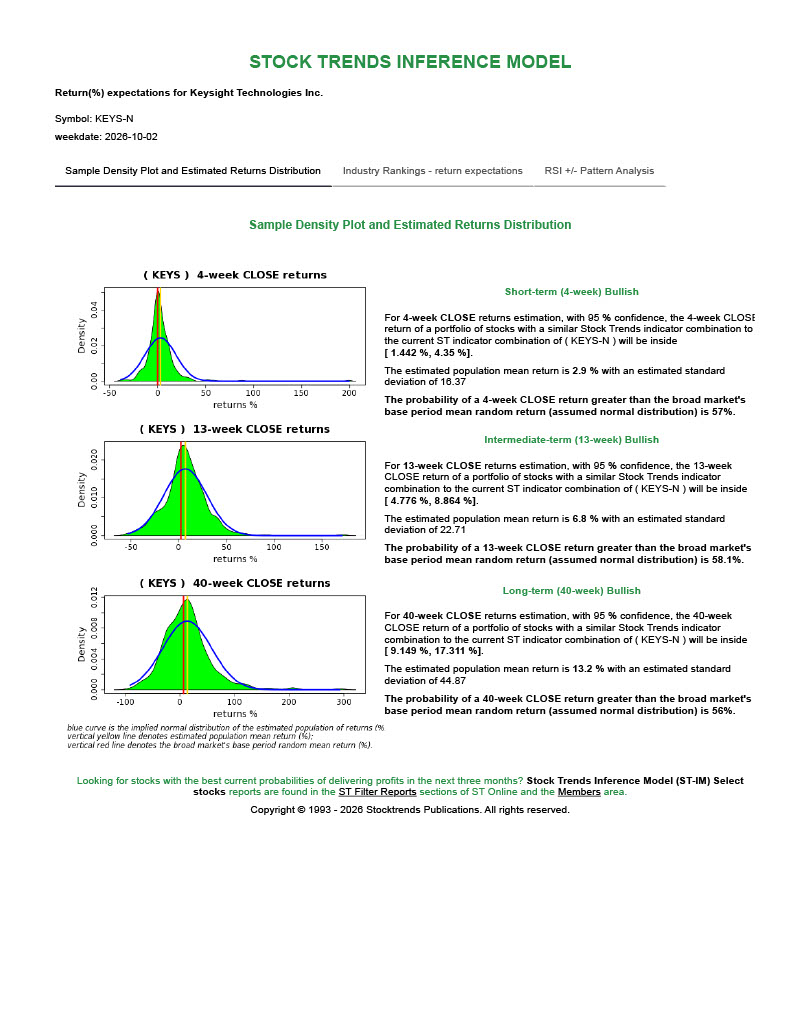
Keysight Technologies Inc. (KEYS) provides a current example.
For the week ending October 2, Keysight was classified Bullish (^+). Its specific Bullish trend had persisted for five weeks, while its major-trend counter had reached 63 weeks. Its Stock Trends RSI had risen from 94 on September 11 to 119 on October 2, and its trailing 13-week price change was +22.6%.
This was improving individual relative performance inside a Technology sector whose aggregate Bullish participation was only 50.69%.
Trend classification tells us what the security is doing. The Stock Trends Inference Model, or ST-IM, asks another question: what happened historically after comparable Stock Trends configurations?
| Horizon | Estimated mean return | Confidence bounds for mean | Standard deviation | Reference mean |
|---|---|---|---|---|
| 4 weeks | 2.92% | 1.19% to 4.64% | 16.35% | 0.00% |
| 13 weeks | 6.82% | 4.40% to 9.24% | 22.65% | 2.19% |
| 40 weeks | 13.49% | 8.64% to 18.34% | 44.72% | 6.45% |
At all three horizons, the lower confidence bound for the estimated mean exceeds the applicable historical reference mean. At 13 weeks, the model calculates a 58.10% probability of exceeding the fixed 2.19% reference mean.
That number requires careful interpretation.
It does not mean Keysight has a 58.10% probability of rising. It is not a 58.10% probability that the investment will outperform an index. And the confidence interval around the estimated mean is not a predicted trading range for Keysight over the next 13 weeks.
Instead, it describes the historical distribution associated with the current classified configuration, under the model's assumptions.
The dispersion matters. The 13-week standard deviation for the historical sample is 22.65%, considerably wider than the confidence interval around the estimated mean. That distinction is precisely why a probability model is more informative than simply quoting an expected return.
A Favorable Stock Inside an Incomplete Market Confirmation
Stock Trends' deterministic symbol evaluation adds another layer.
For Keysight, the current evaluation reports a Bullish bias with moderate confidence, but only neutral market alignment. The decision score is 0.4667.
Again, semantics matter. A decision score of 0.4667 is not a 46.67% probability of investment success. The score synthesizes defined signal and market-regime relationships. The separate ST-IM calculation supplies the conditional historical return distribution.
Nor does the evaluator automatically transform every Stock Trends measure into one giant score. Sector participation and the Broad Bullish Epoch are additional pieces of context used in this research process.
The resulting interpretation is more useful because it preserves the disagreement:
- Keysight's individual trend configuration is Bullish and strengthening.
- Its historical ST-IM configuration produces favorable mean-return characteristics.
- Technology sector participation is almost evenly divided.
- Whole-market directional participation remains Mixed.
- The broader recurring structural environment remains a persistent Broad Bullish Epoch.
That does not produce a mechanical buy signal. It produces a research conclusion: Keysight merits further attention because its individual evidence is favorable, while broader participation provides only partial confirmation.
Why Historical Context Is More Than a Backtest
Stock Trends has been converting price and volume observations into structured classifications for decades. Classification history extends back to 1980, systematic weekly publication began in 1993, and the current database contains millions of structured weekly observations.
The value of that history is not simply its length. It is the ability to compare observations using a consistent analytical vocabulary.
Trend states, trend counters, relative performance, volume conditions and forward outcomes can be represented as variables rather than retrospective chart descriptions. That makes it possible to ask whether apparently similar securities really were observed under similar conditions.
The Market Epoch project extends that idea to the market environment itself.
The current production Epoch model uses six aggregate features describing Bullish participation, Bullish and Bearish major-trend persistence, specific-trend persistence and median Stock Trends relative performance. It separates historical observations into three recurring structural states: Broad Bullish, Bearish Maturity and Bullish Maturity.
This does not mean an Epoch label predicts what comes next. A 17-week-old Broad Bullish Epoch does not imply that the market must continue higher, nor does maturity imply an imminent reversal.
The research value is comparability.
A Bullish stock observed when participation is expanding across the market may represent a different research case from the same Stock Trends configuration observed when participation is narrowing. Epoch provides another way to distinguish those environments before studying how strategies behaved within them.
What the Historical Outcomes Actually Say
One advantage of making investment intelligence inspectable is that favorable model outputs can also be tested against realized outcomes.
The current public historical summary for mature ST-IM Select observations covers data from March 2016 through February 2026:
| Horizon | Mature observations | Mean realized return | Reference mean | Rate exceeding reference mean |
|---|---|---|---|---|
| 4 weeks | 156,868 | 0.72% | 0.00% | 51.5% |
| 13 weeks | 156,889 | 2.68% | 2.19% | 46.7% |
| 40 weeks | 139,743 | 6.80% | 6.45% | 43.0% |
The realized mean return exceeded the fixed reference mean at all three horizons. But the proportion of individual observations exceeding those reference means was below 50% at both 13 and 40 weeks.
That is not a contradiction. Return distributions can be affected materially by the size of gains and losses, not simply by how often a threshold is crossed.
It also illustrates why modeled probability should not be presented as an empirically proven win rate. These observations include overlapping weekly samples and are not equivalent to independent portfolio trades. The evidence does not, by itself, establish risk-adjusted or implementable portfolio alpha.
For Stock Trends, those are not inconvenient qualifications. They are part of the intelligence.
From a Weekly Report to a Machine-Readable Research Process
For many years, investors have consumed Stock Trends information through the Stock Trends Weekly Reporter, individual Stock Trends Reports, trend summaries, filters and portfolio tools.
The analytical process behind those products can now also be accessed programmatically through the Stock Trends API.
That changes the delivery mechanism more than the underlying investment questions.
A program can now reproduce a research sequence such as:
GET /v1/market/regime/latest
GET /v1/market/epoch/latest
GET /v1/breadth/sector/latest
GET /v1/leadership/rotation/history
GET /v1/selections/published/latest
GET /v1/indicators/latest?symbol_exchange=KEYS-N
GET /v1/stim/latest?symbol_exchange=KEYS-N
POST /v1/decision/evaluate-symbol
The important feature of this sequence is not that an API can return numbers. Financial markets already contain more numbers than any investor can reasonably consume.
The value lies in the relationships between them.
The same security identifier can connect current trend classification to historical trend observations, conditional return distributions, sector participation, leadership, market regime and structural market context. Dates, populations, units and methodology can travel with the observations.
This makes a research process reproducible.
For this week's analysis, for example, the intended 55% ST-IM Select probability threshold was explicitly applied, instrument types were independently validated, observation dates were matched and sector coverage was preserved rather than silently treating different populations as equivalent.
Those may sound like technical details. They are actually investment-research controls.
Why This Matters More in an AI Market
An investor reading a table can notice that two percentages use different denominators. A competent analyst can recognize that a confidence interval for a mean is not an individual prediction interval. A portfolio manager can question whether a leadership rank improved because the leader became stronger or because competitors became weaker.
An AI agent needs those distinctions encoded explicitly.
Otherwise, the speed of machine reasoning can become a liability. An agent can combine incompatible populations, treat related measurements as independent confirmation, confuse a modeled probability with an empirical hit rate, or convert a descriptive market state into a forecast, all at machine speed.
This is why the development of Stock Trends market intelligence has increasingly focused on semantic structure as well as data access.
An AI system needs to know not only that the market is 51.67% Bullish, but which instruments entered that calculation. It needs to know that 48.99% sector breadth refers to a mapped subset rather than the identical population. It needs to distinguish an Epoch classification from a forecast and an ST-IM probability from a decision score.
Structured evidence gives the machine something a confident narrative alone cannot provide: a reasoning trail that can be inspected.
Building Toward Stock Trends Intelligence
The Stock Trends Intelligence Agent project is an extension of that architecture.
The objective is not to ask a language model to look at some financial data and invent a market opinion. It is to give a reasoning system access to defined Stock Trends evidence, methodology and historical context, then require it to preserve the meaning and provenance of that evidence as it develops a research conclusion.
That work is still being completed and validated. The published intelligence service should therefore not be confused with the analytical capabilities already available through the Stock Trends data and API.
The longer-term direction, however, is important.
The same validated analytical foundation can support several forms of consumption: an investor reading a Stock Trends editorial, a portfolio manager evaluating exposures, a developer constructing an application, or an AI agent assembling a research thesis.
Different interfaces. The same underlying market evidence.
Market Intelligence Begins With Context
There is a temptation in financial markets to search for the one indicator that provides the answer.
This week's Stock Trends data demonstrates why that is usually the wrong objective.
The October 2 market can simultaneously contain a persistent Broad Bullish structural state, a Mixed directional regime, declining mapped participation, strong Finance leadership and individual Technology stocks with favorable trend and probability characteristics.
The useful information is not found by forcing those observations to agree.
It is found by understanding why they differ.
For investors, that produces a more disciplined research process. Identify the security's condition. Measure participation around it. Determine where leadership resides. Examine the historical distribution associated with the configuration. Place the observation in a broader market structure. Then identify which evidence confirms the thesis and which evidence limits it.
For software and AI agents, the requirement is exactly the same, only more explicit.
That is the transition Stock Trends is now making: from publishing market trends to making decades of structured trend analysis available as inspectable market intelligence.
The objective is not to make the market simpler than it is. It is to make the evidence structured enough that investors, portfolio managers, developers and machines can reason about its complexity consistently.
Related items
- Stock Trends Mid-Quarter Review: How the Year-End 2025 Themes Are Performing in Q1 2026
- Stock Trends Year-End Analysis: Institutional Momentum, ST-IM Alpha, and the Road Into Q1 2026
- Understanding Our Assumptions — A Decade Later
- Trading Nvidia with the Stock Trends RSI +/– Pattern Analysis Model
- Navigating Market Turmoil in December 2025 – How Stock Trends Guides Investors
 I find your website and research very helpful in my stock trading. I have subscribed to several related services in the past and none present their work with “just the facts” as you. Please keep up the great work so that I can continue to learn!