The Dow Jones Industrials Bullish Crossover Portfolio

  • 19 January 2012 |
  • Written by  Skot Kortje, Stock Trends Analyst
  • font size
  • Print

A trend-following trading system can be both simple and profitable. The Dow Jones Industrials Bullish Crossover Portfolio is just one example of how long-term investors can use the Stock Trends indicators.

The Stock Trends Bullish Crossover () and Bearish Crossover () are key signals that a long-term price trend has changed, but for many investors these moving average indicators appear to be too lagging current market prices to generate trading success. Indeed, the premise of trend analysis is that moving average market timing buy signals forgo early price movement in order to definitively categorize a new price trend, and that trade exit markers provided by moving averages are well behind price action trade exits – a dual handicap that some investors would find intolerable.

However, the best way to challenge these misgivings is to produce a trading record that substantiates an ongoing trading plan employing moving average crossovers as both buy and sell signals. Long-term investment returns achieved when using the Stock Trends Bullish and Bearish Crossovers indicators ( and ) will surprise sceptics.

The most well-known subset of the North American stock market is the Dow Jones Industrials. The 30 stocks that currently comprise this benchmark index are large capitalization, blue chip companies – many multinational – that cover a broader spectrum of the economy than the ‘industrials’ misnomer suggests. Although large cap stocks have a tendency toward lower price momentum than small- and mid-cap stocks, they do exhibit strong trend tendencies and lower volatility relative to the broader market. They are also supported by institutional demand dictated by their status as components of this important index. It is no wonder they are typically held by conservative investors wired into the changing fundamentals affecting the valuations of these companies.
 
In contrast, Stock Trends mechanical trading strategies dispense with the storylines of fundamental analysis and engage in a very simple but methodical application of trend line market timing. The Dow Jones Industrials Bullish Crossover Portfolio shows how simple trend-following trading strategy can be – and how the long-term returns the strategy generates are better than the market benchmark.
 
The Dow Jones Industrials Bullish Crossover Portfolio trading strategy:
BUY a component stock of the Dow Jones Industrials index when:
tagged with a “Bullish Crossover indicator
SELL a stock when:
tagged with a “Bearish Crossover indicator


* This strategy has been applied on the stock history of the 30 current (December 31, 2011) members of the Dow Jones Industrial Index. It does not replicate this strategy on the historical components of the index. Changes to the index in the last decade, for example, brought in new membership for stocks such as Cisco Systems, Bank of America, The Travelers Cos., Kraft Foods Inc., Chevron, Pfizer Inc., and Verizon Communications Inc. See Historical Components of the Dow Jones Industrial Index. The portfolio will make adjustments going forward for changes in the constituents of the Dow Jones Industrials index.
 
Current components of the Dow Jones Industrials Index:
 
  Stock Symbol     Stock Symbol
1 ALCOA INC AA   16 JP MORGAN CHASE CO JPM
2 AMERICAN EXPRESS INC AXP   17 KRAFT FOODS INC KFT
3 BOEING CO BA   18 COCA-COLA CO THE KO
4 BANK OF AMERICA BAC   19 MCDONALDS CORP MCD
5 CATERPILLAR INC CAT   20 3M COMPANY MMM
6 CISCO SYSTEMS CSCO   21 MERCK CO INC MRK
7 CHEVRON CORP CVX   22 MICROSOFT CORP MSFT
8 DU PONT E I DE NEMOURS DD   23 PFIZER INC PFE
9 WALT DISNEY CO DIS   24 PROCTER GAMBLE CO PG
10 GENERAL ELECTRIC CO GE   25 AT&T INC. T
11 HOME DEPOT INC HD   26 TRAVELERS CO TRV
12 HEWLETT PACKARD CO HPQ   27 UNITED TECHNOLOGIES UTX
13 INTL BUSINESS MACHINES IBM   28 VERIZON COMMUNICATIONS VZ
14 INTEL CORP INTC   29 WAL-MART STORES INC WMT
15 JOHNSON & JOHNSON JNJ   30 EXXON MOBIL CORP XOM
 

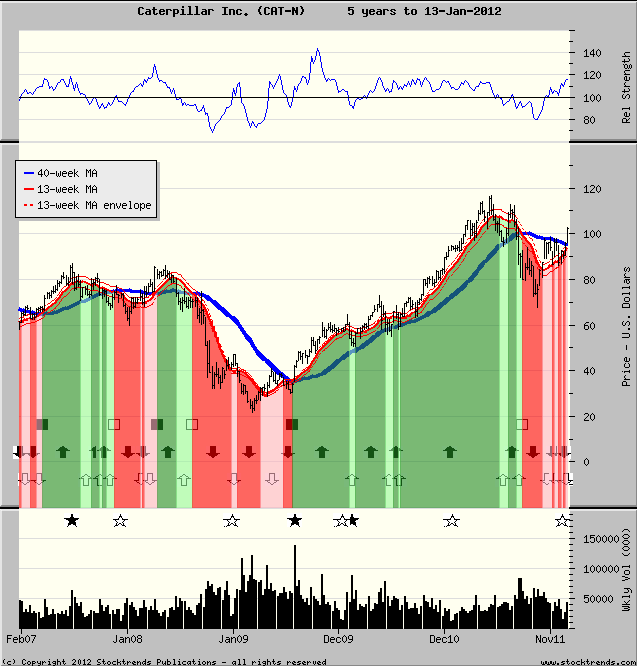
An example of this trading strategy at work

The following Stock Trends chart shows the changing trend indicators over the 5-year period from early 2007 for Caterpillar Inc. (CAT-N). It depicts three Stock Trends Bullish trend categories - all introduced by a Bullish Crossover indicator ( ) and closed by a Bearish Crossover indicator ( ). These bullish trend periods are illustrated by the green areas underneath the bar graph of the stock's weekly price. In this time period, the first Bullish trend buy for Caterpillar's stock (CAT) was on April 13, 2007 at $66.79. The stock was sold at its Bearish Crossover on December 7, 2007 at $74.20 for a trade gain of 8.9% (all returns are net of the trading system's defined transaction costs). The second position taken in CAT was at its Bullish Crossover on April 25, 2008 at $82.25. This holding was sold with the Bearish Crossover indicator of August 22, 2008 at $70.27 for a trade loss of 16.3% - quite indicative of the difficult market conditions during the unfolding financial crisis of 2008. The final bullish trend of the illustrated period is much more rewarding. The stock's Bullish Crossover on July 17, 2009 signaled another buy at $33.99 and ushered in a strong uptrend that peaked at $116.55, eventually slipping back to a bearish trend 109 weeks later. The Bearish Crossover sell signal on August 19, 2011 at $79.97 earned the position a handsome 131% return.


The money management rules for the portfolio are as follows:

Exposure on each position is limited to $10,000. Although the average number of positions held since 1981 is 17, the strategy could potentially require holdings of all 30 stocks at one time. Conversely, the system will not hold many stocks at all in bearish markets. During bear markets of this trading record, the portfolio holdings fell to an average of 5 or 6, while the most active year (1997) the average number of stock held by the portfolio was 26.

Transaction costs are factored into the cost of purchases and the net proceeds of sales at 1% in and 1% out, or 2% commission on a round trip.
 

Applying this very simple trading system on the Stock Trends 31-year historical data of current components of the Dow Jones Industrials generates the following results:


The three decade trading record has produced positive relative returns. The annualized return on average capital invested is 15.9%, better than the 7.4% compound annual growth rate of the benchmark S&P 500 index over the same period. However, recent relative performance of this trading system reveals the difficult period the system has encountered over the past decade.
 
As the table below shows, the 2000s have not been a great time for trending stocks. Compared to its impressive returns of the 1990s, the DJ Industrials Bullish Crossover Portfolio trading strategy performance of late has not been strong. But compared to the negative returns of the overall stock market - the S&P 500 index was down 24% in the decade ended December 31, 2009, with a compound annual growth rate of -2.7% - the portfolio's -2.6% annualized return over the dismal first decade of the millennium rates as satisfactory.
 
The ten-year return prior to 2000, though, showed much more promise for this trend-following trading system. The DJ Bullish Crossover Portfolio enjoyed an annualized return on average invested capital of 32.3%. Comparatively, the S&P 500 index had a compound annual growth rate of 15.3% during the same decade.
 
DJ Industrials Bullish Crossover Portfolio strategy Performance - 1981 to 2011:
      % Returns
Year

Average

 Invested 

Capital

Net

Gain/(Loss)

ST

Portfolio*

S&P 500

Index

Difference
Since inception
31.1 years
Jan 1/1981 to Dec 31/ 2011
$ 171,916 $ 844,890 +15.9%
p.a.
+7.4%
p.a.
+8.5%
p.a.
2011 191,509 -16,287 -8.5 0.0 -8.5
2010 205,283 11,673 5.7 12.8 -7.1
2009 134,340 59,490 45.4 29.1 16.3
2008 67,547 -40,835 -59.3 -41.0 -18.3
2007 230,189 28,957 12.5 4.2 8.3
2006 203,585 23,574 11.7 13.6 -1.9
2005 156,038 -11,506 -7.4 3.0 -10.4
2004 199,811 3,099 1.6 10.4 -8.8
2003 185,283 41,862 22.7 25.2 -2.5
2002 95,660 -34,992 -36.3 -24.6 -11.7
2001 107,925 -36,875 -34.1 -12.1 -22.0
2000 129,245 -75,064 -58.1 -10.1 -48.0
1999 216,226 140,505 64.5 19.5 45.0
1998 195,283 115,399 59.1 31.0 28.1
1997 257,925 88,549 34.2 23.7 10.5
1996 239,245 103,473 43.4 22.9 20.5
1995 243,019 107,789 44.3 34.1 10.2
1994 159,057 -147 -0.1 -1.5 1.4
1993 166,981 5,114 3.1 7.1 -4.0
1992 183,396 9,184 5.0 8.2 -3.2
1991 186,415 71,615 38.2 23.7 14.5
1990 153,019 -2,212 -1.4 -7.0 5.6
1989 238,868 101,415 42.4 27.3 15.1
1988 120,755 -3,917 -3.3 12.4 -15.7
1987 200,377 -5,475 -2.7 2.1 -4.8
1986 199,245 62,940 31.4 17.8 13.6
1985 180,755 44,764 24.9 26.1 -1.2
1984 102,264 -29,285 -29.0 0.8 -29.8
1983 191,132 47,492 24.7 17.3 7.4
1982 133,962 48,723 36.8 14.8 22.0
1981 53,585 -4,535 -8.5 -10.1 1.6

* ST portfolio annual returns are based on average invested capital for the year.


Tough times in the new millennium

  % Returns
Year 1-year 2-year 3-year 5-year 10-year
Dec 31, 2011 -8.5 -1.2 9.6 4.9 3.7
Dec 31, 2009 40.8 12.8 10.4 7.8 -2.6
Dec 31, 1999 64.5 57.7 51.7 48.1 32.3

 * ST portfolio annual returns are based on average invested capital for the year.


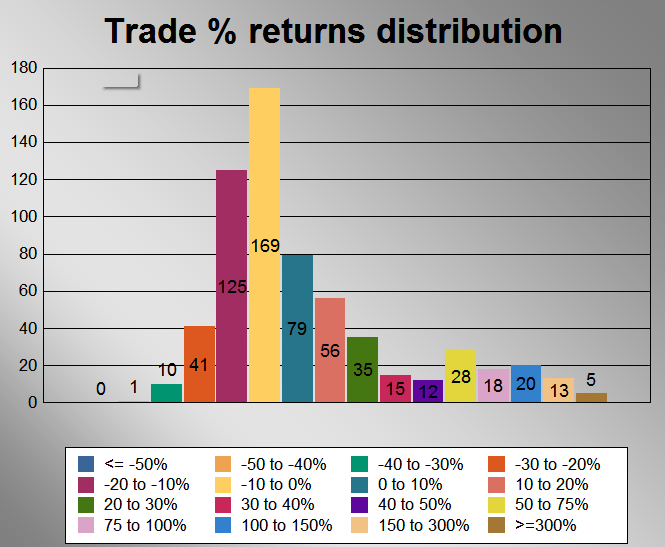
Returns on invested capital are a good measure of long-term performance of a trading strategy, but the statistics revealed by the trade history are a good metric of how those results were achieved. The distribution of returns of the 620 positions closed before December 31, 2011 shows that the majority of trades returned between -20% and +10%. Profitable trades were 42% of all positions - below 50%, but typical of many successful market timing trading systems. The trading system's Profit Factor of 3.1, though, reveals the strength of the trading strategy. It measures the the relative $ gains of winning trades versus the relative $ losses of losing trades. Average gains per winning position are over three times higher than the average losses per losing trades. This characteristic allows the system to generate positive returns over the long-term, even though most trades are losing trades. Because expectations of high probablity trading (expecting that a trade signal will ALWAYS be right) should always be tempered by actual results, active traders must always seek to achieve a trading record with a relatively high Profit Factor. This trading strategy scores well on that measure.

Trading Statistics

 
Total # of (completed) positions taken: 620
# of winning positions (winning %): 359 (42.1%)
Average gain(%) per winning position: 48%
Average loss(%) per losing position: 11%
Profit factor**: 3.1
Maximum gain(%) on a position: 570%
Maximum loss(%): -45%
Annualized return on average invested capital: 15.8%
Average invested capital: $171,916
Average # of positions held: 17
Average # of weeks invested in each position: 44

* all trading stats compiled at December 31, 2011 on closed positions

 **Profit Factor = (% of winning trades X average $ gains on winning trades) / ABSOLUTE VALUE[(% of losing trades X average $ losses on losing trades)]


The current Dow Jones Industrials Bullish Crossover Portfolio report is published weekly. It shows current holdings, as well as current buy and sell transactions. Investors can follow the report to emulate the performance of the portfolio or use this model portfolio to adjust their own holdings in these important blue chip stocks.


back to top

Subscriber Testimonials

  • You have created and maintained an amazing, highly educational program and I am grateful for your part in getting our retirement funds to the good place they are.

    Karin M., Subscriber
  • An admitted cynic, it's obviously very high praise when he says he likes StockTrends because of its "simplicity, utility, openness, [and] honesty," and in addition to having "no hidden agenda" is "understandably documented [and] historically verifiable." And, he adds, "It lets me see a lot of things without doing a lot of work." Globe and Mail

    Paul W., Subscriber

  • Just thought I'd call to thank you, Skot. Stock Trends Weekly Reporter helped pay for my daughter's education!

    Peter H., Subscriber

  • I've followed your recommendations since reading your columns in the Globe & Mail, and finding they published Stock Trends arrows in their financial listings. I do find them a guide to the general market and what I should be avoiding for declining chart trends.
    Has probably saved me the subscription by not rushing into hot stocks!

    Anthony D., Subscriber
  • Stock Trends Weekly Reporter is an easy way to pick up equities that represent an upward trend.

    Subscriber
  • Stock Trends analysis quantifies nicely the movement of individual stocks. I’ve found that if the technicals are out of synch with fundamental analysis, it is a wake-up call to make a decision. The Stock Trends Bull/Bear Ratio is useful in identifying major market bottoms and tops. It has always presented a good buying or selling opportunity.

    Charles G., Subscriber
  • I very much like the systematic approach to analyzing stock data, it fits my approach.

    Subscriber
  • I am just writing to tell you of my appreciation of your service! It makes so much sense to me. You seem to be an oasis of stability and sensibility in a stockmarket jungle.

    Adrian S., Subscriber

  • I am something of a momentum investor. I find Stock Trends useful as I can look at my portfolio as a “watch list” and quickly see where trends are declining in strength or reversing, so it is particularly useful as a tool in portfolio management regarding sales.

    William C., Subscriber
  • I am fascinated with your service and methodology - it is very impressive. [...] Over the years I have concluded that there are many ways to approach stock investing, but once one has chosen a path, one is better off sticking to it.

    Bob E., Subscriber

  • I want to thank you for posting such an excellent guide to technical analysis on the web. You have provided a great service to all of us novice investors.

    Michael C., Stock Trends user
  • I have had the good fortune to be reasonably successful and enjoy the investment process. Your process would be recommended for both experts and those who are new to investing.

    Frank I., Subscriber
  • There is a lot to be gained from comparing trends of how individual stocks are doing within a sector, as well as how the sector is performing relative to the broad market.

    Dudley R., Subscriber

  • I use Stock Trends to help direct my stock picks. Also, following the advice of Stock Trends I have religiously used stop-loss orders and have avoided hanging on to losing stocks for emotional reasons.

    John B., Subscriber
  • I've followed a number of Stock Trends picks, and the methodology is solid.

    Doug B., Subscriber

  • Hence, anyone who had followed the "Stock Trends" line should have sold their Bre-X shares and, with the windfall, paid for a lifetime subscription to The Globe and Mail and more. Talk about return on investment!

    Muni P., Subscriber

  • Stock Trends information is part of the base information I review before making a trade.

    Subscriber
  • I find your website and research very helpful in my stock trading. I have subscribed to several related services in the past and none present their work with “just the facts” as you. Please keep up the great work so that I can continue to learn! 

    Bryan E., Subscriber
  • Thank you for your excellent work and kind approach to your customers.

    Odette C., Subscriber

  • Your report is an impressive, excellent tool and I have recommmended it to friends.

    Colin E., Subscriber

Subscription Plans

Subscription Plans

STWR - Monthly

$19.95

Monthly subscription plan to Stock Trends Weekly Reporter - pay your monthly subscription fees by having them automatically charged (PayPal only). Free 7-day trial period. Subscribers may cancel before the end of any subscription month.

STWR - 1 Year Prepaid Subscription

$199.00

1 Year Prepaid subscription to Stock Trends Weekly Reporter. Save 16% off monthly rate!

STWR - 2 Year Prepaid Subscription

$299.00

2 Year Prepaid subscription to Stock Trends Weekly Reporter. Save 37% off monthly rate!

STWR - 3 Year Prepaid Subscription

$399.00

3 Year Prepaid subscription to Stock Trends Weekly Reporter. Save 44% off monthly rate!

Stock Trends Editorial

  • Stock Trends Inference Model: A Statistical Foundation for Smarter Investing
    Stock Trends Inference Model: A Statistical Foundation for Smarter Investing At the heart of Stock Trends is a conviction: market data is not noise, but information. For more than three decades, the Stock Trends framework has given investors a disciplined way to interpret market cycles, trend signals, and momentum patterns. The Stock Trends Inference Model (ST-IM) is the natural extension of this approach, embedding rigorous statistical reasoning into the reports available for every listed stock…
    Read more...
  • Technology Sector Split: Hardware & Chips vs. Software – A Deep Dive with Stock Trends
    Technology Sector Split: Hardware & Chips vs. Software – A Deep Dive with Stock Trends The uncertain interest rate environment is evident in a number of sectors, and the stock market is always reflecting both the trend of the cost of capital and the anticipation of changes in it. The technology sector is especially sensitive to interest rates and generally feeds off the risk-on investor appetite supported by lower interest rates or expectations of relatively lower rates. But all technology…
    Read more...
  • Resource rotation remains strong
    Resource rotation remains strong The summer season is coming to a close. It is sometimes a sleepy market season because investor attention is elsewhere. However, the market has provided us with some definite messaging over the past few months. The themes of rotation and building strength in resources and energy stocks, notably fueled by an AI transformation across the broader economy, are key highlights that investors should pay attention…
    Read more...
View all Stock Trends Editorials


Subscription Plans

STWR - Monthly

$19.95/Month

Monthly subscription plan to Stock Trends Weekly Reporter - pay your monthly subscription fees by having them automatically charged (PayPal only). Free 7-day trial period. Subscribers may cancel before the end of any subscription month.

STWR - 1 Year Prepaid Subscription

$199/Year

1 Year Prepaid subscription to Stock Trends Weekly Reporter. Save 16% off monthly rate!

STWR - 2 Year Prepaid Subscription

$299/2 Years

2 Year Prepaid subscription to Stock Trends Weekly Reporter. Save 37% off monthly rate!

STWR - 3 Year Prepaid Subscription

$399/3 Years

3 Year Prepaid subscription to Stock Trends Weekly Reporter. Save 44% off monthly rate!