Improving signs for the stock market

  • 22 January 2012 |
  • Written by  Skot Kortje, Stock Trends Analyst
  • font size
  • Print

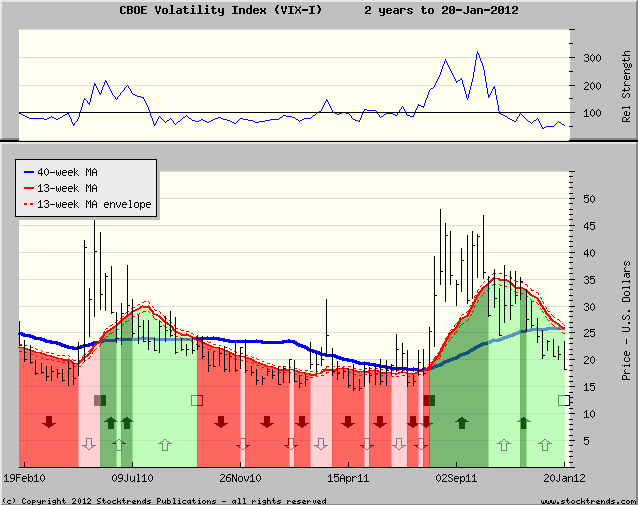
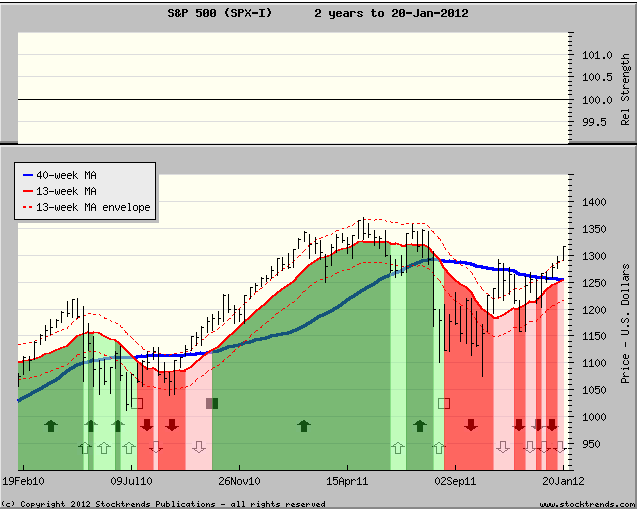
Expectations of market volatility have dropped. The Volatility Index is Stock Trends Bearish; the S&P 500 index is about to turn Stock Trends Bullish. Is this a good time to be in equities?

January’s market advance has offered a fresh hope for equity investors. The S&P 500 is up almost 5% in 2012, while the S&P/TSX Composite has advanced 4%. Another sign that perhaps signals a launch for markets ahead is shrinking market volatility. The CBOE Volatility Index (VIX) has dropped steadily from its peak in the autumn last year, and is now a Stock Trends Bearish Crossover . With the S&P 500 index now verging on a Bullish Crossover , this inverse relationship between market advances and dropping price volatility expectations may be a supporting signal of continued bullish trending for stocks.

The VIX measures the implied volatility of a range of S&P 500 options over the approaching 30 days, and is broadly used as an indicator of the market’s expectation of price volatility over the next month. This index is more accurately understood as an oscillator, with a mathematical expectancy of ‘mean reversion’. That is, although the index will fluctuate between ‘high’ or ‘low’ readings, it will revert to its mean, or average, level once it has peaked or troughed. This mean reversion reflects the market’s long-term expectations of volatility. Even in extremely volatile moments of market crisis, time and information tend to deflate investor anxiety; even in the calmest moments of complacency, the future invariably delivers market crisis. This is one of the truths of the investment world. It is a truth in life, too.
 

Inverse correlation of trend between the CBOE Volatility Index (VIX) and S&P 500 Index


Now that the VIX has returned to its mean level, how meaningful is its current Bearish Crossover indicator? If we look at the record of the past 16 years, the market has showed intermittent correlation with VIX Bearish Crossovers. The table below shows the performance of the S&P 500 index after the VIX turns Stock Trends Bearish with a Bearish Crossover  until it returns to a Stock Trends Bullish trend as a Bullish Crossover .
 
Of the 13 previous VIX Bearish Crossovers during the period - which would represent times when the intermediate trend (13-week average) of the Volatility index had returned back to its long-term average level (40-week average) – three VIX Bearish Crossovers were followed by significant positive returns for the S&P 500 index. Although the VIX Bearish Crossover signal was also followed by three significant drops in the S&P 500, in one of those occasions (June 15, 2001, prior to 9/11) the VIX Bearish Crossover was matched with an established Bearish trend for the S&P 500. The other occasions, January 4, 2002 and May 16, 2008, preceded major market collapses.
 
Overall, the inverse correlation of the VIX Bearish Crossover  as a market-timing indicator appears substantiated when the matching S&P 500 trend is either Bullish or Weak Bearish - as it is now. The current market conditions – supremely affected by the far-from-resolved Euro crisis and the U.S. election cycle – suggest that this recent lull in market anxiety will be positive for equities. The VIX tells us now is the time to be in stocks again.


Performance of the S&P 500 index

during a VIX Stock Trends Bearish trend

Date

VIX

ST Trend

VIX

Price

S&P 500

ST Trend

S&P 500

Price

 S&P 500

% Chg

10/11/96 15.51 700.66  
12/13/96 22.26 728.64 4%
2/20/98 19.55 1034.21  
8/21/98 31.91 1081.18 5%
1/08/99 23.88 1275.09  
2/18/00 28.45 1346.09 6%
8/04/00 21.54 1462.93  
11/24/00 29.58 1341.77 -8%
6/15/01 26.33 1214.36  
9/28/01 35.19 1040.94 -14%
1/04/02 22.02 1172.51  
7/12/02 38.33 921.39 -21%
1/10/03 27.13 927.57  
5/13/05 16.32 1154.05 24%
7/15/05 10.33 1227.92  
10/21/05 16.13 1179.59 -4%
12/02/05 11.01 1265.08  
5/26/06 14.26 1280.16 1%
10/13/06 10.75 1365.62  
3/30/07 14.64 1420.86 4%
5/16/08 16.47 1425.35  
9/19/08 32.07 1255.08 -12%
4/17/09 33.94 869.6  
5/28/10 32.07 1089.41 25%
10/01/10 22.5 1146.24  
7/29/11 25.25 1292.28 13%
1/20/12 18.28 1315.38  
 
back to top

Subscriber Testimonials

  • I want to thank you for posting such an excellent guide to technical analysis on the web. You have provided a great service to all of us novice investors.

    Michael C., Stock Trends user
  • I am fascinated with your service and methodology - it is very impressive. [...] Over the years I have concluded that there are many ways to approach stock investing, but once one has chosen a path, one is better off sticking to it.

    Bob E., Subscriber

  • Hence, anyone who had followed the "Stock Trends" line should have sold their Bre-X shares and, with the windfall, paid for a lifetime subscription to The Globe and Mail and more. Talk about return on investment!

    Muni P., Subscriber

  • There is a lot to be gained from comparing trends of how individual stocks are doing within a sector, as well as how the sector is performing relative to the broad market.

    Dudley R., Subscriber

  • Stock Trends information is part of the base information I review before making a trade.

    Subscriber
  • Your report is an impressive, excellent tool and I have recommmended it to friends.

    Colin E., Subscriber

  • I am just writing to tell you of my appreciation of your service! It makes so much sense to me. You seem to be an oasis of stability and sensibility in a stockmarket jungle.

    Adrian S., Subscriber

  • An admitted cynic, it's obviously very high praise when he says he likes StockTrends because of its "simplicity, utility, openness, [and] honesty," and in addition to having "no hidden agenda" is "understandably documented [and] historically verifiable." And, he adds, "It lets me see a lot of things without doing a lot of work." Globe and Mail

    Paul W., Subscriber

  • I find your website and research very helpful in my stock trading. I have subscribed to several related services in the past and none present their work with “just the facts” as you. Please keep up the great work so that I can continue to learn! 

    Bryan E., Subscriber
  • Stock Trends Weekly Reporter is an easy way to pick up equities that represent an upward trend.

    Subscriber
  • I've followed your recommendations since reading your columns in the Globe & Mail, and finding they published Stock Trends arrows in their financial listings. I do find them a guide to the general market and what I should be avoiding for declining chart trends.
    Has probably saved me the subscription by not rushing into hot stocks!

    Anthony D., Subscriber
  • I have had the good fortune to be reasonably successful and enjoy the investment process. Your process would be recommended for both experts and those who are new to investing.

    Frank I., Subscriber
  • I use Stock Trends to help direct my stock picks. Also, following the advice of Stock Trends I have religiously used stop-loss orders and have avoided hanging on to losing stocks for emotional reasons.

    John B., Subscriber
  • Thank you for your excellent work and kind approach to your customers.

    Odette C., Subscriber

  • I am something of a momentum investor. I find Stock Trends useful as I can look at my portfolio as a “watch list” and quickly see where trends are declining in strength or reversing, so it is particularly useful as a tool in portfolio management regarding sales.

    William C., Subscriber
  • I very much like the systematic approach to analyzing stock data, it fits my approach.

    Subscriber
  • I've followed a number of Stock Trends picks, and the methodology is solid.

    Doug B., Subscriber

  • Stock Trends analysis quantifies nicely the movement of individual stocks. I’ve found that if the technicals are out of synch with fundamental analysis, it is a wake-up call to make a decision. The Stock Trends Bull/Bear Ratio is useful in identifying major market bottoms and tops. It has always presented a good buying or selling opportunity.

    Charles G., Subscriber
  • Just thought I'd call to thank you, Skot. Stock Trends Weekly Reporter helped pay for my daughter's education!

    Peter H., Subscriber

  • You have created and maintained an amazing, highly educational program and I am grateful for your part in getting our retirement funds to the good place they are.

    Karin M., Subscriber

Subscription Plans

Subscription Plans

STWR - Monthly

$19.95

Monthly subscription plan to Stock Trends Weekly Reporter - pay your monthly subscription fees by having them automatically charged (PayPal only). Free 7-day trial period. Subscribers may cancel before the end of any subscription month.

STWR - 1 Year Prepaid Subscription

$199.00

1 Year Prepaid subscription to Stock Trends Weekly Reporter. Save 16% off monthly rate!

STWR - 2 Year Prepaid Subscription

$299.00

2 Year Prepaid subscription to Stock Trends Weekly Reporter. Save 37% off monthly rate!

STWR - 3 Year Prepaid Subscription

$399.00

3 Year Prepaid subscription to Stock Trends Weekly Reporter. Save 44% off monthly rate!

Stock Trends Editorial

  • Holiday Tape in Consumer Discretionary: What 46 Seasons Reveal Through Stock Trends Indicators
    Holiday Tape in Consumer Discretionary: What 46 Seasons Reveal Through Stock Trends Indicators For Consumer Discretionary companies, the six weeks surrounding Black Friday and year-end are not just a retail storyline—they are a real-time referendum on consumer confidence, pricing power, and risk appetite. To test what this period actually means for investors, we analyzed the Stock Trends Consumer Discretionary universe across every year in the dataset, using a consistent six-week window (from the third week of November to the final trading week of December, based on weekly Friday closes). The objective was simple: does the Stock Trends framework—trend classifications, RSI relative strength, and volume tags—extract a repeatable signal from the holiday season? The answer is nuanced, but actionable.
    15 December 2025 Read more...
  • Understanding Our Assumptions — A Decade Later
    Understanding Our Assumptions — A Decade Later For decades, the Stock Trends framework has rested on a foundational analytical question: Can we infer future return tendencies from recurring patterns of trend, momentum, and trading activity? In 2014, we formalized this question through the Stock Trends Inference Model (ST-IM), built on two basic premises: Market conditions are non-specific to a particular security. Market responses to these conditions are specific. Those ideas remain central to Stock Trends today. But the investing world has changed. Academic research into momentum, trend-following, and behavioural finance has deepened; markets have experienced extreme macro cycles; and our own analytical tools have evolved dramatically. A decade later, it is time to revisit the original assumptions, test them against modern evidence, and expand their meaning for today’s Stock Trends users.
    11 December 2025 Read more...
  • Trading Nvidia with the Stock Trends RSI +/– Pattern Analysis Model
    Trading Nvidia with the Stock Trends RSI +/– Pattern Analysis Model Nvidia’s extraordinary rise in recent years has made it a centrepiece of both long-term institutional portfolios and short-term trading desks. Yet few tools provide a disciplined, data-driven lens for navigating NVDA’s volatile weekly momentum. The Stock Trends RSI +/– Pattern Analysis model model is one of them—an evidence-based framework that converts historical price–benchmark relationships into probabilistic expectations of next-week performance. When applied to NVDA-Q, it becomes a powerful guide for traders seeking tactical entries, binary-style short-term trades, or precision timing for longer-term positions.
    11 December 2025 Read more...
  • Silver’s Ascent and the Discipline of Stock Trends: How Trend Indicators and ST-IM Guidance Shape Today’s Opportunities
    Silver’s Ascent and the Discipline of Stock Trends: How Trend Indicators and ST-IM Guidance Shape Today’s Opportunities Silver’s remarkable advance into the final weeks of 2025 has not merely lifted the metal itself—it has broadened across miners, royalty companies, bullion funds, and leveraged silver proxies in a way rarely seen in the past decade. Investors watching this sector cannot help but ask whether the trend still offers opportunity or whether this is a moment that calls for caution. The Stock Trends framework provides the clarity required to navigate this environment with discipline rather than emotion.
    06 December 2025 Read more...
View all Stock Trends Editorials


Subscription Plans

STWR - Monthly

$19.95/Month

Monthly subscription plan to Stock Trends Weekly Reporter - pay your monthly subscription fees by having them automatically charged (PayPal only). Free 7-day trial period. Subscribers may cancel before the end of any subscription month.

STWR - 1 Year Prepaid Subscription

$199/Year

1 Year Prepaid subscription to Stock Trends Weekly Reporter. Save 16% off monthly rate!

STWR - 2 Year Prepaid Subscription

$299/2 Years

2 Year Prepaid subscription to Stock Trends Weekly Reporter. Save 37% off monthly rate!

STWR - 3 Year Prepaid Subscription

$399/3 Years

3 Year Prepaid subscription to Stock Trends Weekly Reporter. Save 44% off monthly rate!