Stock Trends Select Bullish Crossover Portfolio

  • 01 October 2025 |
  • Written by  Skot Kortje, Stock Trends Analyst
  • font size
  • Print

The Select Bullish Crossover Portfolio strategy stands at the intersection of systematic inference and market timing. Each position is chosen from the Stock Trends Inference Model’s Select list—names whose probability of outperforming the base random return is favorable across 4, 13, and 40 weeks. From this foundation, the portfolio then isolates Bullish Crossover (ST BullishXoverSmall) signals, capturing securities that have transitioned from neutral or bearish states into confirmed upward momentum. In this editorial, we look at the NYSE Select Bullish Crossover Portfolio's current holdings and discover that some themes are revealed.

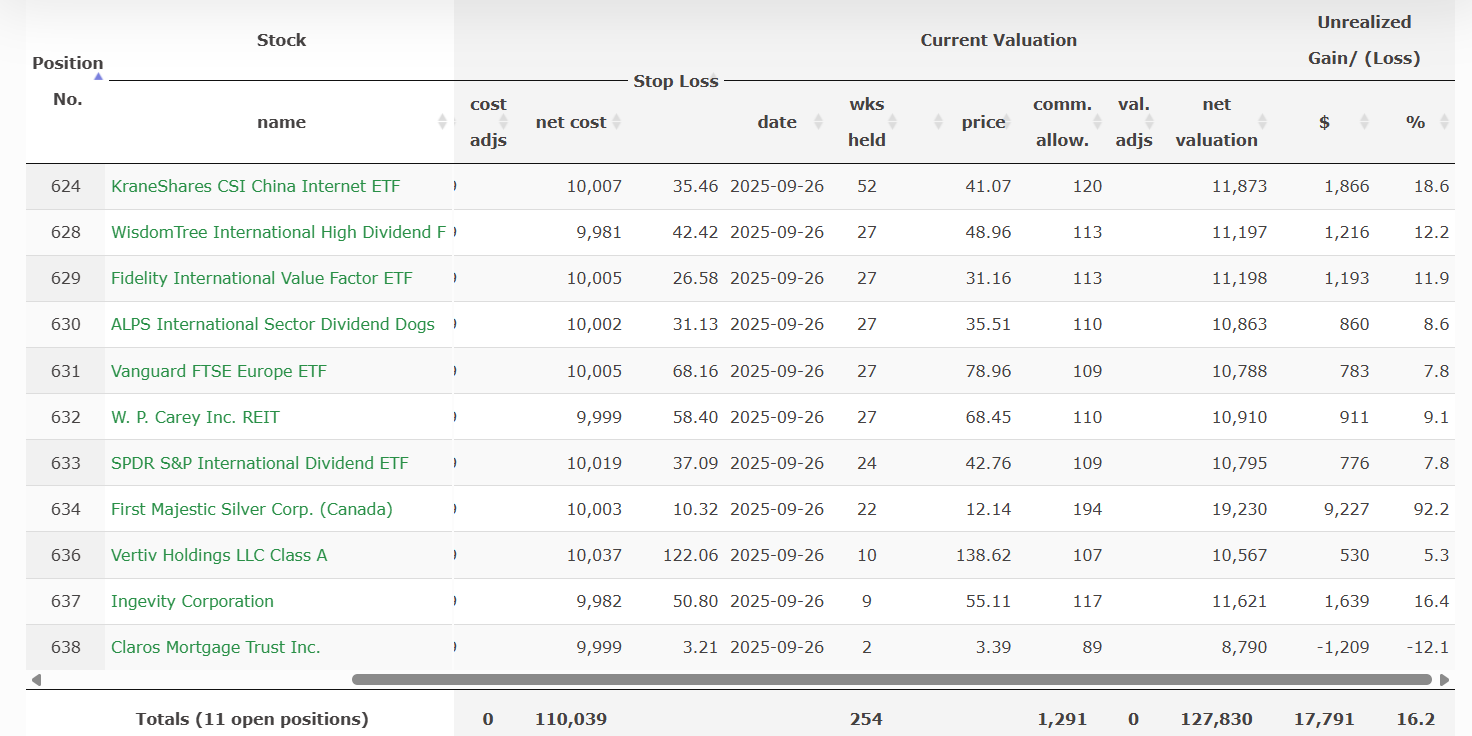
The current longer-term holdings of any Stock Trends Portfolio are, by definition, survivors. They represent stocks and ETFs that have adhered to the strategy parameters and have not yet triggered the exit rules. But what does a survey of the holdings of the NYSE Select Bullish Crossover Portfolio tell us? What emerges is a strategically diversified basket of bullish narratives, mapped to today’s macro regime:

  • Hard Asset Resilience — precious metals as hedges in an inflation-tinged, geopolitically uncertain world.
  • Yield & Income Stability — REITs and global dividend ETFs as rates ease and defensiveness returns.
  • Global Value Rotation — factor/value exposures favored as investors seek earnings stability.
  • China Recovery Trade — selective re-risking into China internet after prolonged turbulence.
  • Cyclical & Secular Growth — industrials and AI/data-center infrastructure as twin engines.

Consistent with the Stock Trends Handbook and the ST-IM framework, this portfolio expresses the Stock Trends principle: probabilities, not speculation.

Selection Logic

Portfolio strategy details: NYSE — ST-IM Select Bullish Crossover.

  • Minimum price: $2; Minimum weekly volume: 100,000 shares.
  • Bullish Crossover Stock Trends indicator: ST BullishXoverSmall
  • ST-IM Select: lower bound of mean return confidence interval > base random mean at 4w, 13w, 40w.
  • Names are then ranked by probability of exceeding the 13-week base random return (threshold ≥ 55%).

Current Holdings

SymbolNameTrendTrend Age (wks)Major Trend Count (wks)RSINotes
AG First Majestic Silver Corp. ST BullishSmall 18 23 141  Precious metals hedge, strong momentum 
CMTG Claros Mortgage Trust Inc. ST BullishSmall 2 3 109  Early bullish crossover in REITs 
DTH WisdomTree International High Dividend ETF ST BullishSmall 27 28 99  Global yield play, stable trend 
DWX SPDR S&P International Dividend ETF ST BullishSmall 24 25 95  Dividend exposure, lagging RSI 
FIVA Fidelity International Value Factor ETF ST BullishSmall 25 28 99  Value tilt, aligned with global rotation 
IDOG ALPS International Sector Dividend Dogs ST BullishSmall 25 28 98  Contrarian yield ETF 
KWEB KraneShares CSI China Internet ETF ST BullishSmall 22 53 111  China rebound theme 
NGVT Ingevity Corporation ST BullishSmall 8 10 118  Specialty chemicals, cyclical rebound 
VGK Vanguard FTSE Europe ETF ST BullishSmall 25 28 95  Europe recovery trade 
VRT Vertiv Holdings LLC Class A ST BullishSmall 3 11 101  AI/data center infrastructure 
WPC W. P. Carey Inc. REIT ST BullishSmall 24 28 101  REIT with diversified income


NYSE SelectBullishXover holdings

NYSE SelectBullishXover returns

Theme-Based Commentary & Rationale

Hard Asset Resilience — First Majestic Silver Corp. (AG)

Signal: 18 weeks into a Bullish trend category (ST BullishSmall) with RSI 141 and positive relative momentum. Within the portfolio’s design, AG functions as a macro hedge and a momentum leader, consistent with the Handbook’s guidance on aligning trend confirmation with macro hedging.

Yield & Income Stability — Claros Mortgage Trust (CMTG) & W. P. Carey (WPC)

CMTG is an early-phase Bullish trend (2 wks) with RSI 109; WPC is in a mature Bullish trend (24 wks) with RSI 101 and positive relative momentum. As expectations for rate relief grow, REITs’ risk-reward improves. The pairing provides both early momentum (CMTG) and seasoned trend stability (WPC).

Global Dividend Defensives — DTH (DTH), DWX (DWX), IDOG (IDOG), VGK (VGK)

All four are in mature Bullish trends (24–27 wks), offering income-tilted ballast and geographic diversification. DTH (RSI 99) and VGK (RSI 95, +) center the Europe/international yield theme, while IDOG (RSI 98, +) adds contrarian selection across sectors. DWX (RSI 95, –) lags on relative strength but remains trend-confirmed.

Global Value Rotation — FIVA (FIVA)

FIVA sits 25 weeks into its Bullish trend category with RSI 99 and positive relative momentum. As a systematic factor sleeve, it complements the ST-IM inference by emphasizing value and quality when earnings dispersion widens.

China Recovery Trade — KWEB (KWEB)

22 weeks into its strong Bullish trend with RSI 111 (– vs S&P). Despite relative chop, the trend confirmation and ST-IM Select status justify a measured allocation to the China internet rebound narrative.

Cyclical & Secular Growth — Ingevity (NGVT) & Vertiv Holdings (VRT)

NGVT is 8 weeks into its Bullish trend with RSI 118 (– vs S&P), a cyclical chemicals recovery story. VRT, 3 weeks into a Bullish trend (RSI 101, –), captures the secular AI/data-center build-out. Together they balance early momentum with structural growth exposure.

Conclusion

The Select Bullish Crossover Portfolio channels the weight of evidence: ST-IM probabilities, confirmed trend transitions, and macro-aligned themes. Mature dividend and international sleeves provide defensive ballast, while newer crossovers supply asymmetric upside. In line with the Stock Trends framework, we let quantified probabilities guide allocation and let trends validate it in real time.

back to top

Subscriber Testimonials

  • I've followed your recommendations since reading your columns in the Globe & Mail, and finding they published Stock Trends arrows in their financial listings. I do find them a guide to the general market and what I should be avoiding for declining chart trends.
    Has probably saved me the subscription by not rushing into hot stocks!

    Anthony D., Subscriber
  • Stock Trends analysis quantifies nicely the movement of individual stocks. I’ve found that if the technicals are out of synch with fundamental analysis, it is a wake-up call to make a decision. The Stock Trends Bull/Bear Ratio is useful in identifying major market bottoms and tops. It has always presented a good buying or selling opportunity.

    Charles G., Subscriber
  • I am fascinated with your service and methodology - it is very impressive. [...] Over the years I have concluded that there are many ways to approach stock investing, but once one has chosen a path, one is better off sticking to it.

    Bob E., Subscriber

  • Hence, anyone who had followed the "Stock Trends" line should have sold their Bre-X shares and, with the windfall, paid for a lifetime subscription to The Globe and Mail and more. Talk about return on investment!

    Muni P., Subscriber

  • I am just writing to tell you of my appreciation of your service! It makes so much sense to me. You seem to be an oasis of stability and sensibility in a stockmarket jungle.

    Adrian S., Subscriber

  • I've followed a number of Stock Trends picks, and the methodology is solid.

    Doug B., Subscriber

  • Your report is an impressive, excellent tool and I have recommmended it to friends.

    Colin E., Subscriber

  • An admitted cynic, it's obviously very high praise when he says he likes StockTrends because of its "simplicity, utility, openness, [and] honesty," and in addition to having "no hidden agenda" is "understandably documented [and] historically verifiable." And, he adds, "It lets me see a lot of things without doing a lot of work." Globe and Mail

    Paul W., Subscriber

  • Just thought I'd call to thank you, Skot. Stock Trends Weekly Reporter helped pay for my daughter's education!

    Peter H., Subscriber

  • I use Stock Trends to help direct my stock picks. Also, following the advice of Stock Trends I have religiously used stop-loss orders and have avoided hanging on to losing stocks for emotional reasons.

    John B., Subscriber
  • I very much like the systematic approach to analyzing stock data, it fits my approach.

    Subscriber
  • I have had the good fortune to be reasonably successful and enjoy the investment process. Your process would be recommended for both experts and those who are new to investing.

    Frank I., Subscriber
  • I am something of a momentum investor. I find Stock Trends useful as I can look at my portfolio as a “watch list” and quickly see where trends are declining in strength or reversing, so it is particularly useful as a tool in portfolio management regarding sales.

    William C., Subscriber
  • There is a lot to be gained from comparing trends of how individual stocks are doing within a sector, as well as how the sector is performing relative to the broad market.

    Dudley R., Subscriber

  • You have created and maintained an amazing, highly educational program and I am grateful for your part in getting our retirement funds to the good place they are.

    Karin M., Subscriber
  • I find your website and research very helpful in my stock trading. I have subscribed to several related services in the past and none present their work with “just the facts” as you. Please keep up the great work so that I can continue to learn! 

    Bryan E., Subscriber
  • Thank you for your excellent work and kind approach to your customers.

    Odette C., Subscriber

  • I want to thank you for posting such an excellent guide to technical analysis on the web. You have provided a great service to all of us novice investors.

    Michael C., Stock Trends user
  • Stock Trends Weekly Reporter is an easy way to pick up equities that represent an upward trend.

    Subscriber
  • Stock Trends information is part of the base information I review before making a trade.

    Subscriber

Subscription Plans

Subscription Plans

STWR - Monthly

$19.95

Monthly subscription plan to Stock Trends Weekly Reporter - pay your monthly subscription fees by having them automatically charged (PayPal only). Free 7-day trial period. Subscribers may cancel before the end of any subscription month.

STWR - 1 Year Prepaid Subscription

$199.00

1 Year Prepaid subscription to Stock Trends Weekly Reporter. Save 16% off monthly rate!

STWR - 2 Year Prepaid Subscription

$299.00

2 Year Prepaid subscription to Stock Trends Weekly Reporter. Save 37% off monthly rate!

STWR - 3 Year Prepaid Subscription

$399.00

3 Year Prepaid subscription to Stock Trends Weekly Reporter. Save 44% off monthly rate!

Stock Trends Editorial

  • Market Regimes at an Inflection Point: What Stock Trends Indicators Reveal About the Current Market Climate
    Market Regimes at an Inflection Point: What Stock Trends Indicators Reveal About the Current Market Climate The latest weekly distribution of Stock Trends indicators points to an important shift in the underlying market regime for both U.S. and Canadian equities. A close examination of the composite trend structure—Bullish and Bearish proportions, crossovers, momentum breadth, and trend age—suggests that the market environment is undergoing meaningful transformation. By relating these observations to the developing Stock Trends ML Causal AI epoch framework, we gain…
    Read more...
  • Stock Trends Portfolio Strategies: A Data-Driven Review of Long-Term Performance
    Stock Trends Portfolio Strategies: A Data-Driven Review of Long-Term Performance Stock Trends model portfolios translate the core principles of the Stock Trends Handbook into systematic investment strategies. Each portfolio is built on the same foundation: objective price trend classifications, moving average crossover behaviour, volume indicators, and relative strength measures. These models apply the Stock Trends indicators consistently across decades, allowing investors to see how disciplined, rules-based trend following performs through complete market cycles.
    Read more...
  • When the “Big Short” Turned Its Eye on Tech: Interpreting the Burry Shock Through Stock Trends Indicators
    When the “Big Short” Turned Its Eye on Tech: Interpreting the Burry Shock Through Stock Trends Indicators When the news broke that famed investor Michael Burry—whose 2008 “Big Short” foresight became legend—had placed large put options against Nvidia (NVDA) and Palantir (PLTR), the market reacted with a collective shudder. Within hours of the disclosure, technology shares that had led the 2025 rally wavered. Headlines proclaimed the “AI bubble” had met its doubter, and retail investors who had crowded into the artificial-intelligence narrative…
    Read more...
  • High-Volume Leaders: A Closer Look at the Heaviest-Traded Stocks
    High-Volume Leaders: A Closer Look at the Heaviest-Traded Stocks Stock Trends’ Unusually High Volume () indicator flags stocks whose weekly trading volume is at least 200% of their 13-week average. In the October 31 weekly reports, only a small slice of the universe qualifies—making these signals rare and valuable. When high volume coincides with a bullish trend state (or a new Bullish Crossover), it can mark institutional footprints at the start of a multi-week advance.
    Read more...
View all Stock Trends Editorials


Subscription Plans

STWR - Monthly

$19.95/Month

Monthly subscription plan to Stock Trends Weekly Reporter - pay your monthly subscription fees by having them automatically charged (PayPal only). Free 7-day trial period. Subscribers may cancel before the end of any subscription month.

STWR - 1 Year Prepaid Subscription

$199/Year

1 Year Prepaid subscription to Stock Trends Weekly Reporter. Save 16% off monthly rate!

STWR - 2 Year Prepaid Subscription

$299/2 Years

2 Year Prepaid subscription to Stock Trends Weekly Reporter. Save 37% off monthly rate!

STWR - 3 Year Prepaid Subscription

$399/3 Years

3 Year Prepaid subscription to Stock Trends Weekly Reporter. Save 44% off monthly rate!