Trend Profile - ARC Resources Ltd.

  • 10 January 2011 |
  • Written by  Skot Kortje, Stock Trends Analyst
  • font size
  • Print

ARC Resources converted back to a corporate structure after years as an energy income trust. Will its blue chip status help it leave behind pre-conversion resistance levels?

The Stock: ARC Resources Ltd. (ARX-T) Recent price: $24.99

The Trend

With the arrival of 2011 there was the long-expected conversion of many
TSX-listed income trusts. More than 50 business income trusts completed
their switch to corporate status and began trading on the TSX as common
stocks last week.

Income trusts have certain capital restrictions that accompany the
tax-related income benefits of the asset, so the new common-share status
will deliver opportunities for market-timing investors looking for
capital gains. This slew of transformations may also offer investors a
fresh chance to capture bullish trends. Some of the newly converted
common stocks are in the energy sector, including well-known
large-capitalization entries such as Canadian Oil Sands, Penn West
Petroleum, and Enerplus Corp. Despite a recent pullback, the equity
price trend of the oil patch remains strongly bullish. The price of
crude oil slipped below $90 (U.S.) last week as the U.S. dollar lifted
with a revival of the flight-to-safety trade.

The Trade

From its initial public offering in 1996 until its completed conversion
last week, ARC Resources has established itself as a successful player
in the oil and gas sector, growing from its original $180-million
capitalization to its current $6.9-billion market cap as an income
trust. In late 2008 its units achieved membership in the S&P/TSX 60
index, and its stock will continue to attract institutional ownership as
a result of its blue-chip status. Of interest now, though, is how the
stock moves through price resistance levels established before the
recent conversion.

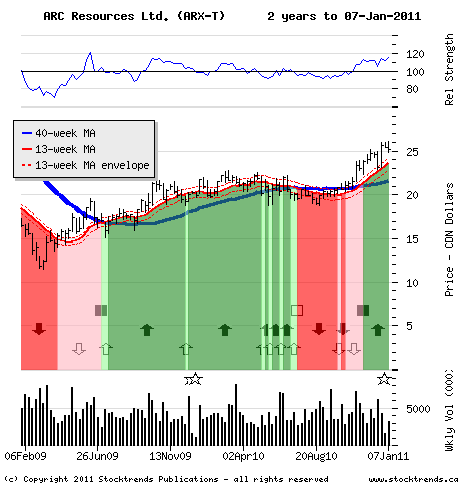
The stock has been in a Stock Trends Bullish category since
mid-November, after it rallied above the top end of a long-term trading
range. The stock subsequently dropped to the 13-week moving average
support line before rallying again to $26 before the Christmas holiday,
a level that now serves as a price resistance marker. The stock is again
retreating, trading below $25 in the Monday morning session. Technical
traders would expect support above $24, so the early weakness gives a
nice cue for a rally back to its 52-week high as the energy sector rebounds.


The Upside

Sector strength will guide this trade, with relatively firm crude oil
prices expected to elevate petroleum stocks in the quarter ahead.
Shareholders will be looking for fresh gains if the stock rallies out of
the current pullback and pushes decisively through the $26 level. When
ARC's units peaked above $30 in 2008 they were valued at 13 times
earnings. The stock now trades at 24 times forward earnings - an
indication of the changed valuations at work.

The Downside

The energy sector risk is that the North American recovery fizzles or
China's growth slows. ARC's shares would become Stock Trends Weak
Bullish at $23 - a fair trigger to exit the trade. 

back to top

Subscriber Testimonials

  • Stock Trends Weekly Reporter is an easy way to pick up equities that represent an upward trend.

    Subscriber
  • You have created and maintained an amazing, highly educational program and I am grateful for your part in getting our retirement funds to the good place they are.

    Karin M., Subscriber
  • I use Stock Trends to help direct my stock picks. Also, following the advice of Stock Trends I have religiously used stop-loss orders and have avoided hanging on to losing stocks for emotional reasons.

    John B., Subscriber
  • Thank you for your excellent work and kind approach to your customers.

    Odette C., Subscriber

  • I am fascinated with your service and methodology - it is very impressive. [...] Over the years I have concluded that there are many ways to approach stock investing, but once one has chosen a path, one is better off sticking to it.

    Bob E., Subscriber

  • Stock Trends analysis quantifies nicely the movement of individual stocks. I’ve found that if the technicals are out of synch with fundamental analysis, it is a wake-up call to make a decision. The Stock Trends Bull/Bear Ratio is useful in identifying major market bottoms and tops. It has always presented a good buying or selling opportunity.

    Charles G., Subscriber
  • Your report is an impressive, excellent tool and I have recommmended it to friends.

    Colin E., Subscriber

  • I am just writing to tell you of my appreciation of your service! It makes so much sense to me. You seem to be an oasis of stability and sensibility in a stockmarket jungle.

    Adrian S., Subscriber

  • I've followed a number of Stock Trends picks, and the methodology is solid.

    Doug B., Subscriber

  • Stock Trends information is part of the base information I review before making a trade.

    Subscriber
  • There is a lot to be gained from comparing trends of how individual stocks are doing within a sector, as well as how the sector is performing relative to the broad market.

    Dudley R., Subscriber

  • Hence, anyone who had followed the "Stock Trends" line should have sold their Bre-X shares and, with the windfall, paid for a lifetime subscription to The Globe and Mail and more. Talk about return on investment!

    Muni P., Subscriber

  • Just thought I'd call to thank you, Skot. Stock Trends Weekly Reporter helped pay for my daughter's education!

    Peter H., Subscriber

  • I very much like the systematic approach to analyzing stock data, it fits my approach.

    Subscriber
  • I have had the good fortune to be reasonably successful and enjoy the investment process. Your process would be recommended for both experts and those who are new to investing.

    Frank I., Subscriber
  • I find your website and research very helpful in my stock trading. I have subscribed to several related services in the past and none present their work with “just the facts” as you. Please keep up the great work so that I can continue to learn! 

    Bryan E., Subscriber
  • An admitted cynic, it's obviously very high praise when he says he likes StockTrends because of its "simplicity, utility, openness, [and] honesty," and in addition to having "no hidden agenda" is "understandably documented [and] historically verifiable." And, he adds, "It lets me see a lot of things without doing a lot of work." Globe and Mail

    Paul W., Subscriber

  • I want to thank you for posting such an excellent guide to technical analysis on the web. You have provided a great service to all of us novice investors.

    Michael C., Stock Trends user
  • I've followed your recommendations since reading your columns in the Globe & Mail, and finding they published Stock Trends arrows in their financial listings. I do find them a guide to the general market and what I should be avoiding for declining chart trends.
    Has probably saved me the subscription by not rushing into hot stocks!

    Anthony D., Subscriber
  • I am something of a momentum investor. I find Stock Trends useful as I can look at my portfolio as a “watch list” and quickly see where trends are declining in strength or reversing, so it is particularly useful as a tool in portfolio management regarding sales.

    William C., Subscriber

Subscription Plans

Subscription Plans

STWR - Monthly

$19.95

Monthly subscription plan to Stock Trends Weekly Reporter - pay your monthly subscription fees by having them automatically charged (PayPal only). Free 7-day trial period. Subscribers may cancel before the end of any subscription month.

STWR - 1 Year Prepaid Subscription

$199.00

1 Year Prepaid subscription to Stock Trends Weekly Reporter. Save 16% off monthly rate!

STWR - 2 Year Prepaid Subscription

$299.00

2 Year Prepaid subscription to Stock Trends Weekly Reporter. Save 37% off monthly rate!

STWR - 3 Year Prepaid Subscription

$399.00

3 Year Prepaid subscription to Stock Trends Weekly Reporter. Save 44% off monthly rate!

Stock Trends Editorial

  • Holiday Tape in Consumer Discretionary: What 46 Seasons Reveal Through Stock Trends Indicators
    Holiday Tape in Consumer Discretionary: What 46 Seasons Reveal Through Stock Trends Indicators For Consumer Discretionary companies, the six weeks surrounding Black Friday and year-end are not just a retail storyline—they are a real-time referendum on consumer confidence, pricing power, and risk appetite. To test what this period actually means for investors, we analyzed the Stock Trends Consumer Discretionary universe across every year in the dataset, using a consistent six-week window (from the third week of November to the final trading week of December, based on weekly Friday closes). The objective was simple: does the Stock Trends framework—trend classifications, RSI relative strength, and volume tags—extract a repeatable signal from the holiday season? The answer is nuanced, but actionable.
    15 December 2025 Read more...
  • Understanding Our Assumptions — A Decade Later
    Understanding Our Assumptions — A Decade Later For decades, the Stock Trends framework has rested on a foundational analytical question: Can we infer future return tendencies from recurring patterns of trend, momentum, and trading activity? In 2014, we formalized this question through the Stock Trends Inference Model (ST-IM), built on two basic premises: Market conditions are non-specific to a particular security. Market responses to these conditions are specific. Those ideas remain central to Stock Trends today. But the investing world has changed. Academic research into momentum, trend-following, and behavioural finance has deepened; markets have experienced extreme macro cycles; and our own analytical tools have evolved dramatically. A decade later, it is time to revisit the original assumptions, test them against modern evidence, and expand their meaning for today’s Stock Trends users.
    11 December 2025 Read more...
  • Trading Nvidia with the Stock Trends RSI +/– Pattern Analysis Model
    Trading Nvidia with the Stock Trends RSI +/– Pattern Analysis Model Nvidia’s extraordinary rise in recent years has made it a centrepiece of both long-term institutional portfolios and short-term trading desks. Yet few tools provide a disciplined, data-driven lens for navigating NVDA’s volatile weekly momentum. The Stock Trends RSI +/– Pattern Analysis model model is one of them—an evidence-based framework that converts historical price–benchmark relationships into probabilistic expectations of next-week performance. When applied to NVDA-Q, it becomes a powerful guide for traders seeking tactical entries, binary-style short-term trades, or precision timing for longer-term positions.
    11 December 2025 Read more...
  • Silver’s Ascent and the Discipline of Stock Trends: How Trend Indicators and ST-IM Guidance Shape Today’s Opportunities
    Silver’s Ascent and the Discipline of Stock Trends: How Trend Indicators and ST-IM Guidance Shape Today’s Opportunities Silver’s remarkable advance into the final weeks of 2025 has not merely lifted the metal itself—it has broadened across miners, royalty companies, bullion funds, and leveraged silver proxies in a way rarely seen in the past decade. Investors watching this sector cannot help but ask whether the trend still offers opportunity or whether this is a moment that calls for caution. The Stock Trends framework provides the clarity required to navigate this environment with discipline rather than emotion.
    06 December 2025 Read more...
View all Stock Trends Editorials


Subscription Plans

STWR - Monthly

$19.95/Month

Monthly subscription plan to Stock Trends Weekly Reporter - pay your monthly subscription fees by having them automatically charged (PayPal only). Free 7-day trial period. Subscribers may cancel before the end of any subscription month.

STWR - 1 Year Prepaid Subscription

$199/Year

1 Year Prepaid subscription to Stock Trends Weekly Reporter. Save 16% off monthly rate!

STWR - 2 Year Prepaid Subscription

$299/2 Years

2 Year Prepaid subscription to Stock Trends Weekly Reporter. Save 37% off monthly rate!

STWR - 3 Year Prepaid Subscription

$399/3 Years

3 Year Prepaid subscription to Stock Trends Weekly Reporter. Save 44% off monthly rate!