Stock Trends Reports now feature return estimates for individual stocks and ETFs in the Profile section.
|
A much longer time in coming than originally planned, the new Stock Trends Report 'Profile' section is installed on the Stock Trends website. Available for most common stocks and exchange traded funds, the Profile report now features the Stock Trends Inference Model introduced in the past year. This analysis attempts to answer the very important question: what return expectations do the Stock Trends Reports imply? If you were lucky (?) enough to take statistics in your previous studies, you are probably reasonably versed in statistical inference methodology. You will know about measurements of central tendency and variability. You will know about the 'mean' and 'standard deviation' - both as descriptive statistics of a sample and estimated parameters of a population. And you will also know about sample spaces and probabilities. The Stock Trends Inference Model is an application of these basic statistical methods.
If you were lucky enough to have avoided a statistics course in school, be assured this model can be explained in very simple and clear language. I've tried to do that in the editorials I have already written about this analysis, but let's summarize here. First, though, a description of methodology should always be preceded by a statement of the research question and the biases of that question.
Because the departure point for any model is the assumptions that underlie it, it's important to fully understand the fundamental premises of the Stock Trends Inference Model. The primary assumption is a core tenet of technical analysis - that price patterns repeat themselves. In order to illustrate this and display empirical observations of patterns market technicians must assert that these market price and volume patterns are homogeneous across markets.
What does that mean? It means that a price pattern observed in one market can be meaningfully applied to another market. A moving average crossover, for example, carries significance as much in AAPL as it does in ZNGA. A head-and-shoulders pattern found in the chart of IBM in 1980 a template for one in BAC in 2010 (please note: not factual dates for this example).
If the application of technical patterns depends upon the premise that these patterns repeat themselves, what use is the observation of an historical pattern if it does not offer some predicative accuracy? It is not enough to be doctrinaire in our answer and provide anecdotal evidence of positive outcomes. We must provide a larger number of outcomes as evidence.
Of course, no matter how large the sample size of the outcomes we present, the evidence will always be just a portion of the total number of possible outcomes across markets and across time. When we look at possible outcomes we must understand that these outcomes are not based on the market conditions of a particular moment. That would be unsatisfactory and biased. Because we cannot possibly know what will happen in any particular market, we must instead look at the estimating the character of all markets in a given condition.
In the Stock Trends Inference Model the given condition is represented by the Stock Trends indicator combination. That combination is the aggregate of the Stock Trends trend indicator, the length of time the current trend category (BULLISH or BEARISH), the length of time of the current trend indicator, the 13-week Relative Strength (RSI) indicator value, the 1-week RSI +/- indicator, and the volume indicator. These indicators quantify and categorize a market condition in terms of trend and price momentum. Distinct combinations of these indicators qualify particular trends by price momentum and volume characteristics.
If we look at the current Stock Trends indicator combination of AAPL, for example, we can see that this stock is in the 31st week of being labeled with a (strong) Bullish indicator and that it has been in a BULLISH trend category for 52-weeks. Its 13-week Relative Strength indicator (RSI) value is 109, indicating AAPL has outperformed the S&P 500 index by approximately 9% over the past 13-week period. The current RSI +/- indicator is (+) , indicating the stock outperformed the benchmark market index in the past week. Finally, there is no Unusual Volume indicator, indicating that last week's trading volume was not high or low enough to be assigned either a high or low volume indicator.
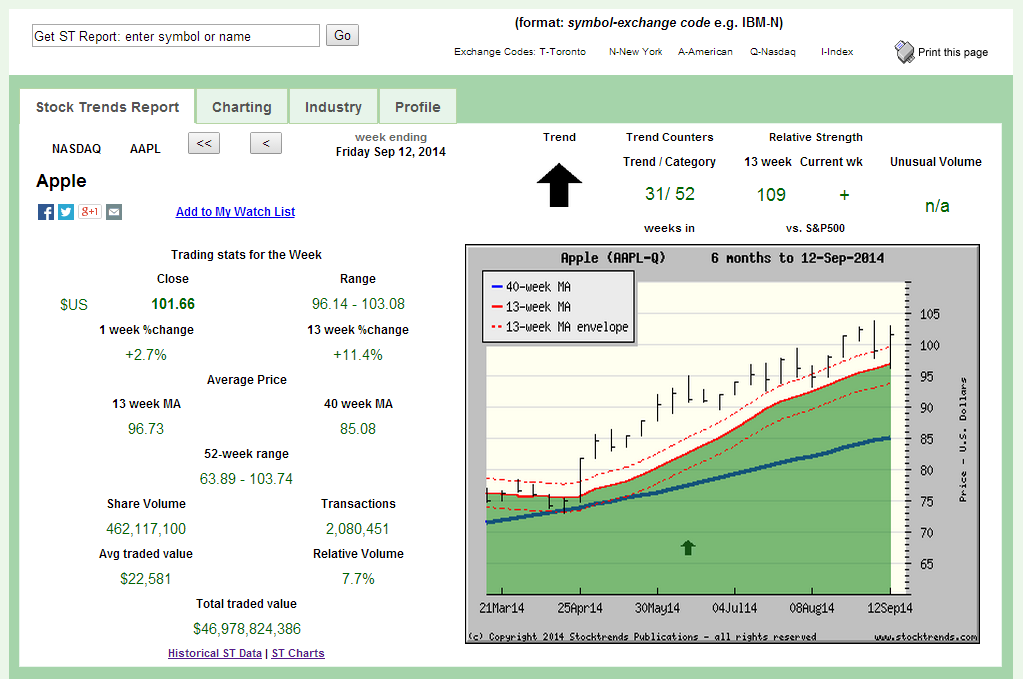 Taken as a composite, these indicators tell us that AAPL is in a relatively solid long-term trend. Given these characteristics of a stock's trend and its length of trend, as well as its price momentum, what does this particular categorization imply about future price movement?
Of course, we cannot precisely know what is to happen in the future. All we can do is look upon what has happened in the past and make some kind of estimation of what will happen in the future. Using statistical methods we can translate past observations of what has happened into a probability statement about what will happen in the future. The Stock Trends Inference Model attempts to do this.
Below is the current Stock Trends Inference Model report found under the Profile tab of AAPL-Q.
The first section shows the Sample distribution plot and estimated returns distribution for three different periods - 4-week, 13-week, and 40-week. In this case the sample - derived from the 30-year history of Stock Trends data - is 616 records of stocks which sported similar Stock Trends Report indicator combinations to the current indicator combination of AAPL. From this sample we are measuring the subsequent price performance over the three different periods.
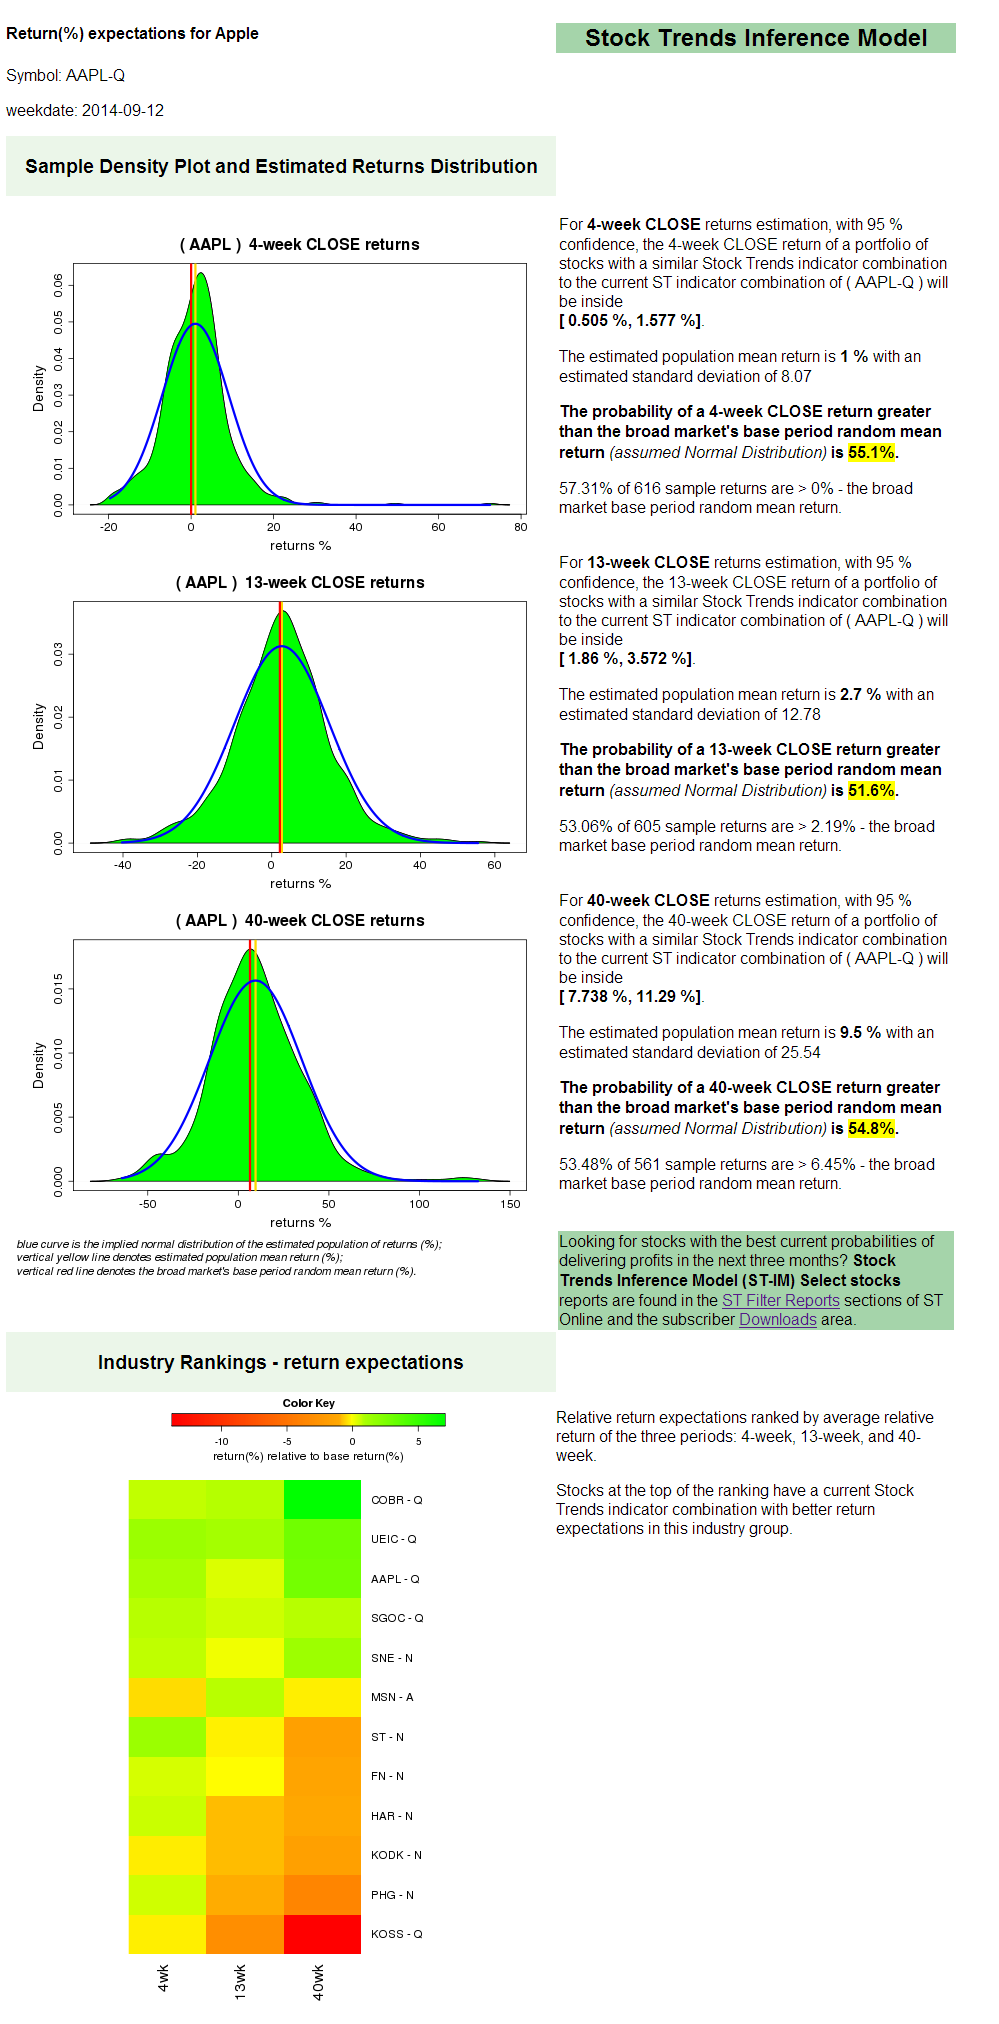 Here we ask of this sample: what kind of returns (%) did other stocks have which previously exhibited similar trend and momentum characteristics as defined by the Stock Trends indicator combination?
The green density plot for each of the three periods is displayed. Each shows how the returns were distributed. This plot shows where most of the returns tended toward (central tendency) as well as the variability of the returns (variance). We are interested in measuring central tendency and variance of the sample because with those statistics we can estimate the average return and variance of the population of all returns associated with this Stock Trends indicator combination. Remember, the population of all returns is much larger than this sample size - it includes returns not in this database. It includes future returns - the returns investors are most interested in!
Using statistical inference methods we can estimate the mean of a population within a certain range, or interval, and we can be certain of that interval to a defined degree. Here our model is 95% certain of the mean intervals. Since we are most concerned about the lowest estimate of the interval, we know that there is only a 2.5% chance that the mean of the population is less than the low end of the interval.
For the investor it is more meaningful to interpret the mean interval of the population as the estimated return of a portfolio of stocks that have the same Stock Trends indicator combination. From this theoretical portfolio we can make another important assumption: that returns of randomly chosen samples, when estimated as the portfolio population, will have a normal, bell-shaped distribution. This assumption is an extension of a well-understood probability theory rule: the central limit theorem.
This assumption - and evidence - of randomness in market returns provides us with a very useful framework for making probability statements about the expected return of a stock. With an estimated population mean and an estimated standard deviation of the distributions we can derive probability statements about observing a return above specific values from a normally distributed sample space.
In short, the Stock Trends Inference Model translates our samples into an estimated return and gives us the probability that a return will better a given benchmark return.
What should that benchmark return be? It's not difficult to see that the base return we should measure against is the return of a randomly selected stock. If we are measuring returns based on the randomness of outcomes of a categorized sample (our Stock Trends indicator combinations), the base return should be the return we would expect if we randomly picked a stock across the broad market. Indeed, any trading system results should be measured against the results of a randomly selected portfolio. If you can't beat the monkey, why bother?
The base period random return benchmarks are as follows: 4-week (0%), 13-week (2.19%), and 40-week (6.45%). Each of these returns are the return means of over 500,000 samples taken at random over a 30-year period. Not surprisingly, the annualized return of randomly selected stocks is basically equivalent to long-term market returns - 8%. This sobering fact should remind market timing traders that no matter what analytical framework used, the returns generated by a buy-and-hold approach must be discounted, regardless of what the market actually provided during a particular period.
I'll be looking at Stock Trends Inference Model analysis in the future, and pointing out ways to turn this analysis into profitable managed trades. Also, I'll be introducing an additional new analysis under the Profile section. It is a pattern recognition analysis that also employs statistical inference. Expect this content addition very soon.
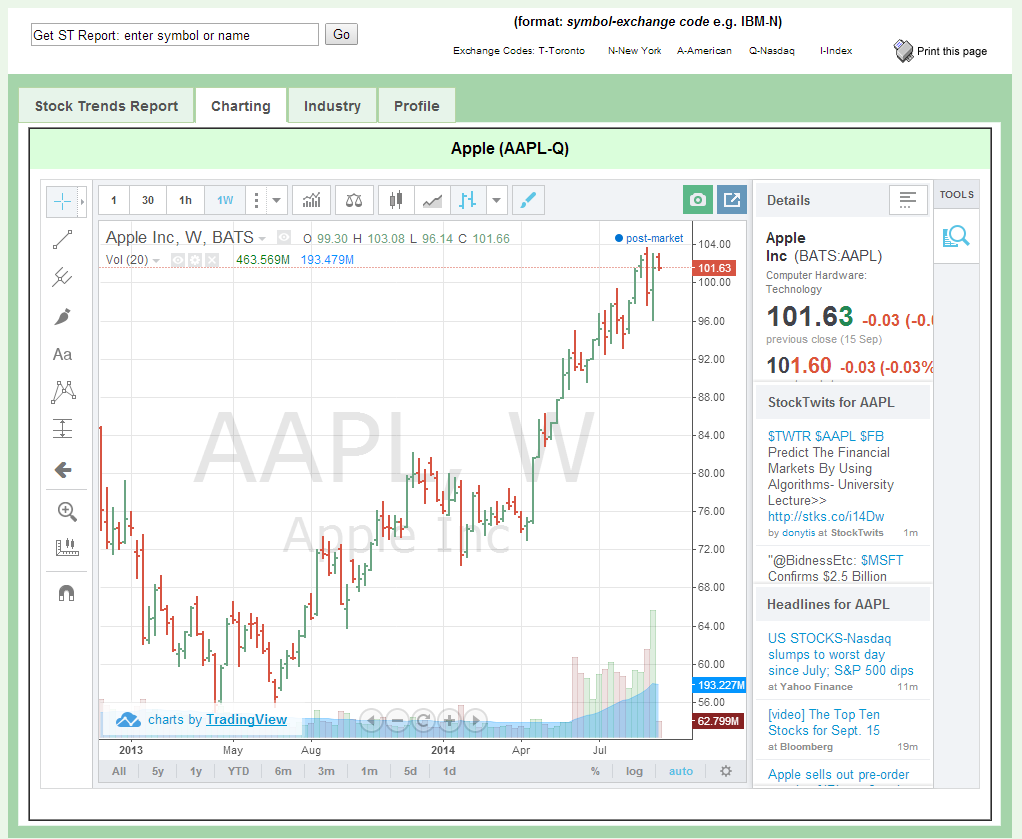
Another recent content addition to the Stock Trends Reports on the website is the charting application. This is a third-party application provided by Tradingview. For subscribers interested in marking up a chart of a given stock, Try it out! It also provides additional content including current intra-day pricing (15-minute delay), recent news headlines, social media comments from StockTwits, as well as technical and fundamental data.
 |
Published in Stock Trends
 Stock Trends analysis quantifies nicely the movement of individual stocks. I’ve found that if the technicals are out of synch with fundamental analysis, it is a wake-up call to make a decision. The Stock Trends Bull/Bear Ratio is useful in identifying major market bottoms and tops. It has always presented a good buying or selling opportunity.


