A principal direction ahead for Stock Trends - quantitative analysis of the Stock Trends Reports - starts to take shape. Statistical analysis unlocks the value of the Stock Trends indicator combinations.
The effectiveness of technical analysis as a trading tool rests on its core assumption that price patterns found in the past repeat in the future. Without this assumption there is little a chart can tell us about the likely direction of a stock’s price. Market technicians like to identify and categorize price patterns across markets, and assert that prices of financial instruments – stocks, currencies, futures, etc. – respond to market forces in similar ways. The interplay of supply and demand is the primary driver of price movement for tradable financial assets. Accordingly, technical analysts generalize about price patterns and assert that they are homogeneous and evident in all markets. In other words, what happened previously to the price of one stock is relevant to another stock that is revealing similar chart patterns. This is a big assumption.
Stock Trends can help us validate aspects of this assumption. Our trend analysis is just one iteration of technical analysis – it focuses on trend as defined by a moving average study and a price momentum indicator. Other classical charting methods are more focused on visible price patterns – head and shoulders, price resistance levels, and internal price and volume oscillators, for example. Given our specific toolset, we can only test for correlation between the Stock Trends indicator observations and subsequent price performance, but with statistical inference we can assign some value to those observations. This can be especially effective when modeling a trading system.
What statistical inferences can we make from sample Stock Trends observations? If a current Stock Trends Report provides a particular combination of trend, momentum, and volume indicators, what do previous observations of similar indicator combinations – across all stocks - tell us about potential subsequent price movement? This is the kind of question we can answer with basic statistical methods.
When we analyse data, generally we are evaluating a subset of a larger population. Typically, it is too costly, too onerous, or impossible to gather data for an entire population. In some cases the population is theoretical – it represents every record of an event possible, whether actually recorded or not. For our purposes the population we are attempting to infer from our samples of Stock Trends observations is the population of a statistic of every like observation possible. For instance, last week’s observation of Apple Inc. (
AAPL-Q) is:
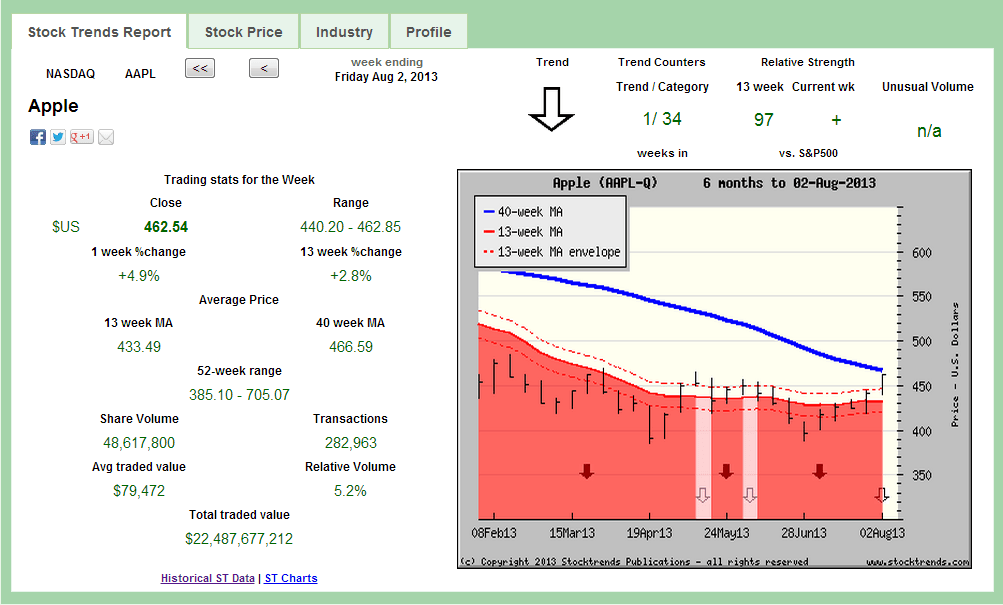
What would be the average or mean performance of all stocks that had similar trend (

), trend counters, momentum (RSI near the value of 97 and RSI + for the current week) and volume indicator (no high or low volume indicator)? This would include not only the sample of like observations in our North American equity database (30-years of weekly observations – over 7-million), but also of observations not yet made and observations prior to 1980. Depending on the observation, each Stock Trends Report could have thousands of like indicator combinations in the sample, a few hundred – or just a handful. Most of these samples are large enough to provide a quantifiable glimpse of the population of similar observations. We can infer from the samples and build a probability model for future period returns.
The relevant statistic we are looking to estimate is the mean population price return over three different periods, post-observation: 4-week, 13-week, and 40-week. When making inferences about a population statistic, we can estimate within a defined confidence interval. Our samples can help us estimate the confidence interval. For instance, in the current AAPL Stock Trends Report we can find the following:
There are 703 observations similar to the current Apple indicator combination – where a stock has the same Stock Trends indicator, similar trend counters (for both the major and the minor trend), similar relative price performance (RSI), similar volume indicators and RSI +/- indicators, as well as similar relative trend lines. Let’s look at a couple of these records in the sample:
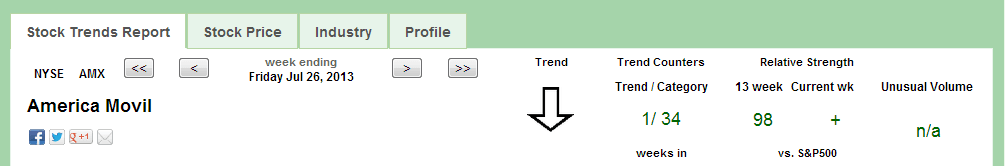
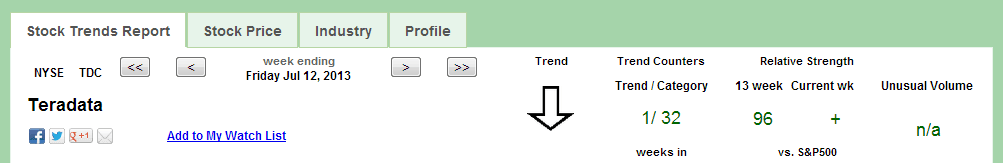
Recent ‘like’ observations include America Movil (AMX-N) on July 26, Teradata (TDC-N) on July 12, and Logitech International (LOGI-Q) on June 7. Each of these particular Stock Trends Reports, as with all events of the sample, exhibited very similar chart patterns in terms of trend, trend length, and relative price movement. In sampling the data history for these like observations we want to know if the performance of the stocks over subsequent periods differs from the statistical norm.
Expected returns of randomly selected stocks – the statistical norm
It should be understood that the statistical mean (average) return of a stock, randomly chosen, over different periods has the following profile: in the short term, including up to 4-weeks, the price performance expectation is zero; over the intermediate and longer term the price performance expectation matches the annualized return of the market benchmark indexes. I have taken significantly large random samples across three decades, some 500,000 issues, and measured returns over 4-wk, 13-wk, and 40-week periods. The summary results of these returns are not surprising:
Random Samples
Confidence intervals of mean return (%) at periods 4wk, 13wk, and 40wk
| 4-week interval1 |
?4-week interval2 |
?13-week interval1 |
?13-week interval2 |
?40-week interval1 |
?40-week interval2? |
| -0.13 |
0.03 |
2.09 |
2.30 |
6.27 |
6.64 |
The 4-week mean (average) return is a wash, the 13-week mean return is 2.2%, and the 40-week return is 6.4% (midpoints of the confidence intervals). If an investor randomly chose a sample of several stocks at multiple different moments over the past 30-years and held them for at least three months, the annualized return would essentially be the same as if he or she had invested in a market index fund.
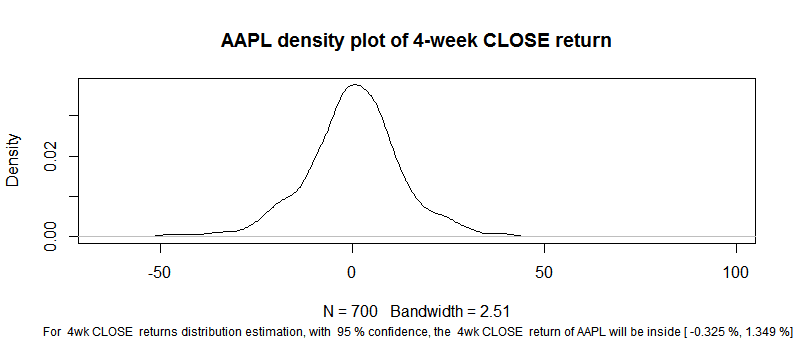
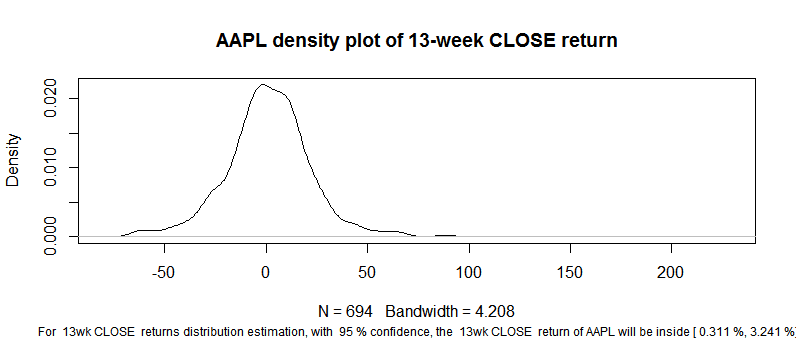
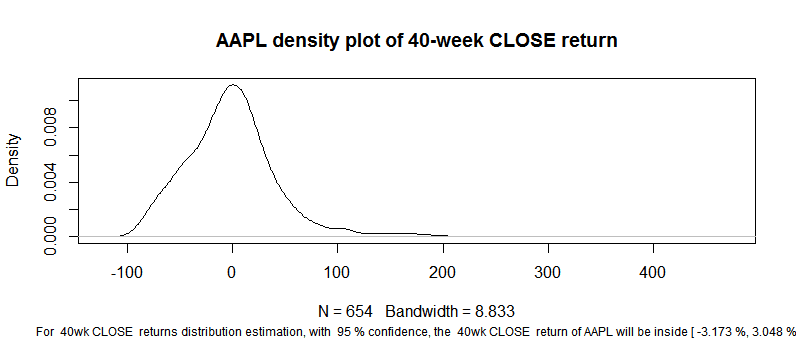
Obviously, it only makes sense to actively trade if the probable outcomes are superior to the market returns. How does the probable outcome for AAPL at August 2 compare? The distribution of returns (from the sample of like observations) and population mean confidence interval (with a 95% level of confidence) look like this:
The confidence intervals of the mean return suggests that AAPL can be weighted to return marginally above or below the market in the next 4-weeks and 13-weeks, but weighted to return below the market at the 40-week mark. The distribution of the sample returns, as represented by the density plots, is approaching normal, and we assume a normal bell distribution for the population of stocks. From this assumption of a normal distribution we can also make estimates of the probability that a stock will return above a certain level – say 10% - over the next period. (However, we will return this element of the model in another editorial.)
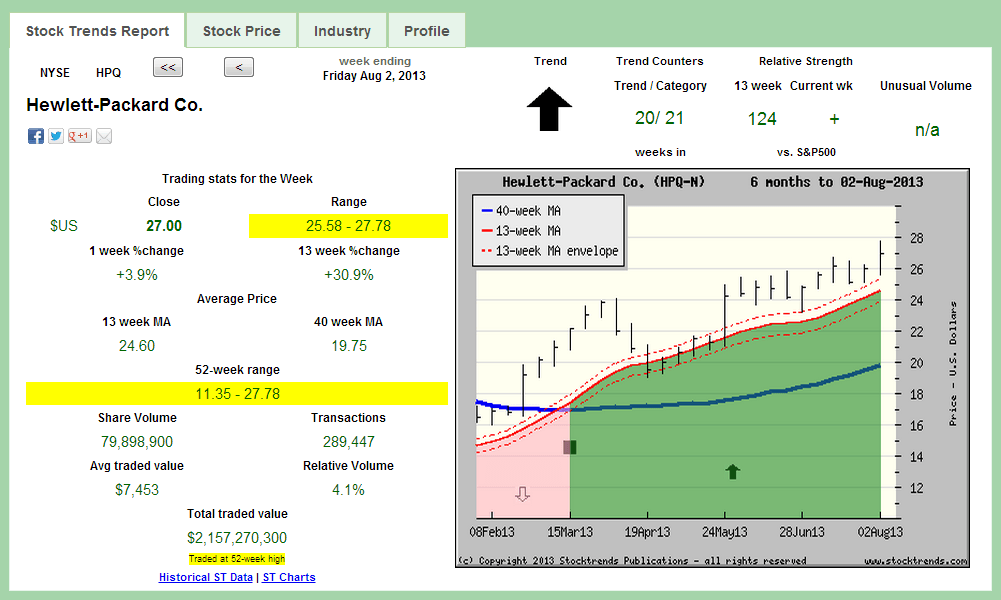
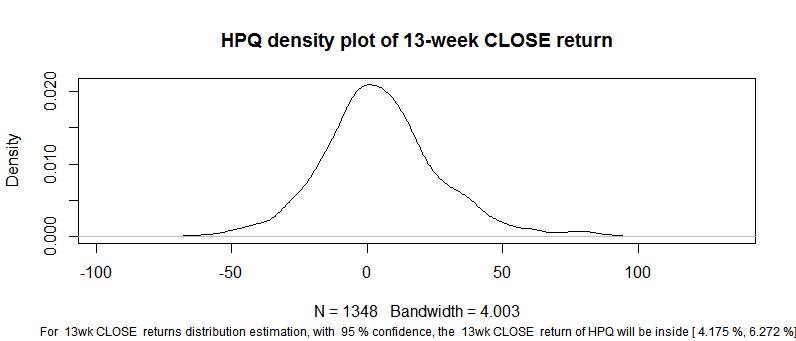
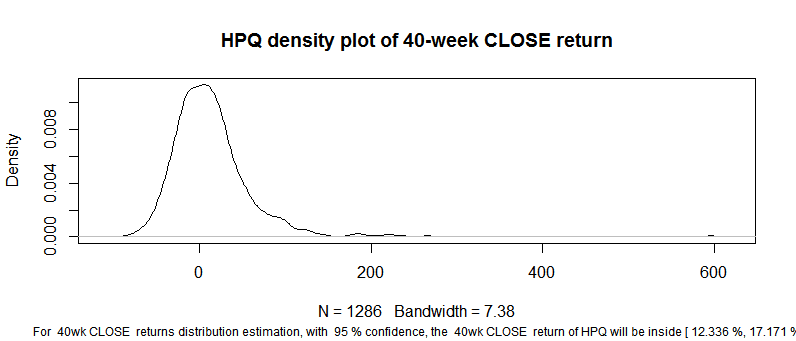
Another tech stock example presents a different potential outcome. Hewlett-Packard (
HPQ-N) is currently in its 21
st week of a Stock Trends Bullish trend category. In the Stock Trends database there are 1,413 observations of indicator combinations similar to HPQ’s current Stock Trends Report.
Hewlett-Packard HPQ - sample
Confidence intervals of mean return (%) at periods 4wk, 13wk, and 40wk
| |
|
|
|
|
4wk1 |
4wk2 |
13wk1 |
13wk2 |
40wk1 |
40wk2 |
| HPQ |
0.8 |
1.9 |
4.2 |
6.3 |
12.3 |
17.2 |
| market discount |
-0.1 |
0.0 |
2.1 |
2.3 |
6.3 |
6.6 |
| return above discount |
0.9 |
1.8 |
2.1 |
4.0 |
6.1 |
10.5 |
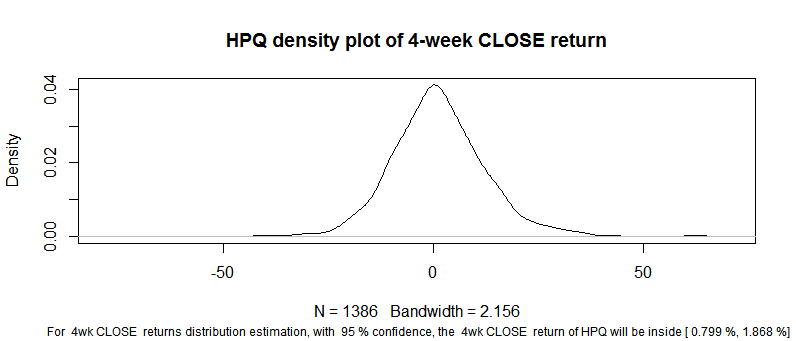
Here the return expectations, statistically, are above market performance for all three time-periods. Indeed, HPQ is currently one of the top-ranked large capitalization stocks in terms of performance expectations based on statistical inference of Stock Trends analysis. Other stocks that are currently exhibiting Stock Trends indicator combinations that have above-market performance as ranked by our statistical inference model include Baidu (
BIDU-Q), Chevron Corp. (
CVX-N), Micron Technology (
MU-Q), Coca-Cola (
KO-N), Western Digital (
WDC-Q), Norfolk Southern (
NSC-N), Priceline.com (
PCLN-Q), Whole Foods Market (
WFM-Q), Boeing (
BA-N), and American Express (
AXP-N).
In the future Stock Trends will be ranking these performance estimates, adding weekly Select Picks, and building new model portfolios based on these parameters of quantitative analysis. The next editorial will look deeper into what our statistical inferences imply.

 I am just writing to tell you of my appreciation of your service! It makes so much sense to me. You seem to be an oasis of stability and sensibility in a stockmarket jungle.


