|
Finding the right combination of indicators is an important launching point for technical traders. Fine tuning different charting constructs, different momentum and trend indicators and back-testing results - that's the life of many market timers. Indeed, optimizing indicators and trading systems is a growing part of the investment business, as much with wealth management institutions as among the many retail traders who live by the success of their algorithms. In its own way, Stock Trends is part of this movement toward quantitative trading.
Most quantitative trading runs through finely tuned statistical models that guide both trading systems and portfolio management. The Stock Trends analysis is more static in terms of the indicators used, but seeks to optimize applied trading systems within the given parameters. The toolset used here is basic: a moving average study, a momentum indicator, and a volume trigger. But together these elements provide a powerful - and simple - means of engaging the market on a quantitative level. Each report Stock Trends publishes can be used within the framework of a trading system.
Optimizing results through statistical modelling is a multi-step process. The first thing that must be achieved is to understand your data. It is important to be able to describe its characteristics and to determine the independent and dependent variables. I have started that process in recent editorials by generating some statistical output of the Stock Trends data. The next step is to break down those descriptive statistics by category. Each subset of data that is pulled from the data history can be grouped and assessed for differences in results of the output variable - namely, the post-observation performance of individual stocks or ETFs, or the probable outcomes based on statistical predictive models.
With a given combination of Stock Trends variables, for instance, are there sub-groups that have different characteristics. We can seek to ask questions like: what are the differences in central tendencies and the distribution of results for low priced stocks compared to high priced stocks? Does price momentum propel small cap stocks higher compared to large cap stocks? Do certain sectors perform better for the momentum trader? There are many of similar questions we can evaluate, and all would be important ones to answer when developing a trading model.
Building on last week's editorial, let's take another sample of the Stock Trends data and see what it can tell us about different categories of stocks. Of particular interest is whether we can identify any divergence of performance statistics between stocks based on their share price and the Relative Strength indicator. The Stock Trends Picks of the Week report provides an interesting sample of the data for discovery of important relationships between the variables. Last week we looked at statistics of the entire sample; here we group the data and compare results.
Again taking a sample of Picks of the Week selections since the beginning of 2012 until February 8,2013 we can create new categories for the share price and Relative Strength indicator and group by ranges.
Share price ranges
$2.00 - $4.99
$5.00 - $9.99
$10.00 - $19.99
$20.00 - $49.99
$50 - max($800)
Relative Strength Indicator (RSI) ranges:
100-104
105-109
110-119
120-149
150-max(800)
These groupings are arbitrary, and not based on any statistical method to create bins (groups). Nevertheless, they help us categorize the data in terms or ranges that are easy to understand.
So how do the statistics for the percentage change in price (to the current end date, February 22, 2013) break out for these groupings?
Below is a table, ranked by median percentage change of the groups (median represents the middle value of observations). It gives us a breakdown of the number of observations, as well as some important metrics of central tendency and distribution of results.
| price group($) |
RSI group |
number |
mean |
standard deviation |
median |
trimmed mean |
min |
max |
range |
skew |
kurtosis |
| (20,50] |
(150,800] |
29 |
15.57 |
40.68 |
14.70 |
14.50 |
-69.60 |
117.10 |
186.70 |
0.27 |
-0.22 |
| (50,800] |
(99,105] |
380 |
8.40 |
14.55 |
8.25 |
8.24 |
-71.80 |
102.20 |
174.00 |
0.39 |
8.74 |
| (20,50] |
(110,120] |
698 |
8.70 |
22.40 |
7.40 |
8.05 |
-70.10 |
172.40 |
242.50 |
0.97 |
6.46 |
| (10,20] |
(120,150] |
404 |
9.46 |
31.83 |
7.30 |
8.03 |
-75.90 |
138.20 |
214.10 |
0.65 |
1.43 |
| (50,800] |
(105,110] |
264 |
6.99 |
16.82 |
6.90 |
7.51 |
-49.60 |
58.00 |
107.60 |
-0.29 |
0.69 |
| (20,50] |
(105,110] |
561 |
7.88 |
17.68 |
6.80 |
7.53 |
-57.00 |
110.30 |
167.30 |
0.60 |
4.30 |
| (20,50] |
(99,105] |
701 |
8.40 |
15.95 |
6.50 |
7.59 |
-50.00 |
101.00 |
151.00 |
0.67 |
3.85 |
| (50,800] |
(110,120] |
311 |
7.95 |
19.35 |
6.30 |
7.54 |
-44.70 |
106.80 |
151.50 |
0.49 |
2.09 |
| (10,20] |
(110,120] |
420 |
7.15 |
26.35 |
6.10 |
6.55 |
-98.30 |
156.80 |
255.10 |
0.59 |
3.68 |
| (5,10] |
(105,110] |
118 |
6.37 |
30.66 |
5.75 |
4.66 |
-91.20 |
150.00 |
241.20 |
1.26 |
5.40 |
| (50,800] |
(120,150] |
110 |
7.53 |
25.55 |
5.75 |
7.38 |
-55.90 |
62.50 |
118.40 |
0.00 |
-0.07 |
| (10,20] |
(105,110] |
287 |
6.96 |
21.31 |
5.20 |
6.57 |
-64.00 |
104.10 |
168.10 |
0.36 |
2.43 |
| (10,20] |
(99,105] |
323 |
6.65 |
20.78 |
4.80 |
5.97 |
-98.30 |
96.40 |
194.70 |
0.14 |
4.63 |
| (5,10] |
(110,120] |
269 |
9.23 |
34.14 |
4.30 |
7.39 |
-92.00 |
127.10 |
219.10 |
0.61 |
1.08 |
| (5,10] |
(99,105] |
123 |
5.41 |
18.46 |
4.10 |
4.83 |
-58.00 |
89.40 |
147.40 |
0.84 |
4.67 |
| (20,50] |
(120,150] |
390 |
6.68 |
30.64 |
3.75 |
4.49 |
-71.00 |
168.10 |
239.10 |
1.30 |
4.43 |
| (5,10] |
(120,150] |
336 |
3.46 |
33.31 |
1.20 |
1.38 |
-89.40 |
142.60 |
232.00 |
1.02 |
2.96 |
| (1.99,5] |
(105,110] |
59 |
6.96 |
34.59 |
0.00 |
3.97 |
-65.10 |
114.70 |
179.80 |
1.01 |
1.21 |
| (1.99,5] |
(99,105] |
59 |
5.85 |
32.02 |
-1.10 |
1.87 |
-41.70 |
120.20 |
161.90 |
1.60 |
3.13 |
| (1.99,5] |
(110,120] |
147 |
4.31 |
44.33 |
-1.80 |
0.84 |
-85.60 |
277.70 |
363.30 |
2.05 |
9.51 |
| (5,10] |
(150,800] |
77 |
5.65 |
66.87 |
-2.00 |
-3.09 |
-79.90 |
352.40 |
432.30 |
2.38 |
8.75 |
| (1.99,5] |
(120,150] |
289 |
7.89 |
53.54 |
-3.00 |
1.69 |
-88.80 |
228.10 |
316.90 |
1.33 |
2.46 |
| (10,20] |
(150,800] |
54 |
0.31 |
61.09 |
-4.50 |
-3.51 |
-95.10 |
176.40 |
271.50 |
0.68 |
0.30 |
| (1.99,5] |
(150,800] |
170 |
6.12 |
62.25 |
-4.70 |
-1.92 |
-84.90 |
501.80 |
586.70 |
3.43 |
22.18 |
| (50,800] |
(150,800] |
8 |
14.75 |
58.73 |
-14.05 |
14.75 |
-38.60 |
109.20 |
147.80 |
0.59 |
-1.58 |
As with most tables, the first thing that jumps out is the extreme values. In particular, at the bottom half of the rankings are stock picks that had share prices between $2 and $5, across RSI values. The Picks of the Week report during the period was least populated by stocks in this price range. It is clearly the most variable price group, and also the poorest performing as shown by the low values for the median and trimmed mean (trimmed mean here excludes the top and bottom 10% of observations).
However, with variability also come the outliers - those observations we trim in statistical analysis. In the statistical world outliers are problematic. For some traders, it's their holy grail. It's the grand slam home run they celebrate. Here it would include the 500% gain on the November pick of Novogen Ltd. (NVGN), or the 277% gain of the January 2012 Santarus Inc. (SNTS) pick - among a number of other very profitable trades.
Nevertheless, when modeling a trading system it is always most important to understand the risk-reward balance. Attempting to capture higher returns on individual trades can be self-defeating. It is far better to model a system that keys on more predictable results, with low variability and a distribution that offers the best chance of long-term profits. The groupings in the top half of the table presented here would represent the more controlled parameters.
Below is a plot that compares the mean (average) percentage change in price for Picks of the Week in the sample (with a 95% confidence interval represented by the vertical bar). Also presented are Box Plots that give a visual representation of the distributions of the percentage change in price by Stock Trends RSI category range for each share price grouping.
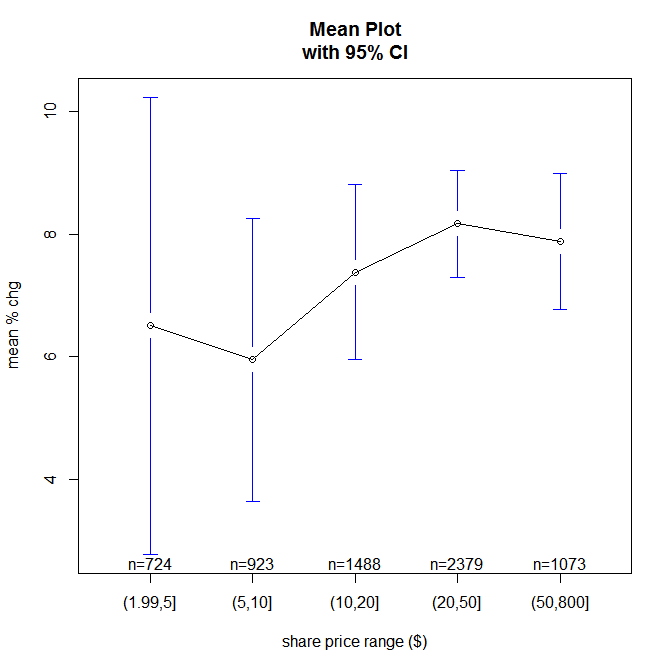
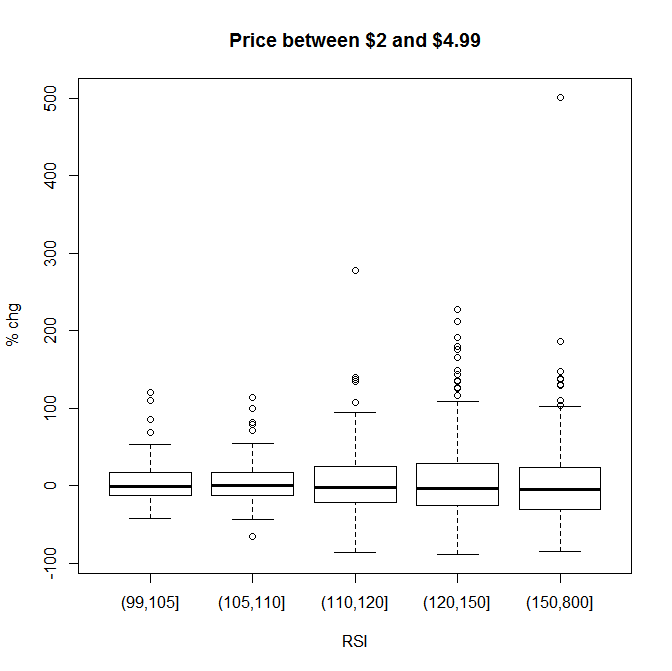
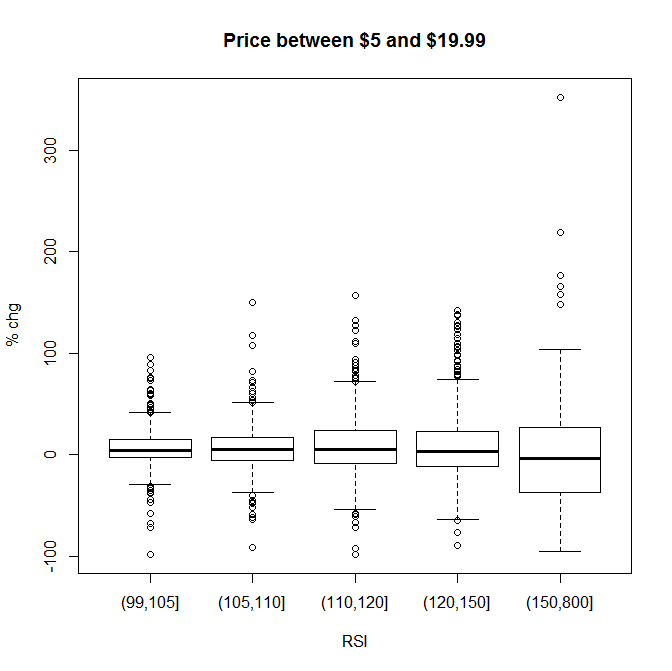
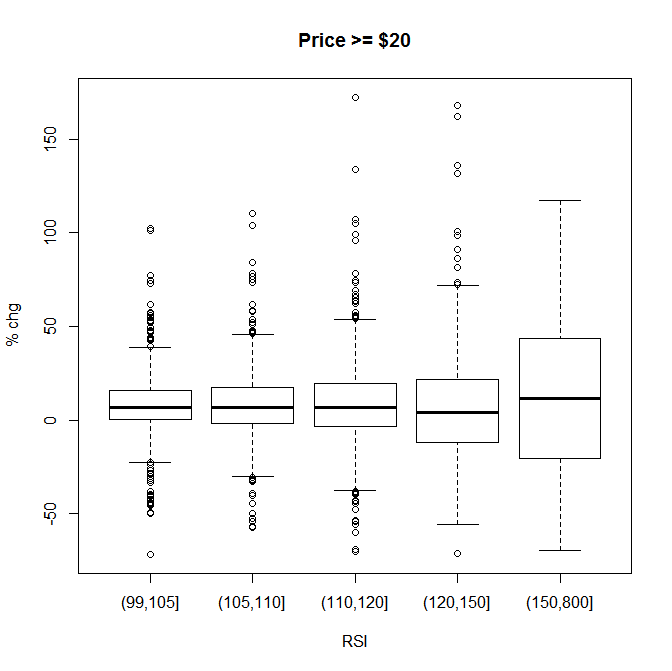
Based on this sample of data we could focus on certain price and RSI ranges when evaluating the Picks of the Week report. For instance, we notice that relatively higher priced shares with high price momentum (high RSI values) performed better. More generally, though, it seems that stock picks with a share price above $20 provide the most consistent results. If we take a subset of the Picks of the Week sample with share price >= 20, we find the following distribution:
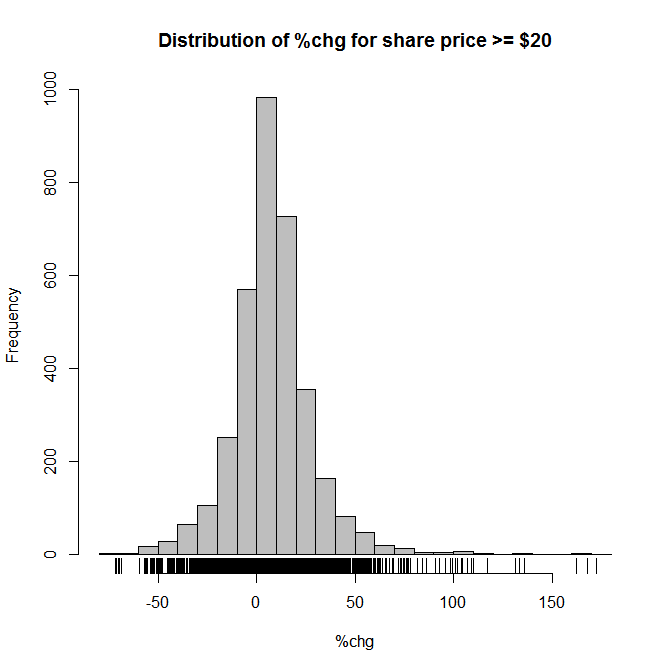
If we limit our analysis to Picks of the Week with a share price of $20 or greater, what kind of performance could we expect? Assuming that an investor could randomly select 5 different Picks of the Week over the period, the statistical breakdown is as follows:
This distribution is for 1000 random samples of 5 Picks of the Week, share price >= $20. Here we can see that the distribution is closer to a normal, bell-shaped distribution.
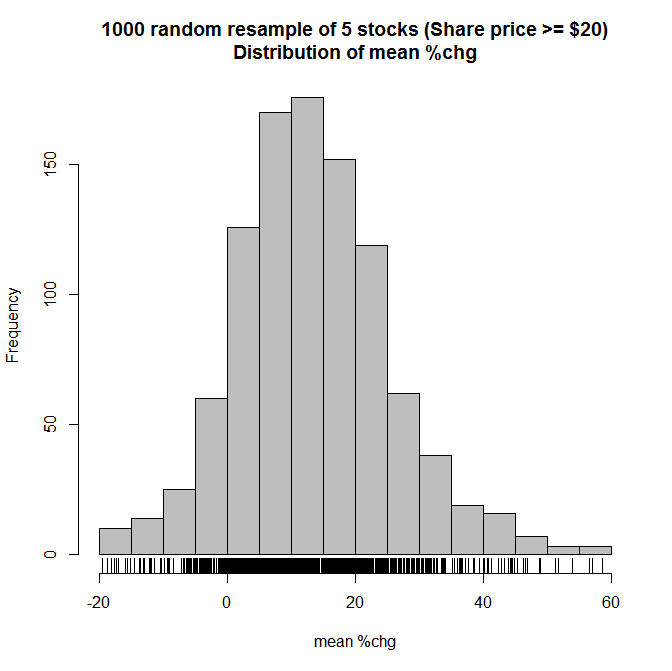
| Minimum |
1st Quartile |
Median |
Mean |
3rd Quartile |
Maximum |
| -19.5 |
5.845 |
12.77 |
13.52 |
20.76 |
58.70 |
| number |
mean |
standard deviation |
median |
trimmed mean |
minimum |
maximum |
range |
skew |
kurtosis |
| 1000 |
13.52 |
12.01 |
12.77 |
13.11 |
-19.50 |
58.70 |
78.20 |
0.39 |
0.75 |
These descriptive statistics of categories are just a starting point. We should also take other samples of the Picks of the Week data. This simple analysis is presented to show that the RSI indicator can be modeled in different ways to optimize on specific variables. In order to develop a trading model we need to delve deeper into the variance and correlation of the Stock Trends indicators as well as other market data variables like trading volume.
This particular exercise, though, helps us look at the Picks of the Week report (which is a specific sample of stocks that exhibited a particular combination of Stock Trends indicators) more constructively in terms of quantitative trading. Although there are levels of charting analysis that help pinpoint technically attractive trades within the Picks of the Week report, systematic traders should understand the importance of discovering the variable constraints that correlate with minimizing variance in trading results. In particular, we can learn how the Stock Trends indicators can guide us toward developing effective trading systems.
|
 Stock Trends information is part of the base information I review before making a trade.


