Divergences in Sentiment

  • 01 June 2012 |
  • Written by  Skot Kortje, Stock Trends Analyst
  • font size
  • Print

When has a market bottomed? Technicians look for divergences. Ed Carlson, CMT briefly explains how divergences in trading volume spikes can indicate a true bottom has been made.

Divergences in Sentiment

Everyone seems to be in on the ‘sentiment game’. Even non-technicians talk on CNBC and Bloomberg T.V. these days about throwing in the towel, capitulation, and washouts as if it’s something everybody watches and not just technicians. For the uninitiated the idea is that once sentiment (crowd psychology) has moved too far to one extreme (bearish or bullish) that the sentiment pendulum will then swing in the other direction. Call it reversion to the mean or what you will, it is a phenomenon which seems to hold throughout the human experience and the natural world. The ‘trick’ is to quantify an otherwise qualitative turn of events.
 
Tool Box
 
The most popularly quoted sentiment gauges are the CBOE Put/Call ratio, the American Association of Individual Investors (AAII) Sentiment Survey, and the Investors Intelligence Advisors report. Rydex funds and other mutual fund and ETF families make their assets under management data publically available so traders and investors can see the flow of funds in and out of their funds; too much money coming in? Contrarians believe investors have become too bullish and it may be time to get bearish.
 
Getting the information is the first challenge. Investors Intelligence charges for their insights. With the exception of AAII, even the free info isn’t exactly easy to access and users earn what they end up with given the effort required to find, download, and manipulate the data into a usable format. But once the data is found, downloaded, and charts created, is a determination of extreme levels all that is involved in getting the most from this fairly sophisticated dataset? On a short-term basis, perhaps. But what if you were looking for a signal of something more substantial? What if, just perhaps, you were looking for the end to a sell-off in equities. Perhaps this sell-off endured for the entire month of May and you’re wondering if the next substantial bounce will mark the end or be just a bounce followed by lower lows. Would a simple spike in bearish sentiment be sufficient to call a bottom? The bad news is no. The good news is it’s not much more complicated than that as long as you know what to look for. The even better news is that one of the best indicators available is probably one you’re already looking at every day!
 
Divergence is a tool
 
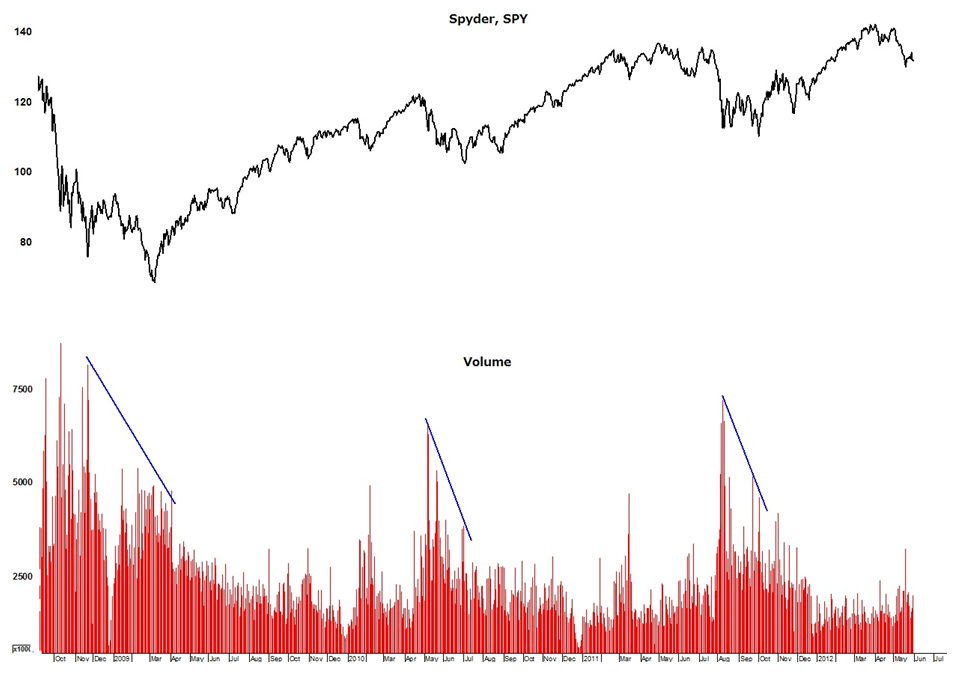
The exchange traded fund SPY represents the most widely traded and most liquid market in the world, the S&P 500. If a trader isn’t watching this index and ETF, he probably isn’t reading this article. Volume spikes typically occur at bottoms and represent a form of capitulation. But here’s what technicians know; the biggest spikes may be bottoms but rarely represent “the” bottom in a market sell-off. Final bottoms are reserved for divergences.
 
Divergences are an important tool in the technicians’ tool box. Divergences are looked for in all sorts of indicators; most often in the Relative Strength index [here referring to Wilder's RSI, which differs from the comparative Relative Strength indicator Stock Trends employs]. But when it comes to looking for capitulation a divergence in volume is an important signal to technicians.
Notice in the chart of the SPY below that since the 2009 low, “a” bottom was usually printed on a day that saw a spike in volume. But “the” bottom that most were looking for was found on a day on which volume spiked, but to a lower level. This is called a divergence and an important signal to look for when looking for the bottom in a market rout.


Biography


Ed Carlson, author of George Lindsay and the Art of Technical Analysis, is an independent trader, consultant, and Chartered Market Technician (CMT) based in Seattle, Washington. Carlson hosts the MTA Podcast Series: Conversations and is a contributor to Technical Analysis of Stocks and Commodities and SFO Magazines. He also manages the website Seattle Technical Advisors.com, where he publishes daily and weekly commentary. He spent twenty years as a stockbroker and holds an M.B.A. from Wichita State University.


back to top

Subscriber Testimonials

  • I want to thank you for posting such an excellent guide to technical analysis on the web. You have provided a great service to all of us novice investors.

    Michael C., Stock Trends user
  • Thank you for your excellent work and kind approach to your customers.

    Odette C., Subscriber

  • There is a lot to be gained from comparing trends of how individual stocks are doing within a sector, as well as how the sector is performing relative to the broad market.

    Dudley R., Subscriber

  • Your report is an impressive, excellent tool and I have recommmended it to friends.

    Colin E., Subscriber

  • I very much like the systematic approach to analyzing stock data, it fits my approach.

    Subscriber
  • I am fascinated with your service and methodology - it is very impressive. [...] Over the years I have concluded that there are many ways to approach stock investing, but once one has chosen a path, one is better off sticking to it.

    Bob E., Subscriber

  • I am something of a momentum investor. I find Stock Trends useful as I can look at my portfolio as a “watch list” and quickly see where trends are declining in strength or reversing, so it is particularly useful as a tool in portfolio management regarding sales.

    William C., Subscriber
  • An admitted cynic, it's obviously very high praise when he says he likes StockTrends because of its "simplicity, utility, openness, [and] honesty," and in addition to having "no hidden agenda" is "understandably documented [and] historically verifiable." And, he adds, "It lets me see a lot of things without doing a lot of work." Globe and Mail

    Paul W., Subscriber

  • Stock Trends information is part of the base information I review before making a trade.

    Subscriber
  • I've followed your recommendations since reading your columns in the Globe & Mail, and finding they published Stock Trends arrows in their financial listings. I do find them a guide to the general market and what I should be avoiding for declining chart trends.
    Has probably saved me the subscription by not rushing into hot stocks!

    Anthony D., Subscriber
  • I am just writing to tell you of my appreciation of your service! It makes so much sense to me. You seem to be an oasis of stability and sensibility in a stockmarket jungle.

    Adrian S., Subscriber

  • Stock Trends Weekly Reporter is an easy way to pick up equities that represent an upward trend.

    Subscriber
  • Hence, anyone who had followed the "Stock Trends" line should have sold their Bre-X shares and, with the windfall, paid for a lifetime subscription to The Globe and Mail and more. Talk about return on investment!

    Muni P., Subscriber

  • I have had the good fortune to be reasonably successful and enjoy the investment process. Your process would be recommended for both experts and those who are new to investing.

    Frank I., Subscriber
  • I find your website and research very helpful in my stock trading. I have subscribed to several related services in the past and none present their work with “just the facts” as you. Please keep up the great work so that I can continue to learn! 

    Bryan E., Subscriber
  • I use Stock Trends to help direct my stock picks. Also, following the advice of Stock Trends I have religiously used stop-loss orders and have avoided hanging on to losing stocks for emotional reasons.

    John B., Subscriber
  • You have created and maintained an amazing, highly educational program and I am grateful for your part in getting our retirement funds to the good place they are.

    Karin M., Subscriber
  • Stock Trends analysis quantifies nicely the movement of individual stocks. I’ve found that if the technicals are out of synch with fundamental analysis, it is a wake-up call to make a decision. The Stock Trends Bull/Bear Ratio is useful in identifying major market bottoms and tops. It has always presented a good buying or selling opportunity.

    Charles G., Subscriber
  • Just thought I'd call to thank you, Skot. Stock Trends Weekly Reporter helped pay for my daughter's education!

    Peter H., Subscriber

  • I've followed a number of Stock Trends picks, and the methodology is solid.

    Doug B., Subscriber

Subscription Plans

Subscription Plans

STWR - Monthly

$19.95

Monthly subscription plan to Stock Trends Weekly Reporter - pay your monthly subscription fees by having them automatically charged (PayPal only). Free 7-day trial period. Subscribers may cancel before the end of any subscription month.

STWR - 1 Year Prepaid Subscription

$199.00

1 Year Prepaid subscription to Stock Trends Weekly Reporter. Save 16% off monthly rate!

STWR - 2 Year Prepaid Subscription

$299.00

2 Year Prepaid subscription to Stock Trends Weekly Reporter. Save 37% off monthly rate!

STWR - 3 Year Prepaid Subscription

$399.00

3 Year Prepaid subscription to Stock Trends Weekly Reporter. Save 44% off monthly rate!

Stock Trends Editorial

  • When Headlines Darken but the Probability Structure Holds
    When Headlines Darken but the Probability Structure Holds The recent Stock Trends editorials argued that hard assets had become structural leaders and that capital was rotating across themes rather than collapsing into a simple risk-on or risk-off binary. This week’s data adds a new layer. The market’s probability structure has improved even as the macro headlines have become more hostile. That is a distinct signal, and it is coming directly from the Stock Trends Inference Model.
    14 March 2026 Read more...
  • War, Inflation, and Rotation: What Stock Trends Reveals After the Middle East Shock
    War, Inflation, and Rotation: What Stock Trends Reveals After the Middle East Shock This week's market headlines have been dominated by war, oil, and inflation fears. However, the Stock Trends context indicates that this is not a broad liquidation. It is a disciplined rotation into sectors tied to scarcity, resilience, and security. Markets do not move from a blank slate. They rotate, they re-price, and they reveal where capital was already preparing to move before the headlines become obvious. This past week’s escalation in the Middle East has undeniably shaken investor confidence, but the latest Stock Trends dataset suggests that the deeper message is not indiscriminate panic. It is a reordering of leadership.
    07 March 2026 Read more...
  • Not Risk-On. Not Risk-Off. Rotation.
    Not Risk-On. Not Risk-Off. Rotation. Not Risk-On. Not Risk-Off. Rotation. In our recent editorial, The Hard Asset Regime Is Not a Trade — It’s a Structure, we examined the persistent leadership emerging in gold and materials and argued that real assets were no longer functioning as short-term hedges, but as structural participants in the market. The current Stock Trends dataset extends that thesis — but in a different direction. The 13-week ST-IM probability model is no longer pointing to a narrow leadership cluster. It is identifying a market redistributing capital across multiple durable themes simultaneously. This is not a simple “risk-on” environment. It is not a defensive “risk-off” retreat. It is rotation.
    02 March 2026 Read more...
  • The Hard-Asset Regime Is Not a Trade — It’s a Structure
    The Hard-Asset Regime Is Not a Trade — It’s a Structure Markets rarely move randomly. They rotate. They reallocate. They transition from one leadership regime to another. And when that transition is real, it shows up not in headlines — but in breadth. This week’s Stock Trends universe reveals something decisive. When we measure common stocks only (removing ETFs that duplicate underlying holdings), two sectors stand apart: Materials and Energy.
    21 February 2026 Read more...
View all Stock Trends Editorials


Subscription Plans

STWR - Monthly

$19.95/Month

Monthly subscription plan to Stock Trends Weekly Reporter - pay your monthly subscription fees by having them automatically charged (PayPal only). Free 7-day trial period. Subscribers may cancel before the end of any subscription month.

STWR - 1 Year Prepaid Subscription

$199/Year

1 Year Prepaid subscription to Stock Trends Weekly Reporter. Save 16% off monthly rate!

STWR - 2 Year Prepaid Subscription

$299/2 Years

2 Year Prepaid subscription to Stock Trends Weekly Reporter. Save 37% off monthly rate!

STWR - 3 Year Prepaid Subscription

$399/3 Years

3 Year Prepaid subscription to Stock Trends Weekly Reporter. Save 44% off monthly rate!