Everyone seems to love Apple. But maybe not so much now. It's stock is now a Bearish Crossover ( ). Investors should be aware what this "Death Cross" implies for future downside risk.
Quantitative trading is not for everyone. Modeling a trading system based on defined variables – the most elemental version of the quant approach – means that the practitioner has the acumen and the means to parse the market dynamic into a simplified framework. Of course, the market is organic and the variables that affect it are numerous and complex in their factor influence. It can be a daunting task to execute a trading plan based on even the simplest of models. Worse, after rigorously back-tested success, the returns on a model’s outcome in live environments can be disappointing. This all points to a maxim in any endeavour: love what you are doing, because sometimes it doesn’t love you back.
But just because a task can seem daunting does not mean the fruits are not worth the toil demanded. History is a valuable instructor. Stock Trends has been published for just shy of 20-years now. The data population includes over 7-million observations – each Stock Trends Report published on the website, every week, is an observation. The ST Reports tell us what values the different indicator variables have been assigned. We can learn from this history.
For instance, this week
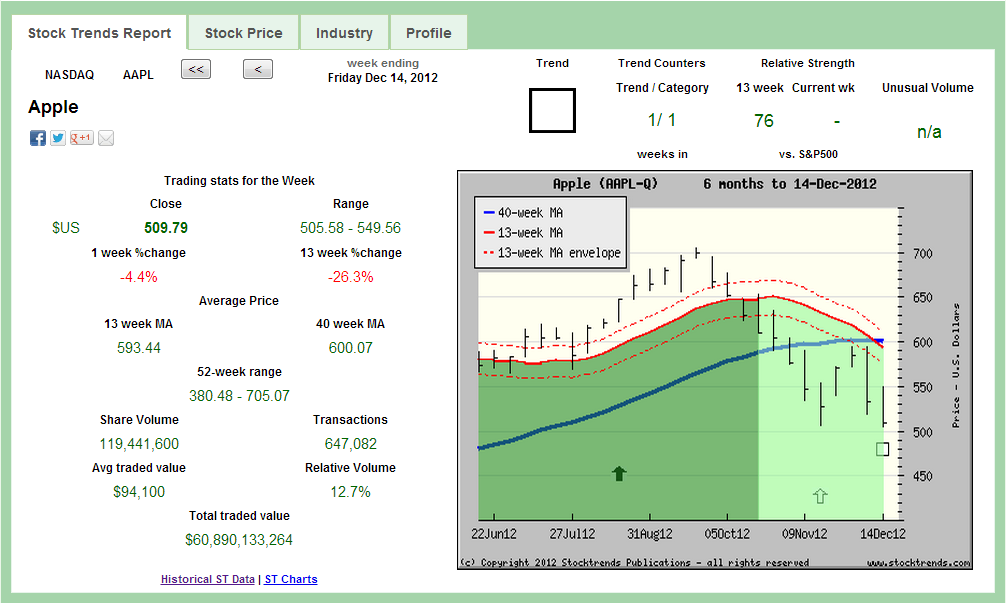
Apple’s flagging stock offers a good starting point.
In one sense these values – the trend indicator and its counters, the Relative Strength indicators, the volume indicator – are unique to the particular stock and the current moment in its time series. AAPL’s long term Bullish trend was mature (187 weeks) and after its recent dip - the stock is down 26% in the past 13-weeks, underperforming the S&P 500 index by 24% (Relative Strength indicator is 76) – fell into a Weak Bullish (

) trend category for 8 weeks before inevitably yielding to its current Bearish Crossover (

) category. Often called the ‘Death Cross’, this dip of the intermediate-term moving average trend line below the long-term moving average trend line is a lagging, but important signal.
These observations, along with other data points like share price and volume, may be specific to AAPL currently, but they also share similarity to other observations in the data history. Assuming similar trend, momentum and volume characteristics reflect similar market characteristics – a big cap stock that has deflated price momentum and an established bull trend coming to an end, for example – statistical analysis of the probable outcomes in the following period give us a baseline expectation of how the market may respond.
All events can be summarized with statistical metrics. That is the basic task of statistical analysis. Given a large enough sample size we can derive some meaning from the observations. What is the average value (the subsequent price performance after an observation) and how do the values deviate from that mean? What is the variance of the values? Most importantly, what does the distribution of those values look like? Are the observations skewed or concentrated near a range of values? We need to know that distribution to understand the characteristics of the sample. Using a set of descriptive statistics and other more involved statistical methods we can better understand what our data says, and how meaningful it is in predicting future results.
Let’s look at the statistics provided by the current AAPL Stock Trends Report. Apple’s share price characteristics – including the longevity of its previous bullish trend, the recent retreat of the stock, its relative performance to the broad market over the preceding 13-weeks, as well as its relatively high share price – are actually shared by other stocks at other times. Yes, Apple is a unique corporate entity with intrinsic valuations that reflect a well capitalized equity base – a marriage of capital and goodwill that has been unmatched in our history. But that does not in itself make it unique in terms of market responses to its changing valuation.
The market responds in a predictable fashion when confronted with the same emotional challenge. Will I lose money or not? That is the question that investors try to answer every day. When the market responds, the trend and momentum indicators will correspond across issues, across time. If AAPL has been trending bullishly, but has retreated, other stocks have done the same.
Let’s find ‘like’ instances of the trend and momentum indicators. For the AAPL example, which I chose here because the sample size will be very limited - there are few comparables. In terms of relative liquidity there are scant instances that share AAPL’s current trend and momentum characteristics. In fact, there is just one obvious comparable: Google (
GOOG) on March 14, 2008.
GOOG was a Bearish Crossover on that date, and had just closed out a long-term bullish trend, an impressive swell since its initial public offering in 2004. But its stock, like that of Apple now, had retreated from a high of $747 to its close of $437.92 when it was tagged as a Bearish Crossover. GOOG was underperforming the S&P 500 index by 28% over the previous three months. For the first time investors were beginning to question the mighty ship Google. Investor sentiment had turned against the stock. What followed its Bearish Crossover was an immediate share price rally back up to the $600 level, but a continued Stock Trends Bearish trend that was ultimately submerged fully by the financial meltdown that rocked markets later in the year.
However, one observation does not make for good analysis. If we broaden the scope of inclusion, the current AAPL observation – its Bearish Crossover, its price retreat – has other matching observations in the last 30 years. Of stocks with the same characteristics, and a share price of at least $100, there are 117 records that can be isolated. If we have a look at subsequent price performance of this group we find that 37% are down by at least 5% at the 4-week period, and 30% are down by at least 20% at the 13-week period. The average 4-week change is negligible, the average 13-week change is -5%.
Of these matching observations, some familiar names are notable. Amazon’s stock (
AMZN) had a Bearish Crossover in January of 2012 after an extended Bullish trend. It remained depressed for months before returning to a bullish trend by mid-year. Other stocks in this grouping include NetFlix (
NFLX) on September 30, 2011. A strange bedfellow with Apple, you think? But again, a stock that had a considerable run only to fizzle amid a growing band of naysayers. Remember Potash Corp (
POT). in 2008? It’s stock had the same observation and an army of investors who thought the bloom had gone off its flower.
In any case, we should better understand a particular distribution of subsequent returns after an observation if we can compare it to a larger set from the population. How does the behaviour of the set of 117 records referenced here compare to the behaviour of the whole (i.e. all observations of a Bearish Crossover and a Relative Strength indicator in the range of AAPL’s 76)?
We cannot say definitively that Apple’s shares will continue in a Bearish trend or that its share price will continue its current rate of descent. However, we can assign some probability that it will based on how the market has responded to similar trend and momentum matches. The moving average crossovers, both Bullish and Bearish, are events that are simple to isolate. If we evaluate the over 23,000 Bearish Crossovers that have had Relative Strength values within a range of 10% plus or minus of AAPL’s 76, we find that both the probable outcomes for at least a 5% loss at 4-weeks and at least a 20% loss at 13-weeks to be lower. The distribution of outcomes for the sample that isolates large cap instances shows a greater likelihood of losses going forward than the distribution of outcomes for the larger sample size.
Apple, surely, is a unique company. It has many passionate followers, both consumers and investors alike. However, the current market sentiment has added definite downside risk that should not be ignored. Institutional portfolio managers will be unfazed, either because their mandate does not allow divesture, or their fundamental valuation remains intact. However, general retail investors should now be aware that AAPL has moved into a new realm of uncertainty that has implied downside risk. Say goodbye to the Apple of shining, undiminished accomplishment. Say hello to Apple with a worm hole or two.
 I am just writing to tell you of my appreciation of your service! It makes so much sense to me. You seem to be an oasis of stability and sensibility in a stockmarket jungle.


